. 2017 Apr 26;12(4):e0174996.
doi: 10.1371/journal.pone.0174996. eCollection 2017.

Delayed histochemical alterations within the neurovascular unit due to transient focal cerebral ischemia and experimental treatment with neurotrophic factors

Affiliations

Delayed histochemical alterations within the neurovascular unit due to transient focal cerebral ischemia and experimental treatment with neurotrophic factors

Dominik Michalski et al. PLoS One. .

Abstract

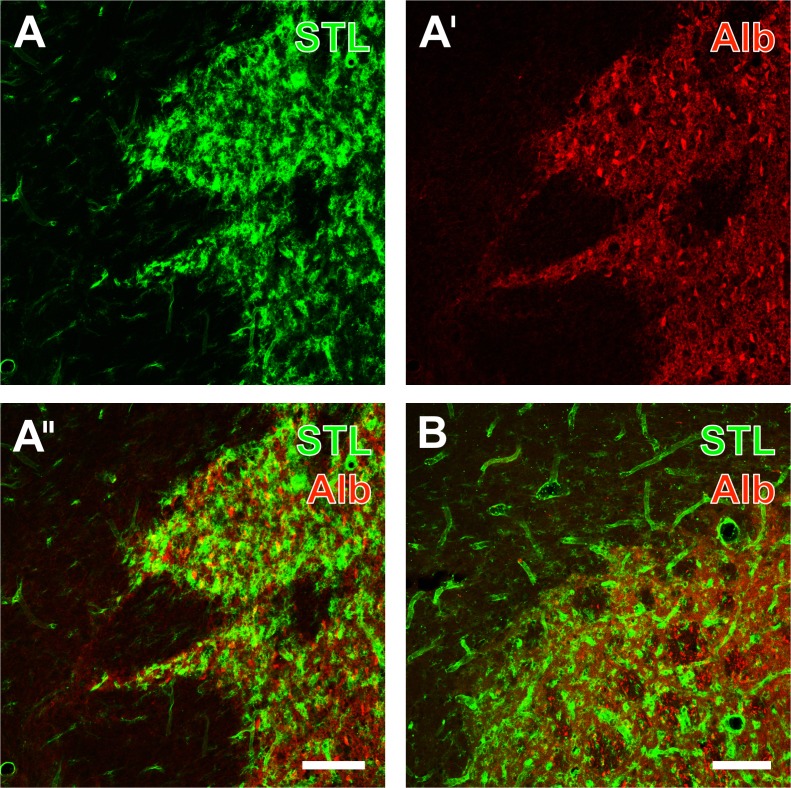
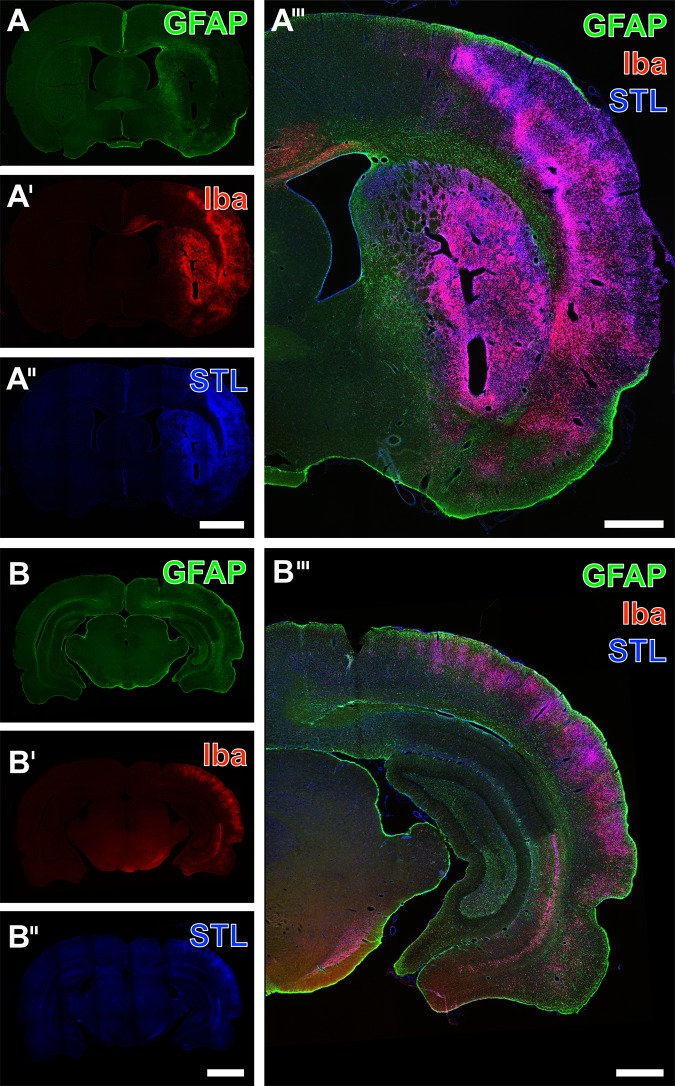
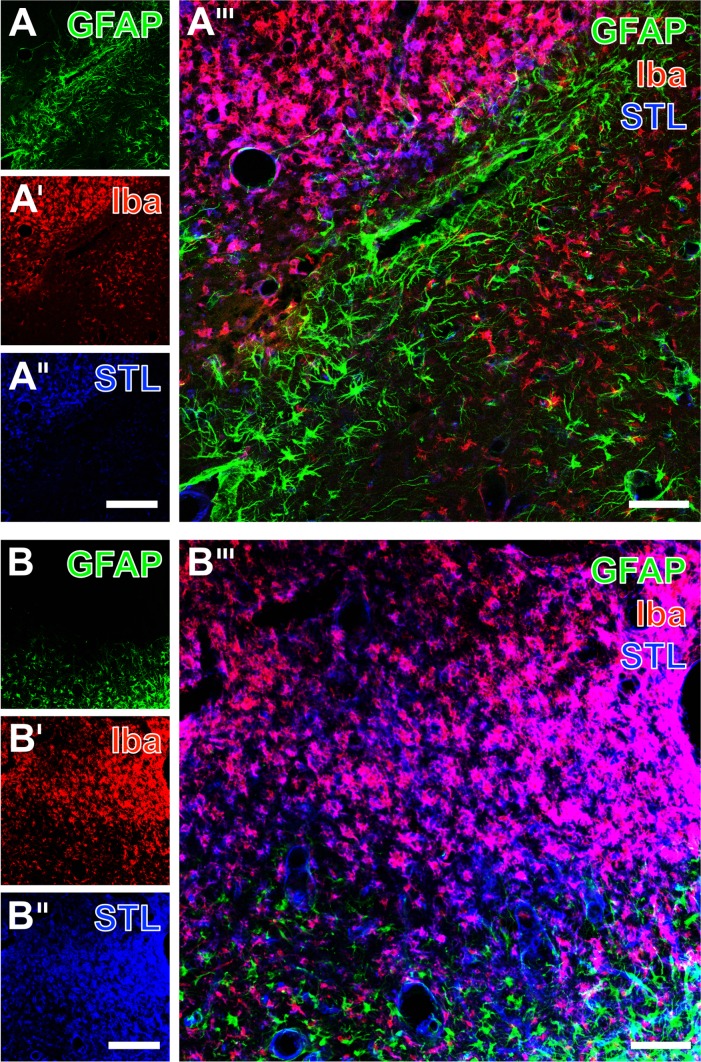
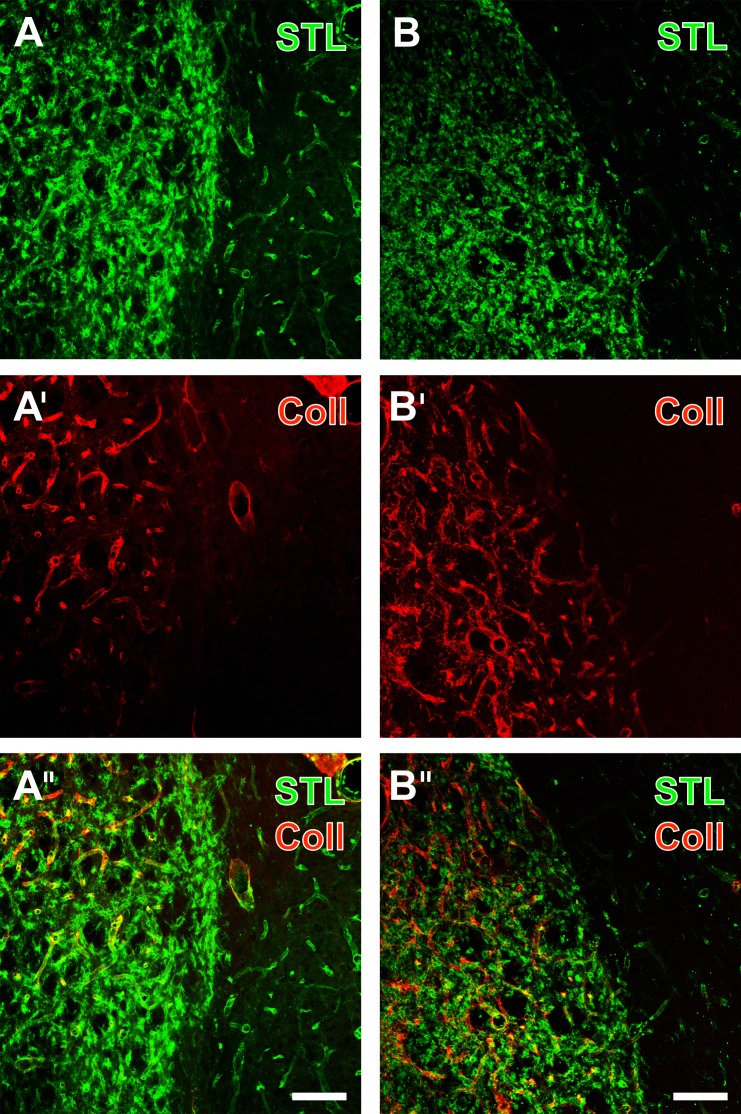
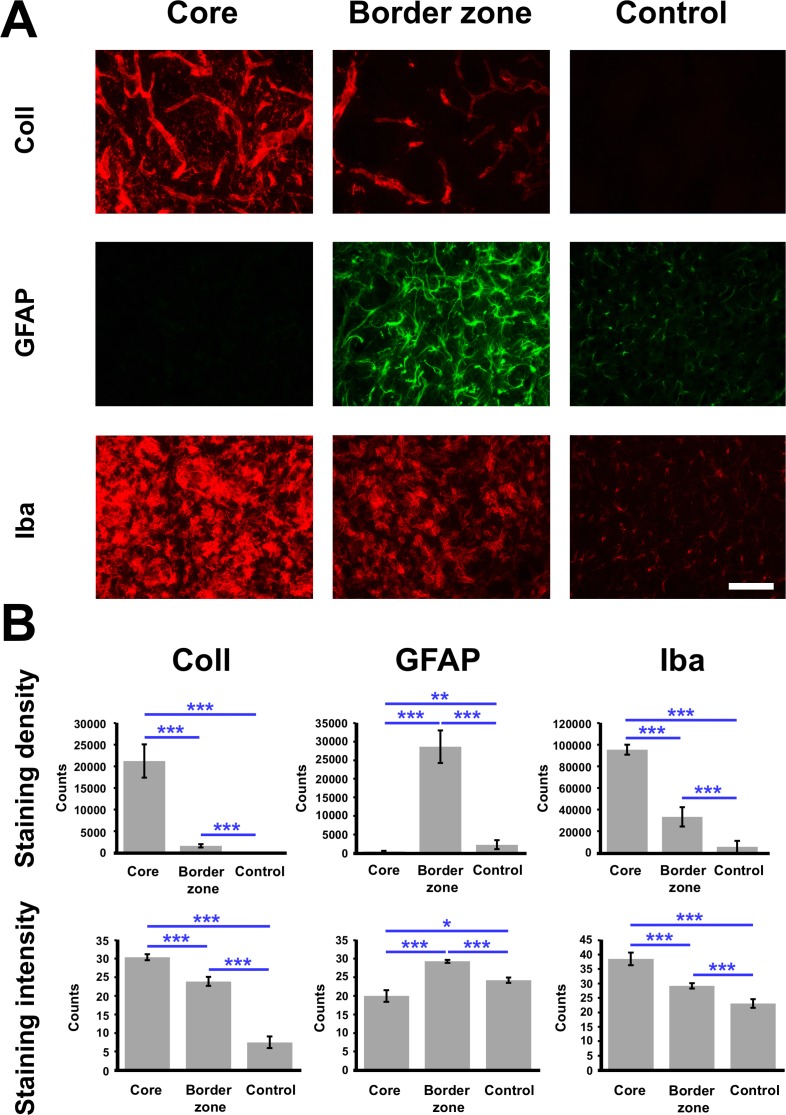
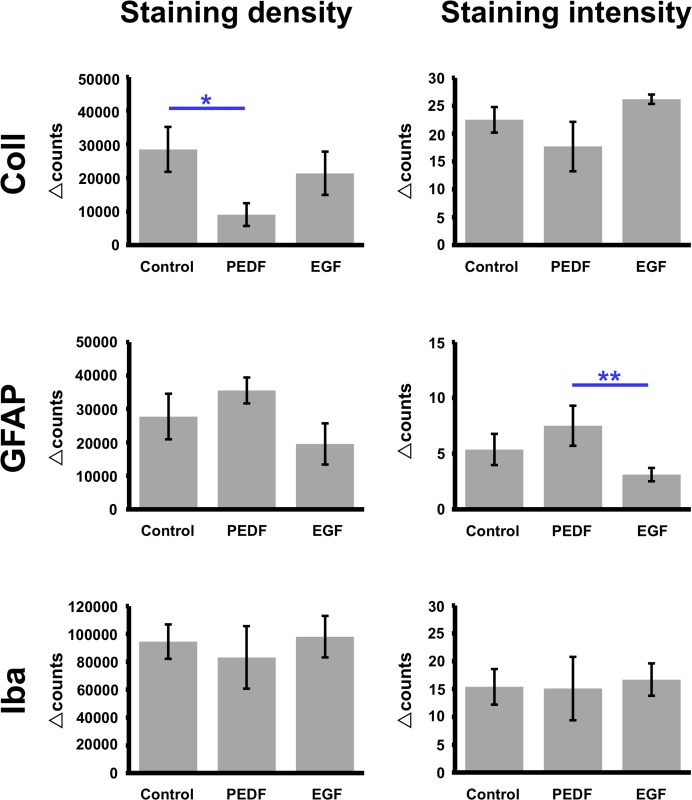
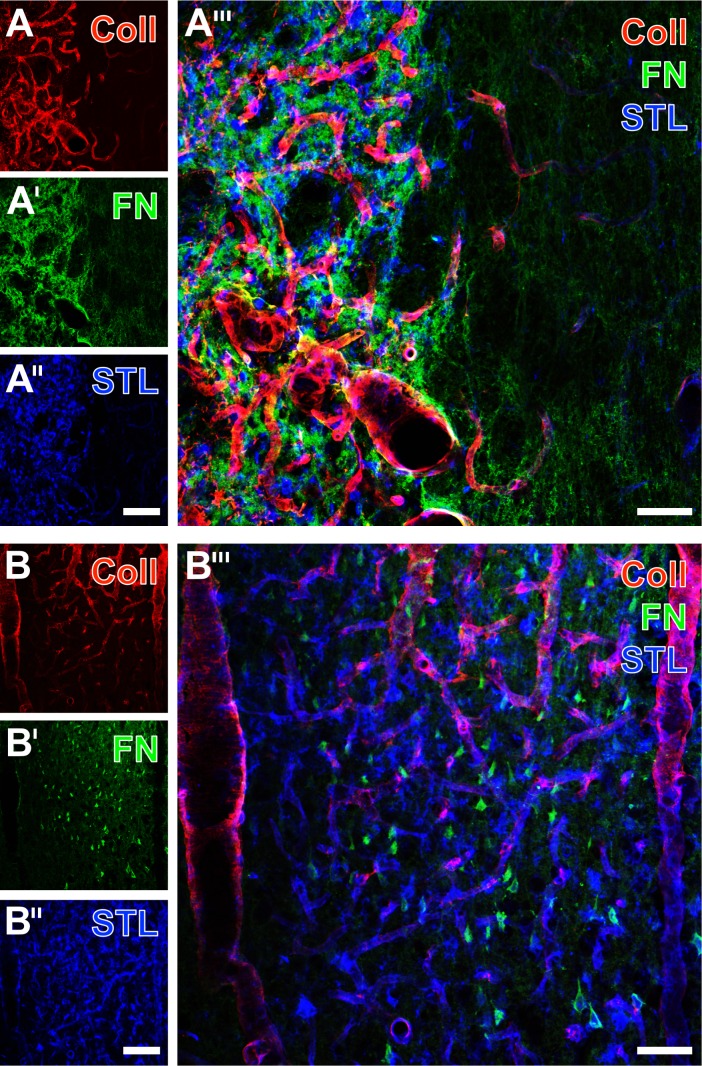
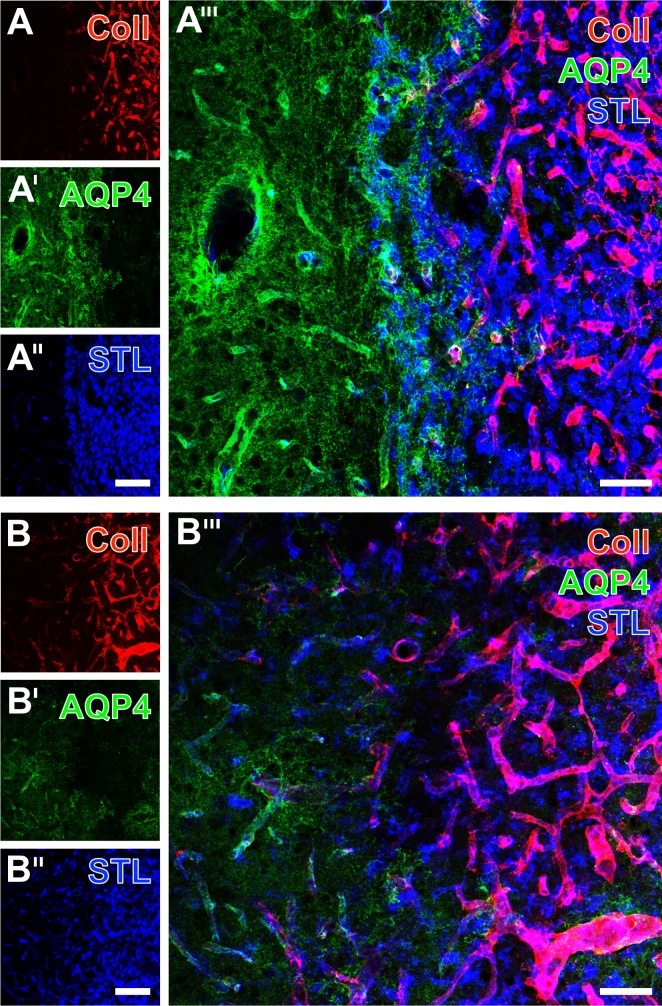
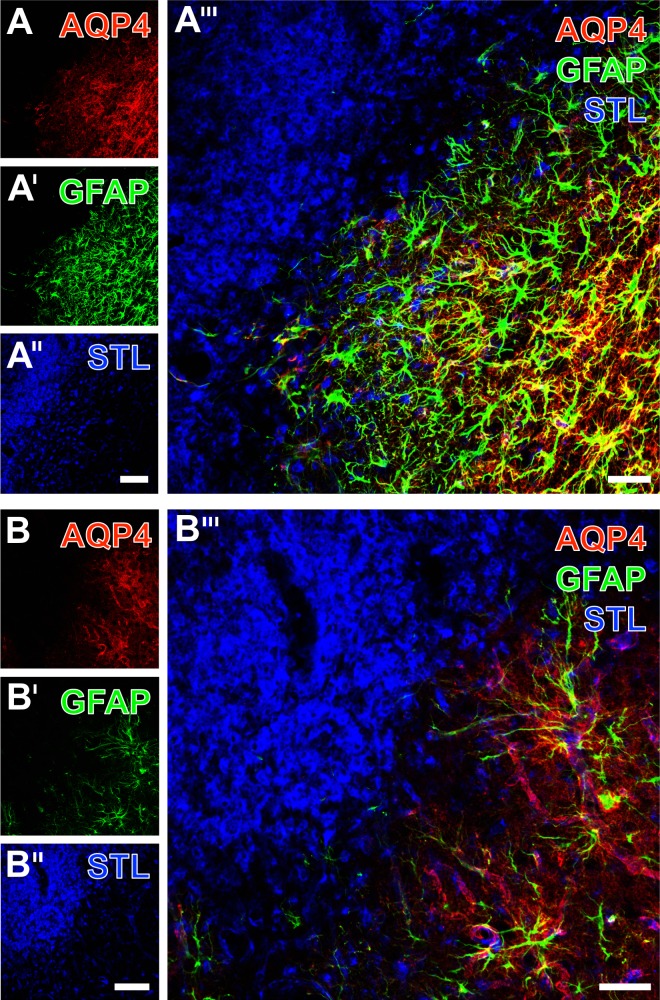
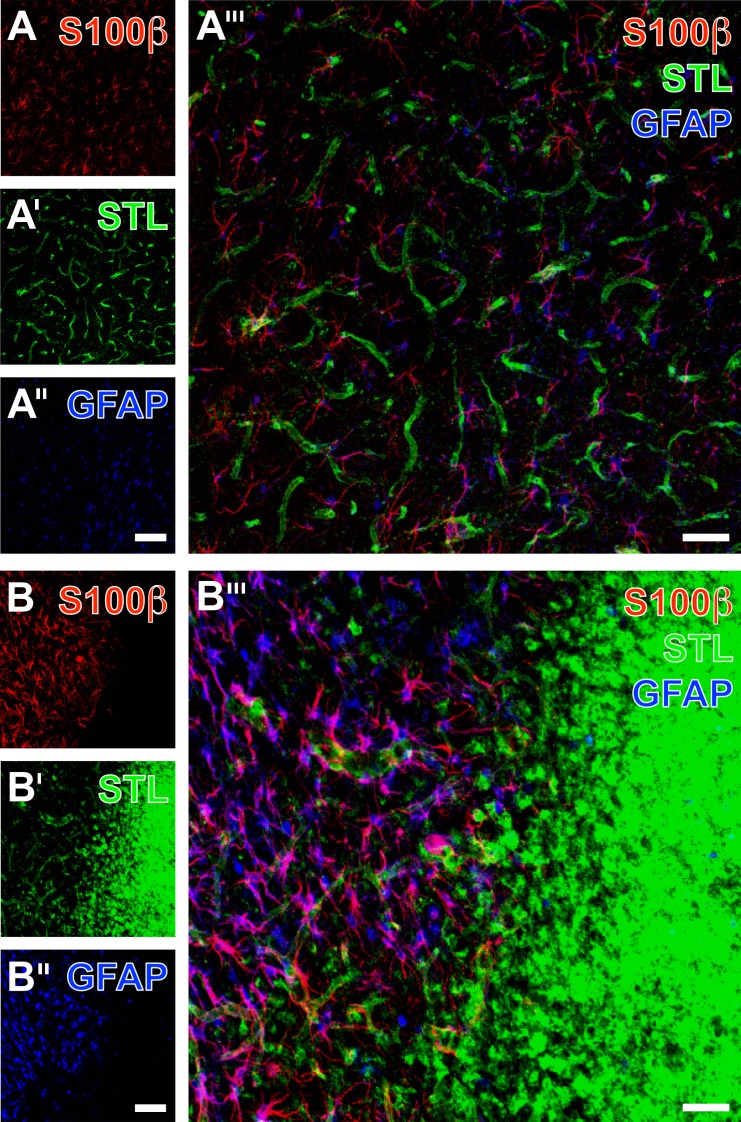
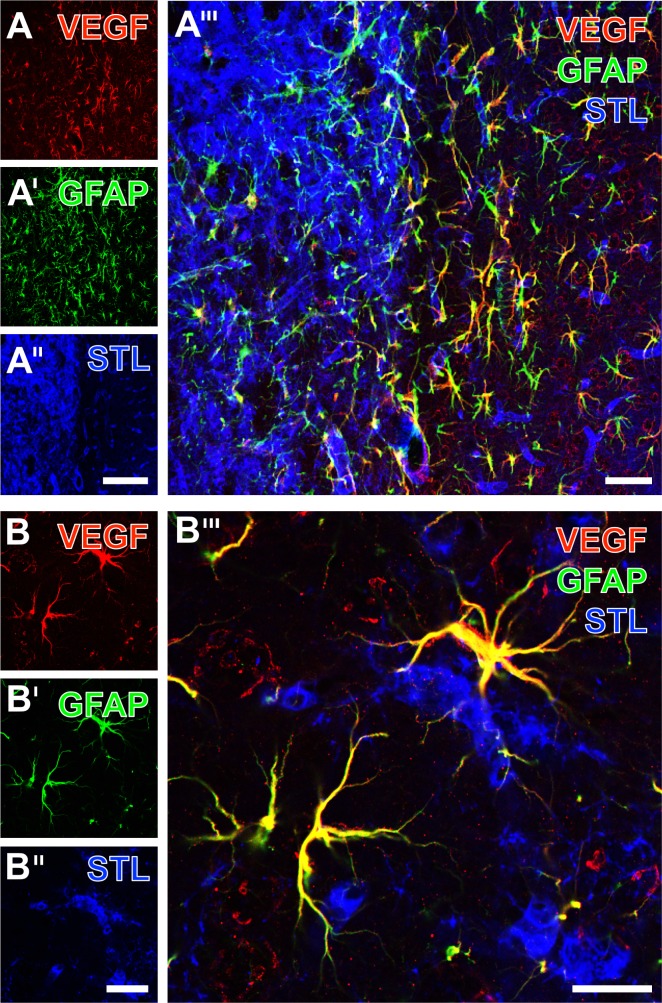
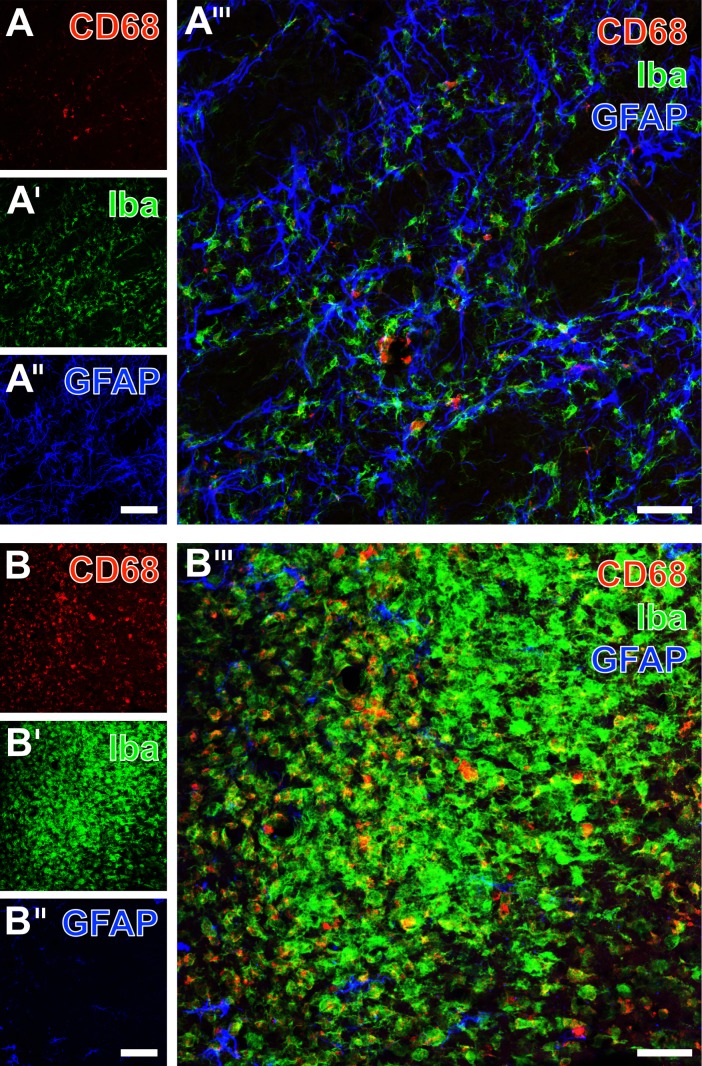
Current stroke therapy is focused on recanalizing strategies, but neuroprotective co-treatments are still lacking. Modern concepts of the ischemia-affected neurovascular unit (NVU) and surrounding penumbra emphasize the complexity during the transition from initial damaging to regenerative processes. While early treatment with neurotrophic factors was shown to result in lesion size reduction and blood-brain barrier (BBB) stabilization, cellular consequences from these treatments are poorly understood. This study explored delayed cellular responses not only to ischemic stroke, but also to an early treatment with neurotrophic factors. Rats underwent 60 minutes of focal cerebral ischemia. Fluorescence labeling was applied to sections from brains perfused 7 days after ischemia. Analyses focused on NVU constituents including the vasculature, astrocytes and microglia in the ischemic striatum, the border zone and the contralateral hemisphere. In addition to histochemical signs of BBB breakdown, a strong up-regulation of collagen IV and microglia activation occurred within the ischemic core with simultaneous degradation of astrocytes and their endfeet. Activated astroglia were mainly depicted at the border zone in terms of a glial scar formation. Early treatment with pigment epithelium-derived factor (PEDF) resulted in an attenuation of the usually up-regulated collagen IV-immunoreactivity. However, glial activation was not influenced by treatment with PEDF or the epidermal growth factor (EGF). In conclusion, these data on ischemia-induced cellular reactions within the NVU might help to develop treatments addressing the transition from injury towards regeneration. Thereby, the integrity of the vasculature in close relation to neighboring structures like astrocytes appears as a promising target.


Conflict of interest statement

Competing Interests: The authors have declared that no competing interests exist.

Figures

Fig 1
Fig 1. Combined staining of endothelial cells and albumin-immunoreactivity indicating significant alterations blood-brain barrier (BBB) integrity 7 days after transient focal cerebral ischemia in the neocortex and the striatal border region.
Lectin-histochemical staining with biotinylated Solanum tuberosum lectin (STL) and Cy2-streptavidin (A) revealed a persisting, but thinned endothelium in stroke-affected neocortical areas. The concomitant Cy3-immunolabeling based on rabbit-anti-serum albumin (Alb, A’) showed the BBB permeability marker within the parenchyma which became even clearer by the merged picture (A”). The overlay of STL and albumin clearly revealed stroke-induced leakage of the BBB resulting in intra-parenchymal albumin-immunoreactivity also visible in several perikarya, whereas another animal displayed less albumin-immunopositive somata in an infarcted striatal border region (B). Scale bar in A” (also valid for A and A’) = 75 μm, in B = 100 μm.
Fig 2
Fig 2. Exemplified overview scans of carbocyanine triple fluorescence labeling of GFAP in astroglia, Iba as marker for microglia/macrophages and STL-binding sites of endothelial cells as well as macrophages 7 days after transient focal cerebral ischemia in non-treated rats.
GFAP-immunoreactivity appeared decreased in areas of ischemia-related tissue damage of both the striatum and the neocortex (A, B). On the contrary, enhanced Iba-immunoreactivity (A’, B’) and STL-staining (A”, B”) were found in the ischemic areas. Merge of the staining patterns impressively visualized concomitant cellular alterations in the ischemia-affected striatum and neocortex. Scale bar in A” (also valid for A and A’) = 250 μm, in B” (also valid for B and B’) = 250, in A”‘ and B”‘ = 100 μm.
Fig 3
Fig 3
Triple fluorescence-based staining of GFAP (astroglia), Iba (microglia/macrophages) and STL-binding (endothelial cells as well as macrophages) at the ischemia-affected striatum (A-A”‘) and neocortex (B-B”‘) of non-treated animals. Thereby, Cy2-immunolabeling of GFAP demonstrated a glial scar formation composed of activated astrocytes (A) which was nearly devoid of Cy3-immunosignals for Iba (A’) and separates ramified microglia in the apparently less affected tissue from numerous ameboid cells in the ischemic region, which also showed a strong Cy5-staining of STL (color-coded in blue; A”). Merging the staining patterns clearly demonstrated the allocation of Iba-immunoreactivity and STL-binding sites in purple-appearing cells (A”‘). Neocortical Cy2-immunolabeling of GFAP revealed a pattern of apparently activated astrocytes (B), and in upper layers numerous ameboid microglia/macrophages, revealed by Cy3-immunodecoration of Iba (B’) and Cy5-staining of STL (color-coded in blue; B”)–appearing purple in the overlay (B”‘). Scale bars: in A” and B” (also valid for A, A’, B and B’) = 200 μm, in A”‘ and B”‘ 75 = μm.
Fig 4
Fig 4
Fluorescence-based staining of binding sites for STL in endothelial cells and activated microglia/macrophages (Cy2, green) combined with Cy3-immunolabeling of collagen IV (Coll, red) in the basal membranes 7 days after transient focal cerebral ischemia in the border region between neocortex and infarcted striatum from an EGF-treated animal (A-A”) and from a non-treated rat (B-B”). Selectively STL-marked striatal endothelial cells (A) were found to appear sharply separated from the ischemia-affected region, which was predominantly filled by activated microglia/macrophages. Additionally stained vessels were frequently and strongly immunolabeled for collagen IV (A’), while the allocation of both markers became clearly visible in the merged figure (A”). Similarly, STL-staining in tissues from the non-treated group clearly delineated the ischemia-affected lateral striatum, containing many activated microglia/macrophages and the neocortex devoid of such cells, but displayed weaker stained endothelial cells (B). Concomitantly revealed collagen IV-immunoreactivity was strongly up-regulated solely in the ischemic striatum (B’) in close vicinity to immune cells (B”). Scale bar in A” and B” (also valid for all other micrographs) = 100 μm.
Fig 5
Fig 5
Exemplified fluorescence staining of collagen IV (Coll), GFAP and Iba depending on the region with respect to the primary ischemic lesion, i.e. the ischemic core, the ischemic border zone and a control area located at the contralateral, non-affected hemisphere (A) and respective quantification in the overall sample (B). A strong immunolabeling was found for collagen IV and Iba at the ischemic core, diminishing towards the border zone and the control region, while most impressive GFAP-immunostaining was seen at the ischemic border zone in terms of a glial scar formation. Quantitative analyses confirmed the qualitative findings in terms of a most prominent up-regulation of immunoreactivities for collagen IV and Iba in the ischemic core, while the strongest immunoreactivity for GFAP was seen at the ischemic border zone. Scale bar: in A (also valid for all other micrographs) = 75 μm. Bars represent means and added lines represent the standard error of means. *, p < 0.05; **, p < 0.01; ***, p < 0.001.
Fig 6
Fig 6. Quantitative analyses of immunoreactivities for collagen IV (Coll), GFAP and Iba in terms of inter-hemispheric differences (Δ-vales) with respect to the contralateral, non-affected side, depending on experimental treatment with neurotrophic factors.
Treatment with PEDF was found to significantly attenuate the usually detected up-regulation of collagen IV in ischemia-affected subcortical regions, whereas EGF did not influence collagen IV expression as compared to the control group. However, experimental treatment with PEDF and EGF did not alter immunosignals for GFAP and Iba significantly as compared with the control group. When focusing on potential effects between both experimental treatment, EGF resulted in an attenuation of the usually up-regulated GFAP-immunoreactivity when compared to the treatment with PEDF. Bars represent means and added lines represent the standard error of means. *, p < 0.05; **, p < 0.01.
Fig 7
Fig 7. Correlation plots visualizing Δ-values for collagen IV and GFAP in the overall sample and with respect to experimental treatment with neurotrophic factors.
r, Pearson correlation coefficient; n.s., non significant.
Fig 8
Fig 8
Triple fluorescence staining of fibronectin (FN), collagen IV (Coll) and STL in the striatum (A-A”‘) and at the neocortex (B-B”‘) of non-treated rats 7 days after transient focal cerebral ischemia. Dense Cy2-immunolabeling of FN (A’) was seen in the ischemia-affected region simultaneously showing strongly up-regulated collagen IV-immunoreactivity (A) intermingled by lectin-histochemically stained microglia/macrophages (A”, STL color-coded in blue). Concomitantly, STL revealed some apparently healthy endothelial cells in the surrounding tissue. Merging the staining patterns (A”‘) revealed that the region with up-regulated collagen IV was somewhat more extended than the regions with enhanced signals for fibronectin and microglia/macrophages. Fibronectin staining in the neocortex (B’) elucidated this protein not only in the neuropil, but also in numerous somata within the ischemia-affected tissue, which displays only partially up-regulated collagen IV (B) and persisting STL-stained vessels (B”). Merging the staining patterns (B”‘) showed some fibronectin-containing cells with STL-labeling. Scale bars: in A” and B” (also valid for A, A’, B and B’) = 100 μm, in A”‘ and B”‘ = 50 μm.
Fig 9
Fig 9
Concomitant Cy-staining of collagen IV (Coll), aquaporin-4 (AQP4) and STL-binding sites in the lateral striatal border (A-A”‘) and in the neocortex (B-B”‘), exemplarily shown in non-treated rats 7 days after transient focal cerebral ischemia. The strongly up-regulated collagen IV (A) was absent in the complementary aquaporin-4-stained region (A’), displaying both immunoreactive vessels and neuropil. In parallel, STL-staining (A”) showed some faintly appearing vessels in the aquaporin-4-immunopositive region and densely populated microglia/macrophages, mostly allocated with up-regulated vascular collagen IV. The overlay of the staining patterns (A”‘) revealed a turquoise rim with preserved aquaporin-4-immunoreactivity and STL-positive immune cells, but devoid of collagen IV-immunolabeling. In a representative neocortical ischemic border zone (B), aquaporin-4-immunostaining was mostly found in vessels and the neuropil of hardly affected tissue. However, some vessels with allocated aquaporin-4 and collagen IV–as signs for ischemic tissue–were observed (lower part in B, B’). Concomitantly up-regulated collagen IV (B’) and the predominantly vascular-associated STL-staining (B”) appeared not completely in a complementary manner, which became even clearer after merging the staining patterns (B”‘). Scale bars: in A” and B” (also valid for A, A, B and B’) = 100 μm, in A”‘ and B”‘ = 50 μm.
Fig 10
Fig 10. Simultaneous detection of aquaporin-4 (AQP4) on astrocytic endfeet, glial fibrillary acidic protein (GFAP) revealing a large portion of astroglia and STL in endothelial cells and microglia/macrophages at the ischemic striatum of non-treated rats.
Aquaporin-4-immunostaining (A) in both the vessels and neuropil remained absent at the infarcted tissue and became only visible in the surrounding, apparently less affected tissue, which displayed numerous activated astrocytes as indicated by a strong GFAP-immunoreactivity (A’). This region also contained some vessels stained by STL (A”), but this marker predominantly revealed densely packed microglia/macrophages in the ischemic region. Merging these staining patterns elucidated the complementary occurrence of immune cells and both astroglial markers. At higher magnification (B), the sharp border between a zone with vascular aquaporin-4-immunoreactivity and the infarcted zone devoid of immunosignals became clearly visible. Concomitant GFAP-staining (B’) visualized strongly activated astrocytes with numerous thickened processes reaching the region with densely packed, and STL-labeled microglia/macrophages (B”), which was even better visible after merging the staining patterns (B”‘). Scale bars: in A” and B” = 100 μm, in A”‘ and B”‘ = 50 μm.
Fig 11
Fig 11. Immunofluorescence labeling of the astroglial markers S100β and GFAP combined with the lectin-histochemical staining of STL-binding sites in the non-affected versus the ischemia-affected neocortex from non-treated rats 7 days after transient focal cerebral ischemia.
S100β-immunoreactivity (A, B) was visible in numerous astrocytes displaying their somata in both the ischemia-affected and the naive tissue. In contrast, anti-GFAP predominantly visualized fine astroglial processes in the non-affected region (A”), while the ischemic hemisphere was characterized by the visualization of GFAP-positive astroglial somata and processes with an activated appearance (B”). Remarkably, the ischemic region displayed numerous STL-marked microglia/macrophages (B’). The overlay of all 3 staining patterns revealed the complementary occurrence of immune cells and astroglial under ischemic conditions (B”‘). While most astrocytes co-expressed S100β and GFAP and therefore appeared purple, a few red cells were obviously mono-labeled with anti-S100β. Scale bar in A” (also valid for A and A’) = 100 μm, in B” (also valid for B and B’) = 100 μm, and in A”‘ and B”‘ = 50 μm.
Fig 12
Fig 12
Immunofluorescence labeling of the vascular endothelial growth factor (VEGF) combined with GFAP- and STL-staining 7 days after transient focal cerebral ischemia in the EGF-treated (A-A”‘) and in the control group (B-B”‘). At the striatal border zone, the VEGF-staining appeared most prominent in cells with an activated morphological appearance, which also displayed astroglial GFAP-immunolabeling (A”‘). Concomitantly, STL-binding sites (A”) were seen in allocated vessels, whereas the endothelial cells in infarcted striatal tissue were dominated by allocated microglia/macrophages. The merged staining patterns (A”‘) elucidated those regions filled with immune cells surrounded by numerous, yellowish appearing activated astrocytes co-expressing VEGF and GFAP. At a higher magnification of the striatum from a control animal, immunolabeling of VEGF (B) and GFAP (B’) revealed somata and fine processes of astrocytes in the vicinity of the infarcted region. Concomitant STL-staining (B”) predominantly detected endothelial cells, and the merger of staining patterns demonstrated the close regional association of astroglial processes and vessels. Scale bars: in A” (also valid for A and A’) = 150 μm, in A”‘ = 50 μm, in B” (also valid for B and B’) = 25 μm, and in B”‘ = 15 μm.
Fig 13
Fig 13
Fluorescence labeling of the immune cell markers CD68 and Iba combined with GFAP-immunodetection 7 days after focal cerebral ischemia in the striatum from an animal of the EGF group (A-A”‘) and the neocortex from a rat of the control group (B-B”‘). The macrophage marker CD68 (A) was observed in several, mostly ameboid cells in the infarcted tissue, while Iba-immunoreactivity (A’) was seen in many more microglia/macrophages. Both markers appeared embedded in a network of activated GFAP-stained astroglia (A”), which became even clearer by merging the staining patterns (A”‘). In the ischemia-affected neocortex, CD68-immunolabeling (B) was predominantly found in numerous ameboid cells, whereas Iba (B’) was expressed in even more microglia/macrophages. Concomitant GFAP-staining (B”) revealed some activated astrocytes, but also larger infarcted areas devoid of this marker. The overlay of staining patterns (B”‘) also visualized macrophages co-expressing CD68 (red) and Iba (green), indicated by a yellow appearing rims. Scale bars: in A” and B” (also valid for A, A’, B and B’) = 100 μm, in A”‘ and B”‘ = 50.

Similar articles

Cited by

References

    1. Donnan GA, Fisher M, Macleod M, Davis SM. Stroke. Lancet. 2008; 371: 1612–1623. doi: 10.1016/S0140-6736(08)60694-7 - DOI - PubMed
    1. Mozaffarian D, Benjamin EJ, Go AS, Arnett DK, Blaha MJ, Cushman M, et al. Executive Summary: Heart Disease and Stroke Statistics– 2016 Update: A Report From the American Heart Association. Circulation. 2016; 133: 447–454. doi: 10.1161/CIR.0000000000000366 - DOI - PubMed
    1. Hacke W, Kaste M, Bluhmki E, Brozman M, Dávalos A, Guidetti D, et al. Thrombolysis with alteplase 3 to 4.5 hours after acute ischemic stroke. N Engl J Med. 2008; 359: 1317–1329. doi: 10.1056/NEJMoa0804656 - DOI - PubMed
    1. Friedrich B, Gawlitza M, Schob S, Hobohm C, Raviolo M, Hoffmann KT, et al. Distance to thrombus in acute middle cerebral artery occlusion: a predictor of outcome after intravenous thrombolysis for acute ischemic stroke. Stroke. 2015; 46: 692–696. doi: 10.1161/STROKEAHA.114.008454 - DOI - PubMed
    1. Heiss WD. Malignant MCA Infarction: Pathophysiology and Imaging for Early Diagnosis and Management Decisions. Cerebrovasc Dis. 2016; 41: 1–7. - PubMed

MeSH terms