

Pattern classification of EEG signals reveals perceptual and attentional states
- PMID: 28445551
- PMCID: PMC5405963
- DOI: 10.1371/journal.pone.0176349
Pattern classification of EEG signals reveals perceptual and attentional states
Abstract
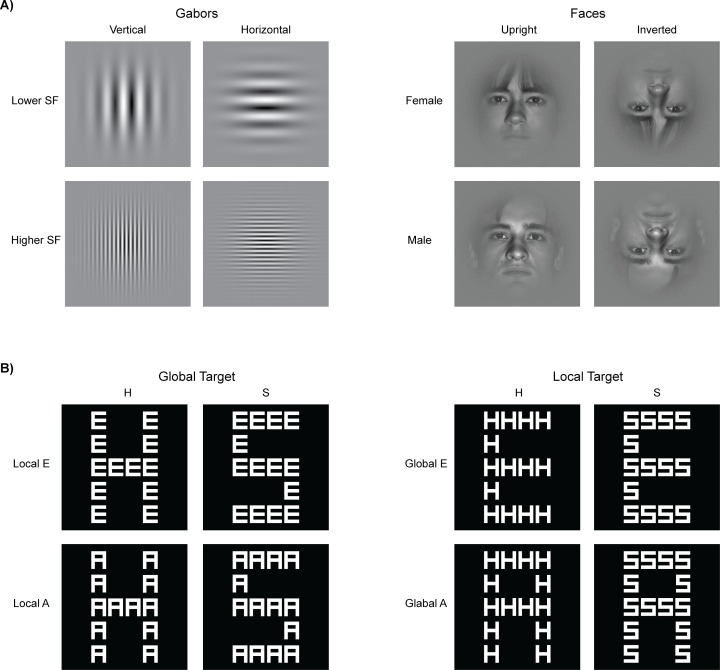
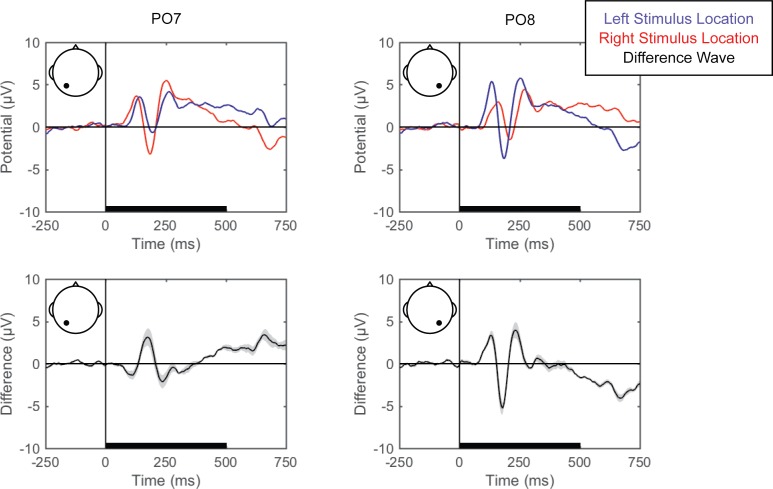
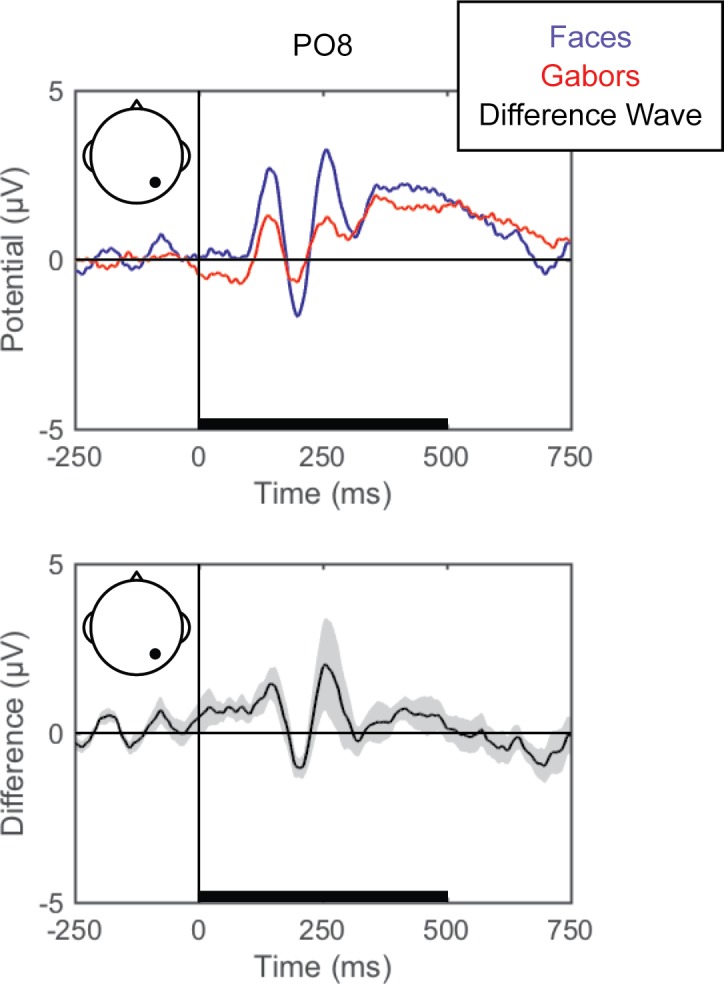
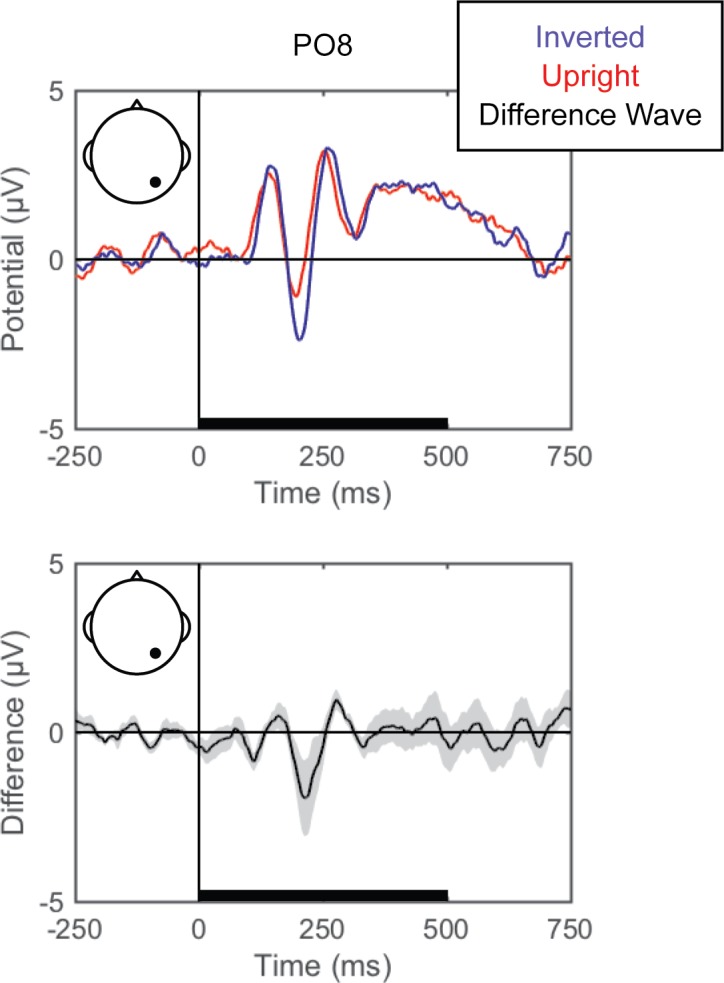
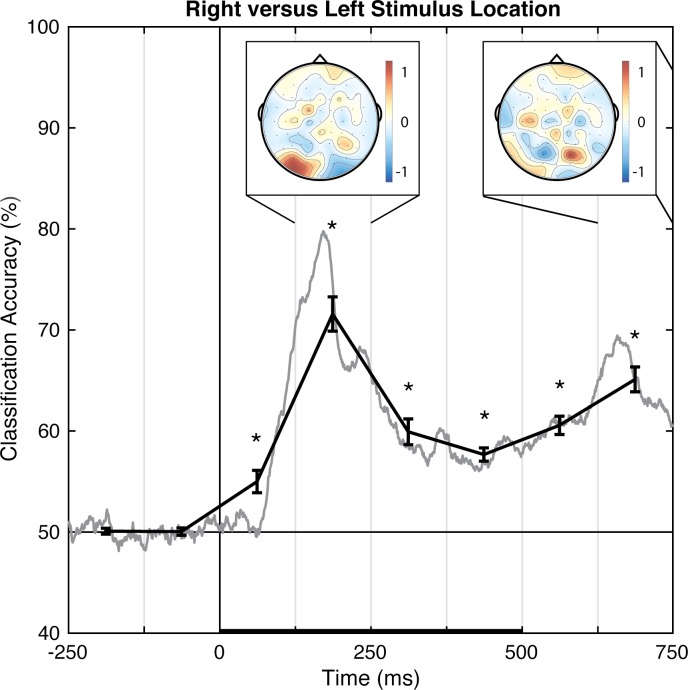
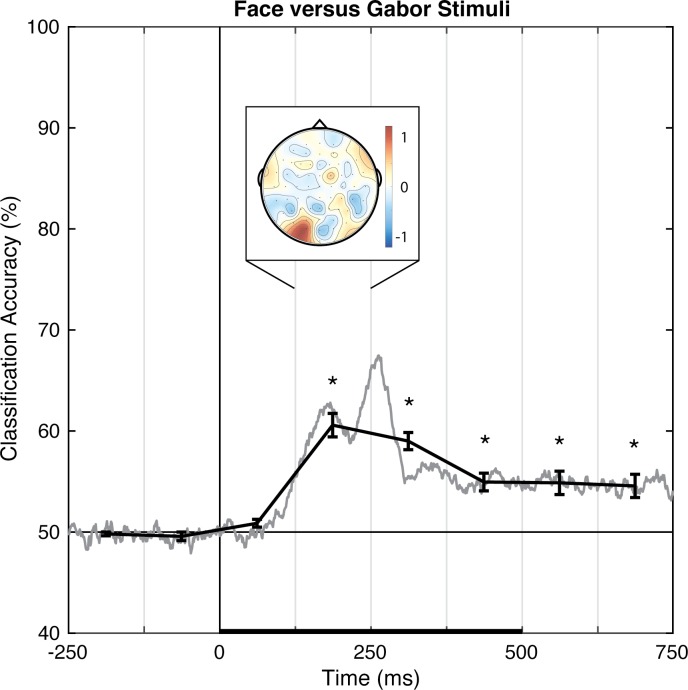
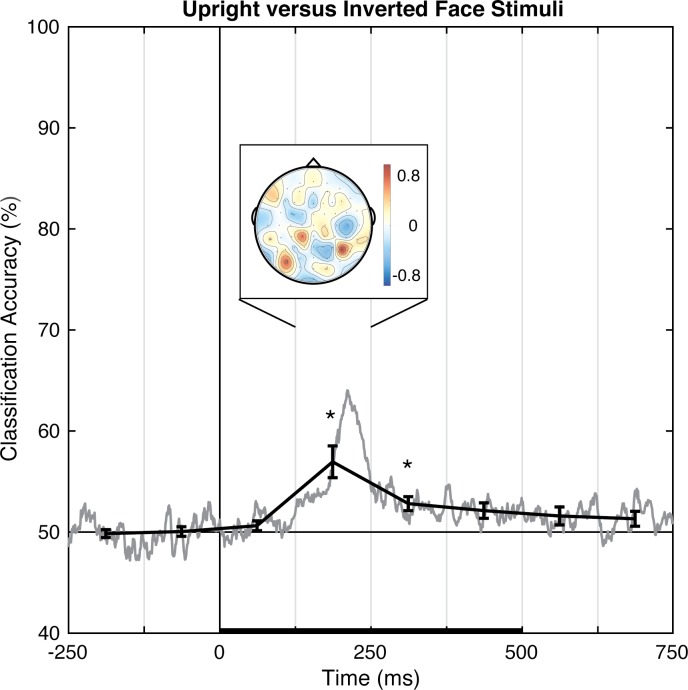
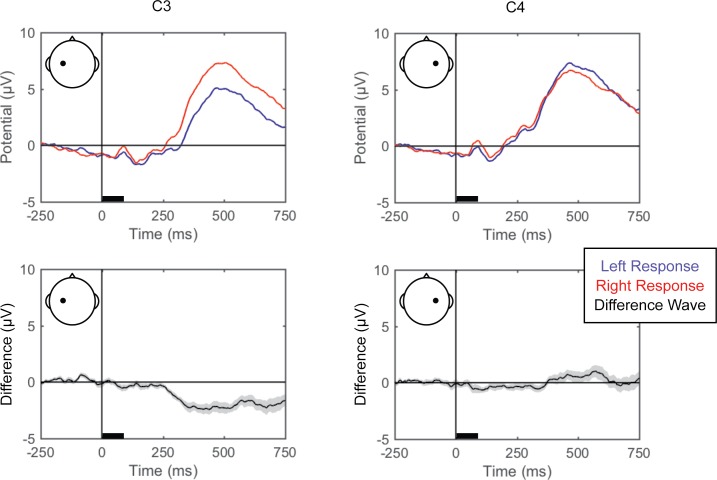
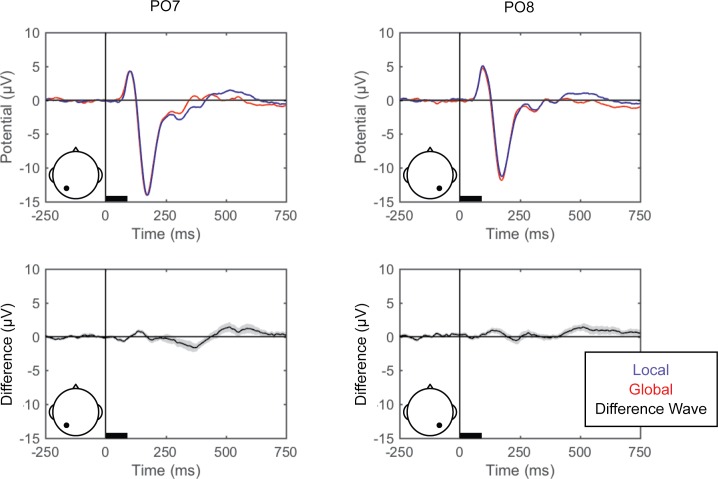
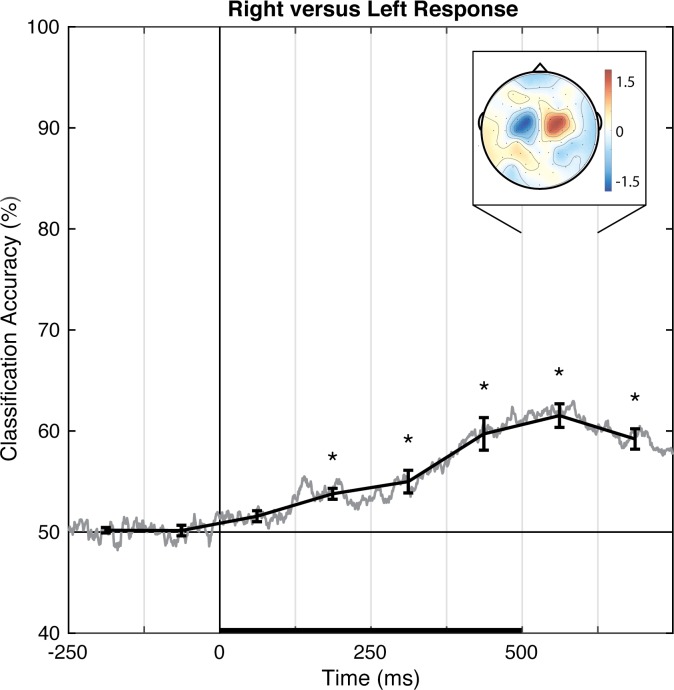
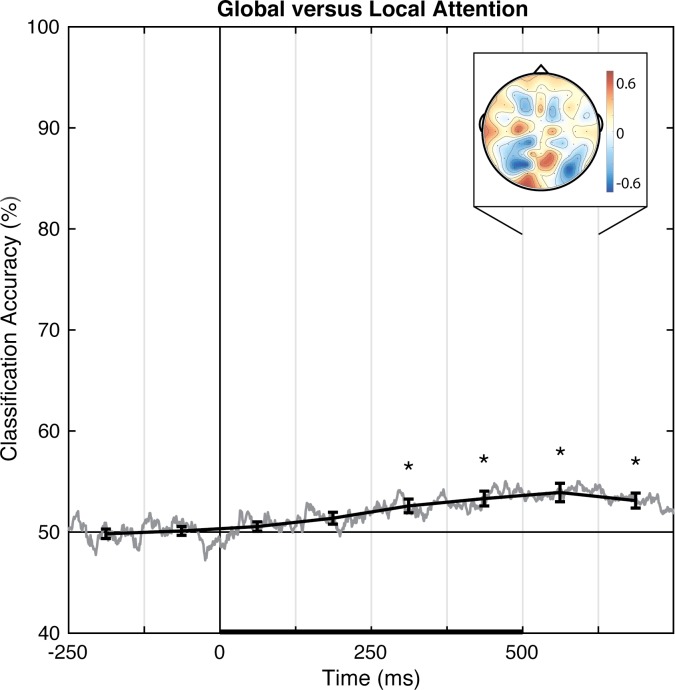
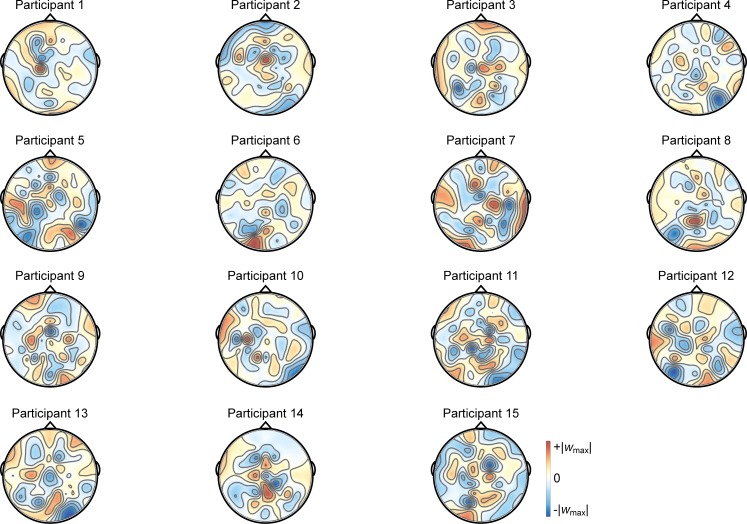
Pattern classification techniques have been widely used to differentiate neural activity associated with different perceptual, attentional, or other cognitive states, often using fMRI, but more recently with EEG as well. Although these methods have identified EEG patterns (i.e., scalp topographies of EEG signals occurring at certain latencies) that decode perceptual and attentional states on a trial-by-trial basis, they have yet to be applied to the spatial scope of attention toward global or local features of the display. Here, we initially used pattern classification to replicate and extend the findings that perceptual states could be reliably decoded from EEG. We found that visual perceptual states, including stimulus location and object category, could be decoded with high accuracy peaking between 125-250 ms, and that the discriminative spatiotemporal patterns mirrored and extended our (and other well-established) ERP results. Next, we used pattern classification to investigate whether spatiotemporal EEG signals could reliably predict attentional states, and particularly, the scope of attention. The EEG data were reliably differentiated for local versus global attention on a trial-by-trial basis, emerging as a specific spatiotemporal activation pattern over posterior electrode sites during the 250-750 ms interval after stimulus onset. In sum, we demonstrate that multivariate pattern analysis of EEG, which reveals unique spatiotemporal patterns of neural activity distinguishing between behavioral states, is a sensitive tool for characterizing the neural correlates of perception and attention.
Conflict of interest statement
Figures
Similar articles
-
A method to study global spatial patterns related to sensory perception in scalp EEG.J Neurosci Methods. 2010 Aug 15;191(1):110-8. doi: 10.1016/j.jneumeth.2010.05.021. Epub 2010 Jun 4. J Neurosci Methods. 2010. PMID: 20595034
-
Functional MRI and EEG Index Complementary Attentional Modulations.J Neurosci. 2019 Jul 31;39(31):6162-6179. doi: 10.1523/JNEUROSCI.2519-18.2019. Epub 2019 May 24. J Neurosci. 2019. PMID: 31127004 Free PMC article.
-
Predicting variations of perceptual performance across individuals from neural activity using pattern classifiers.Neuroimage. 2010 Jul 15;51(4):1425-37. doi: 10.1016/j.neuroimage.2010.03.030. Epub 2010 Mar 17. Neuroimage. 2010. PMID: 20302949
-
A brief introduction to the use of event-related potentials in studies of perception and attention.Atten Percept Psychophys. 2010 Nov;72(8):2031-46. doi: 10.3758/APP.72.8.2031. Atten Percept Psychophys. 2010. PMID: 21097848 Free PMC article. Review.
-
High-frequency brain activity: its possible role in attention, perception and language processing.Prog Neurobiol. 1997 Aug;52(5):427-45. doi: 10.1016/s0301-0082(97)00023-3. Prog Neurobiol. 1997. PMID: 9304700 Review.
Cited by
-
Visual preference of plant features in different living environments using eye tracking and EEG.PLoS One. 2022 Dec 30;17(12):e0279596. doi: 10.1371/journal.pone.0279596. eCollection 2022. PLoS One. 2022. PMID: 36584138 Free PMC article.
-
The Development of Cognitive Control in Preschoolers and Kindergarteners: The Case of Post-Error Slowing and Delayed Disinhibition.J Intell. 2024 Apr 1;12(4):41. doi: 10.3390/jintelligence12040041. J Intell. 2024. PMID: 38667708 Free PMC article.
-
Deep Convolutional Neural Network-Based Visual Stimuli Classification Using Electroencephalography Signals of Healthy and Alzheimer's Disease Subjects.Life (Basel). 2022 Mar 4;12(3):374. doi: 10.3390/life12030374. Life (Basel). 2022. PMID: 35330125 Free PMC article.
-
Brain-computer Interaction in the Smart Era.Curr Med Sci. 2024 Dec;44(6):1123-1131. doi: 10.1007/s11596-024-2927-6. Epub 2024 Sep 30. Curr Med Sci. 2024. PMID: 39347924 Review.
References
-
- Haynes JD, Rees G. Decoding mental states from brain activity in humans. Nature Reviews Neuroscience. 2006;7(7):523–534. doi: 10.1038/nrn1931 - DOI - PubMed
-
- Naselaris T, Kay KN, Nishimoto S, Gallant JL. Encoding and decoding in fMRI. Neuroimage. 2011;56(2):400–10. doi: 10.1016/j.neuroimage.2010.07.073 - DOI - PMC - PubMed
-
- Norman KA, Polyn SM, Detre GJ, Haxby JV. Beyond mind-reading: multi-voxel pattern analysis of fMRI data. Trends in Cognitive Science. 2006;10(9):424–30. - PubMed
-
- Tong F, Pratte MS. Decoding patterns of human brain activity. Annual Review of Psychology. 2012;63:483–509. doi: 10.1146/annurev-psych-120710-100412 - DOI - PMC - PubMed
-
- Blank H, Biele G, Heekeren HR, Philiastides MG. Temporal characteristics of the influence of punishment on perceptual decision making in the human brain. Journal of Neuroscience. 2013;33(9):3939–52. doi: 10.1523/JNEUROSCI.4151-12.2013 - DOI - PMC - PubMed
MeSH terms
Grants and funding
LinkOut - more resources
Full Text Sources
Other Literature Sources
