. 2017 Apr 25;19(4):875-889.
doi: 10.1016/j.celrep.2017.03.078.

Systematic Epigenomic Analysis Reveals Chromatin States Associated with Melanoma Progression

Affiliations

Systematic Epigenomic Analysis Reveals Chromatin States Associated with Melanoma Progression

Petko Fiziev et al. Cell Rep. .

Abstract

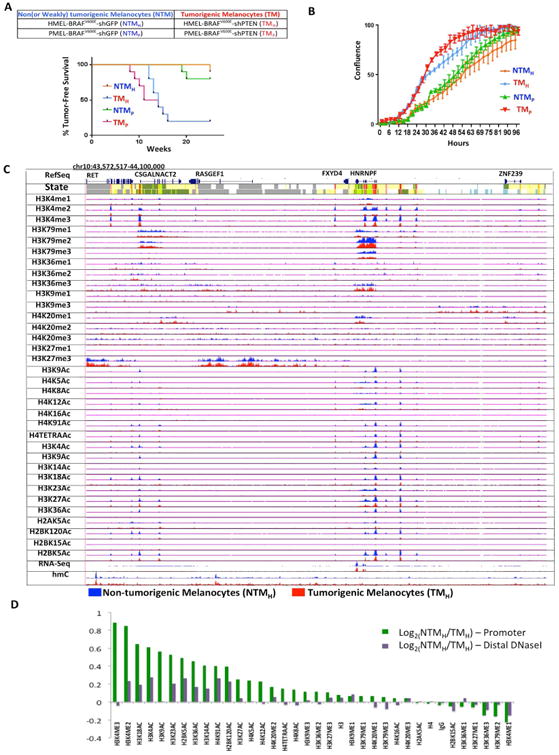
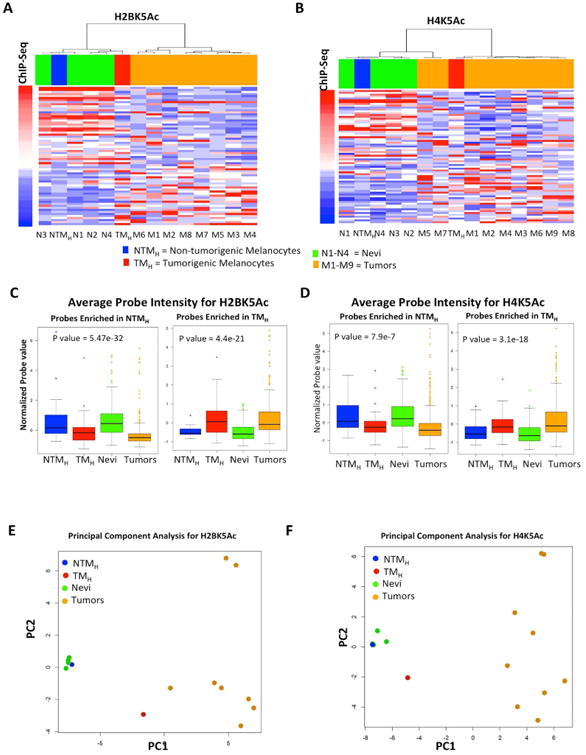
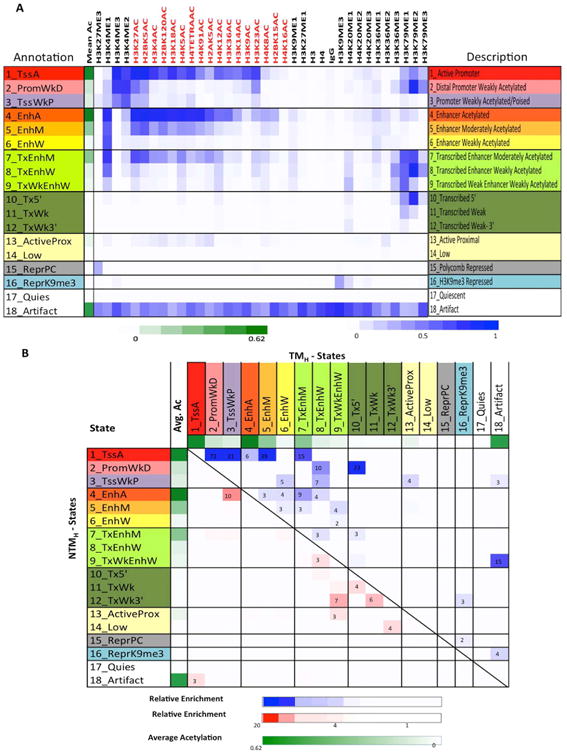
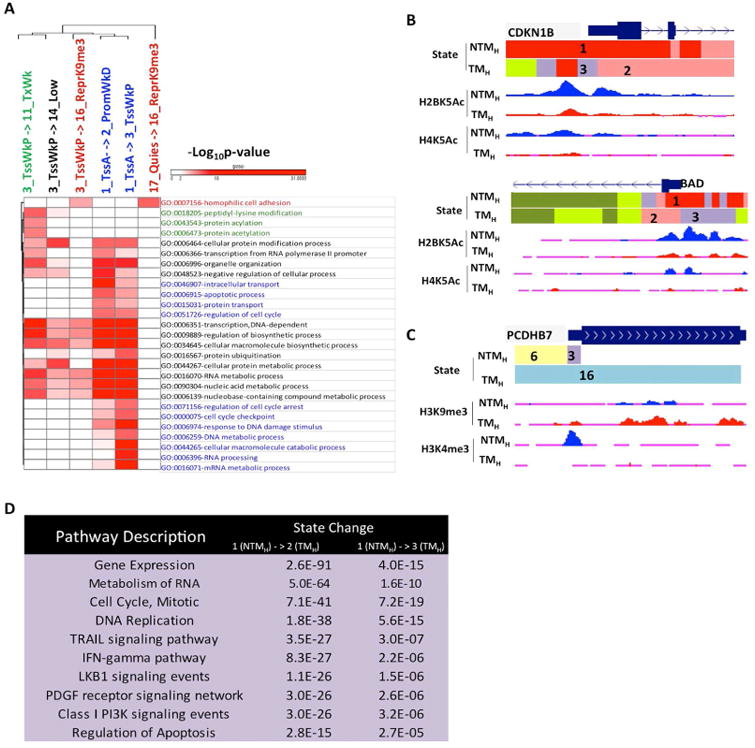
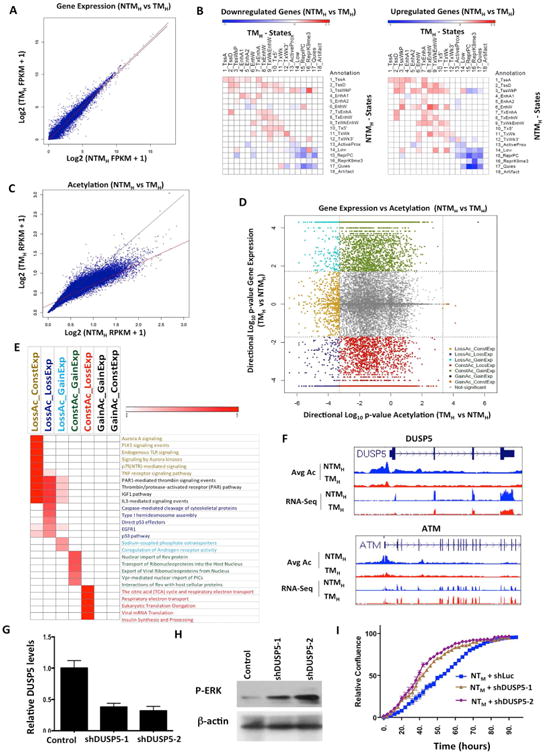
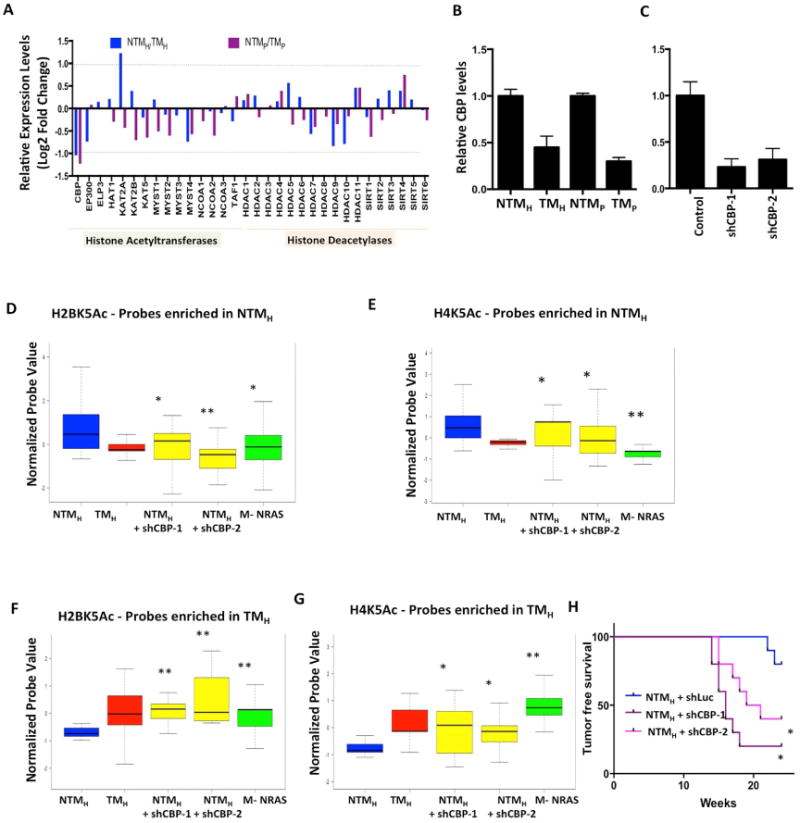
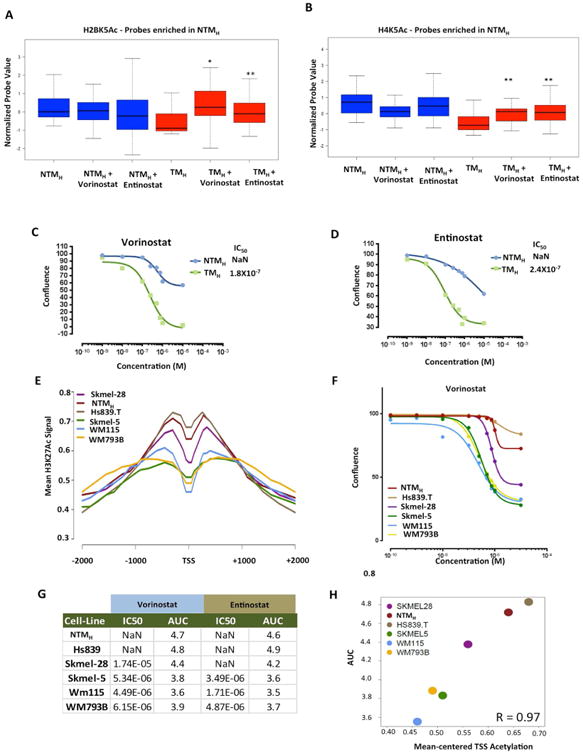
The extent and nature of epigenomic changes associated with melanoma progression is poorly understood. Through systematic epigenomic profiling of 35 epigenetic modifications and transcriptomic analysis, we define chromatin state changes associated with melanomagenesis by using a cell phenotypic model of non-tumorigenic and tumorigenic states. Computation of specific chromatin state transitions showed loss of histone acetylations and H3K4me2/3 on regulatory regions proximal to specific cancer-regulatory genes in important melanoma-driving cell signaling pathways. Importantly, such acetylation changes were also observed between benign nevi and malignant melanoma human tissues. Intriguingly, only a small fraction of chromatin state transitions correlated with expected changes in gene expression patterns. Restoration of acetylation levels on deacetylated loci by histone deacetylase (HDAC) inhibitors selectively blocked excessive proliferation in tumorigenic cells and human melanoma cells, suggesting functional roles of observed chromatin state transitions in driving hyperproliferative phenotype. Through these results, we define functionally relevant chromatin states associated with melanoma progression.

Keywords: CBP; ChIP-seq; DUSP5; HDAC; chromatin state; epigenome; histone modifications; melanoma.


Conflict of interest statement

Conflict of Interest Statement: Authors declare no conflict of interest.

Figures

Figure 1
Figure 1. Cell line based model of melanoma progression and epigenome profiling
(A) Brief description of the primary melanocyte based model system that consists of two replicates of paired isogenic non (or weakly)-tumorigenic (NTMH, NTMP) and tumorigenic (TMH and TMP) cells. Kaplan-Meier curve showing tumor formation efficiency of NTMH, NTMP, TMH and TMP cells. NTMH and NTMP cells display long latency whereas TMH and TMP cells show shorter latency for tumor formation. Mantle-Cox p = .0007 for NTMH vs TMH and p = 0.0016 for NTMP vs TMP (B) Proliferation curve showing differences in cell confluence (Y-axis) in NTMH vs TMH and NTMP vs TMP as a function of time (X-axis). (C) Normalized signal of all profiled chromatin marks, IgG control and RNA-Seq in an example region (chr10:43,572,517-44,100,000) for NTMH (blue) and TMH (red) cells. Chromatin state tracks and gene annotations are also shown. (D) Log2 ratio between NTMH and TMH cells for the average signal strength of each chromatin mark in a window of 2kb around annotated transcription start sites from RefSeq (Green) and on DNaseI hypersensitive sites from ‘Melano’ (Purple) cell lines from ENCODE. See also Figure S1 and Table S1.
Figure 2
Figure 2. Chromatin changes are reflected in human tumors. (A-B)
Heat map for H2BK5Ac (A) and H4K5Ac (B) showing enrichment in NTMH, TMH, 4 nevi samples (N1-N4) and in up to 9 melanoma tumor samples (M1-M9) as calculated by ChIP-String assay. Probes are ordered with increasing ChIP-Seq signal in TMH cells. Columns are ordered based on hierarchical clustering. (C-D) Boxplots showing average normalized intensity for ChIP-string probes across NTMH, TMH, nevi and tumors (Averaged over all enriched probes across all samples for Nevi and tumors). (E-F) PCA plot for H2BK5Ac (C) and H4K5Ac (D) showing relationship between NTMH, TMH, 4 nevi samples (N1-N4) and up to 9 melanoma tumor samples (M1-M9) as calculated by ChIP-String assay. Asterisk (*) represents p<0.05 and double asterisk (**) represents p<0.001. See also Figure S2 and Tables S2-S3.
Figure 3
Figure 3. Chromatin state predictions for non-tumorigenic and tumorigenic melanocytes
(A) Emission probabilities of the 18-state ChromHMM model (see Figure S3A for transition probabilities). Each row represents one chromatin state. First column gives state number and mnemonic and last column gives the candidate state description. Second column indicates the intensity of mean acetylation from zero (white) to 0.62 (green), which is the maximum mean acetylation across all states. Remaining columns each correspond to one chromatin mark with the intensity of the color in each cell reflecting the frequency of occurrence of that mark in the corresponding chromatin state on the scale from 0 (white) to 1 (blue). (B) Heat map showing fold enrichment of transitions of chromatin states in non-tumorigenic (NTMH) to tumorigenic (TMH) cells controlling for the overall state size and similarity (Supplementary Methods). The color intensities above (below) the main diagonal range from white (relative enrichment <1) to blue (red) (relative enrichment > 20), thus indicating chromatin state transitions that lose acetylation marks from NTMH to TMH within the same category are more enriched compared to the reverse chromatin state transition (i.e. from TMH to NTMH) and the lack of those that gain acetylations. See also Figure S3, S4 and Table S4.
Figure 4
Figure 4. Chromatin state changes during transition to tumorigenic state mark specific cancer pathways
(A) Heat map showing -log10(p-value) for top GO terms enriched in specific promoter state transitions between non-tumorigenic (NTMH) to tumorigenic (TMH) cells. (B) UCSC genome browser view of chromatin states as well as selected histone acetylation profiles (H2BK5Ac and H4K5Ac) for loci encompassing cell cycle regulator CDKN1B and apoptotic genes BAD, which showed loss from NTMH to TMH cells. (C) UCSC genome browser view of chromatin states as well as selected histone mark H3K9me3 and H3K4me3 profiles for loci encompassing pro-adhesion PCDHB7 in NTMH and TMH. (D) Top 10 most significant pathways (pathway commons) associated with promoters displaying state transitions from State 1_TssA in non-tumorigenic cells (NTMH) to States 2_PromWkD and 3_TssWkP in tumorigenic (TMH) cells. See also Figure S5 and Table S5, S6.
Figure 5
Figure 5. Correspondence of chromatin state changes with RNA expression changes during transition to tumorigenesis
(A) Scatter plot comparing gene expression values [log2 (FPKM+1)] in NTMH and TMH for RefSeq genes. (B) Relative enrichment of chromatin state transitions at promoters of down-regulated genes compared to up-regulated genes (left panel) or up-regulated genes promoters compared to down-regulated (right panel) for all pairs of chromatin state transitions. Red shows enrichment whereas blue is depletion. (C) Scatter plot comparing promoter acetylations [log2(RPKM+1)] around +/-2kb of each RefSeq gene in NTMH and TMH. The line in red is a regression line, while in black is the y=x line. (D) Scatter plot displays directional log10(p-value) for acetylation and gene expression changes between TMH and NTMH. Negative values represent genes with decreased expression or acetylation levels in TMH compared to NTMH cells. Dashed lines show the significance cut-off for acetylation or expression changes. Genes with significant gene expression and/or acetylation changes are colored based on grouping indicated. (E) Heat map represents enriched pathways (pathway commons) for each group identified in Figure 5D. Color scale represents –log10(HyperFdrQ corrected). (F) UCSC genome browser view of average acetylation and RNA-Seq for an example from each of the LossAc_LossExp (DUSP5) (top) and LossAc_ConstExp (ATM) groups (bottom). (G) Graph showing relative levels of DUSP5 in NTMH cells harboring either control or DUSP5 shRNAs. (H) Western blot showing levels of p-ERK in NTMH cells harboring either control or DUSP5 shRNAs. (I) Growth curve showing proliferative capacity of NTMH cells harboring control or DUSP5 shRNAs (shDUSP5-1 and shDUSP5-2). See also Figure S6 and Table S7.
Figure 6
Figure 6. CBP loss in NTMH cells promotes tumorigenesis and mimics acetylation loss seen in TMH cells
(A) Bar graph showing relative levels of 32 histone acetyltransferases and deacetylases between NTMH/TMH and NTMP/TMP cells. The Y–axis shows Log2 Fold Change values. The dotted line shows the cutoff of 2-fold change. (B-C) Graph showing relative levels of CBP histone acetyltransferase in (E) NTMH, TMH, NTMP and TMP cells and (F) NTMH cells harboring either control or CBP shRNAs. (D-G) Boxplots showing average normalized intensity for ChIP-string probes for (D, F) H2BK5Ac and (E, G) H4K5Ac in NTMH, TMH, NTMH cells harboring CBP shRNAs or NRASG12D expressing transformed melanocytes (M-NRAS). The plot is limited to those probes that were originally enriched in (D-E) NTMH cells or in (F-G) in TMH cells by ChIP-Seq experiments and validated by ChIP-String in Figure S2A-F. Asterisk (*) represents p<0.05 and double asterisk (**) represents p<0.001 (Wilcoxon Rank test) when comparisons are made to NTMH. (H) Kaplan-Meier curve showing tumor formation efficiency of NTMH cells harboring control or CBP shRNAs (shCBP-1 and shCBP-2).
Figure 7
Figure 7. Acetylation status on deacetylated promoters in TH correlates with response to HDAC inhibitors. (A-B)
Boxplots showing average normalized intensity for (A) H2BK5Ac or (B) H4K5Ac on ChIP-string probes (that were enriched in NTMH cells by ChIP-Seq experiment) across NTMH and TMH cells that were either untreated or treated with vorinostat (200nM) or entinostat (300nM) for 72hrs. Asterisk (*) represents p<0.05 and double asterisk (**) represents p<0.001 (Wilcoxon Rank test) when comparisons are made to TMH. (C-D) Growth curves for NTMH and TMH cells grown under various concentrations of (C) vorinostat or (D) entinostat. (E) Aggregate plot showing H3K27Ac levels around +/-2Kb of deacetylated gene promoters (in TH cells) in various melanoma cell lines. (F) Growth curves for melanoma cell lines grown under various concentrations of vorinostat. (G) Table showing IC50 values (the concentration at which 50% response is achieved) and area under the curve (AUC) for two HDAC inhibitors, vorinostat and entinostat, in melanoma cells lines. Immmeasurable IC50 values are shown as NaN which refers to ‘not a number’. (H) Correlation plot between AUC and average H3K27Ac levels at TSS of gene promoters that showed loss of histone acetylation in TMH cells compared to NTMH cells. See also Figure S7.

References

    1. Akhtar-Zaidi B, Cowper-Sal-lari R, Corradin O, Saiakhova A, Bartels CF, Balasubramanian D, Myeroff L, Lutterbaugh J, Jarrar A, Kalady MF, et al. Epigenomic enhancer profiling defines a signature of colon cancer. Science. 2012;336:736–739. - PMC - PubMed
    1. Bennett DC. Genetics of melanoma progression: the rise and fall of cell senescence. Pigment Cell Melanoma Res. 2016;29:122–140. - PubMed
    1. Busse A, Keilholz U. Role of TGF-beta in melanoma. Curr Pharm Biotechnol. 2011;12:2165–2175. - PubMed
    1. Campioni M, Santini D, Tonini G, Murace R, Dragonetti E, Spugnini EP, Baldi A. Role of Apaf-1, a key regulator of apoptosis, in melanoma progression and chemoresistance. Exp Dermatol. 2005;14:811–818. - PubMed
    1. Caunt CJ, Keyse SM. Dual-specificity MAP kinase phosphatases (MKPs): shaping the outcome of MAP kinase signalling. The FEBS journal. 2013;280:489–504. - PMC - PubMed

MeSH terms