. 2017 Apr 11;8(15):25395-25417.
doi: 10.18632/oncotarget.15915.

Context-dependent miR-204 and miR-211 affect the biological properties of amelanotic and melanotic melanoma cells

Affiliations

Context-dependent miR-204 and miR-211 affect the biological properties of amelanotic and melanotic melanoma cells

Marianna Vitiello et al. Oncotarget. .

Abstract

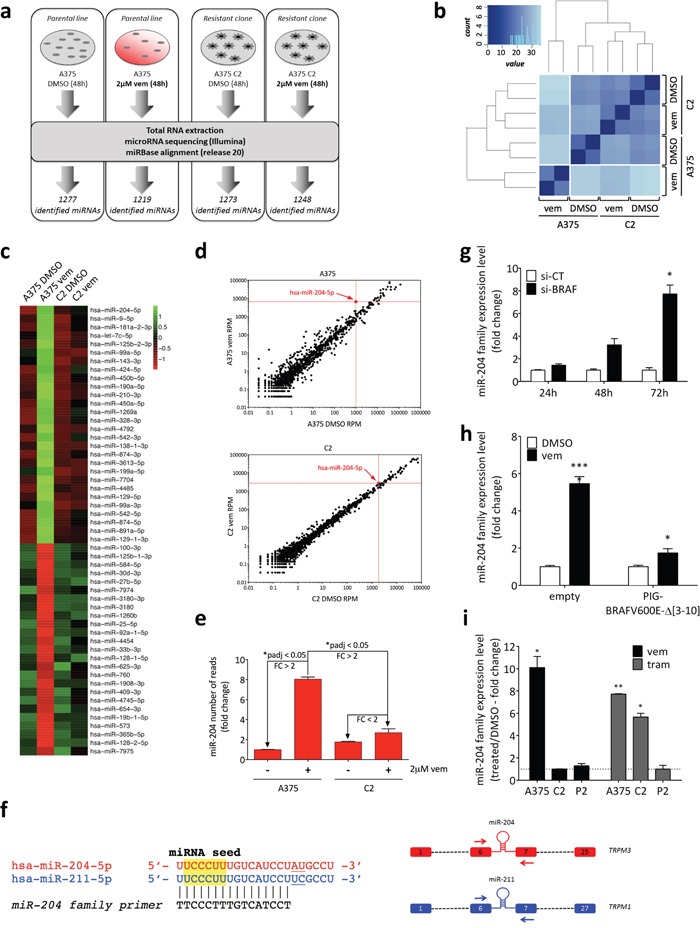
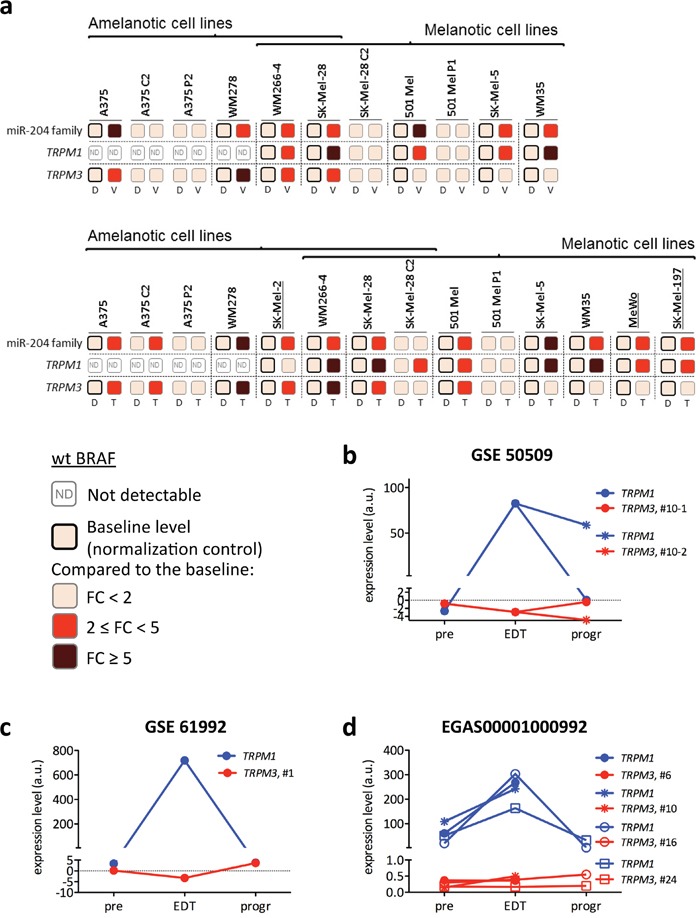
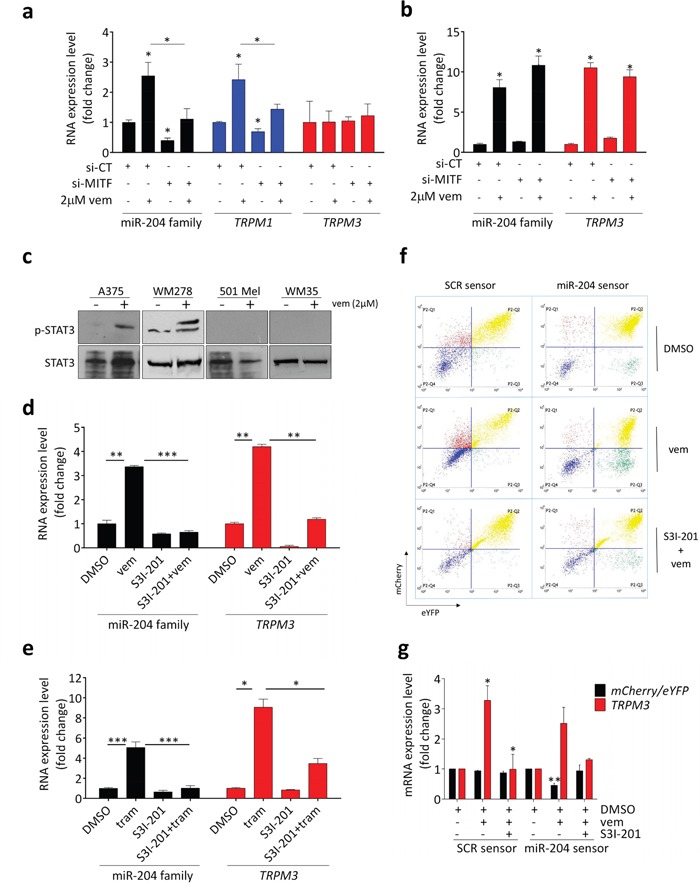
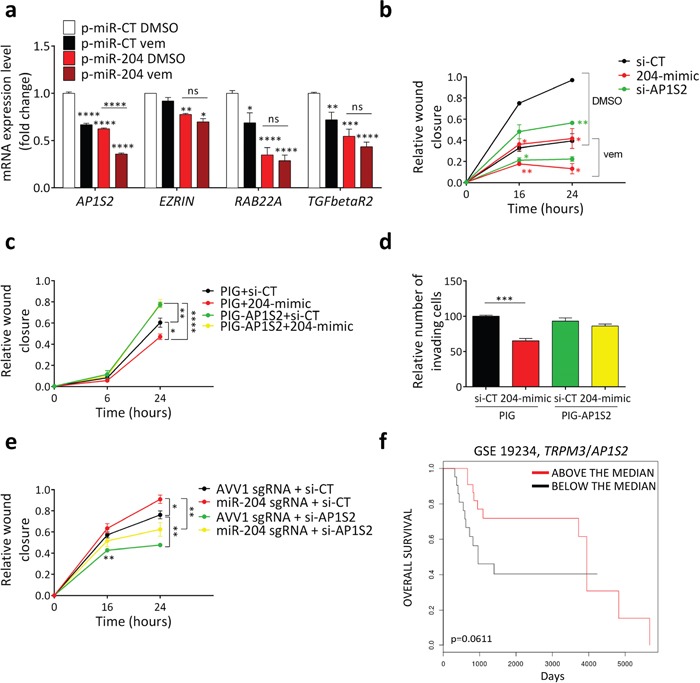
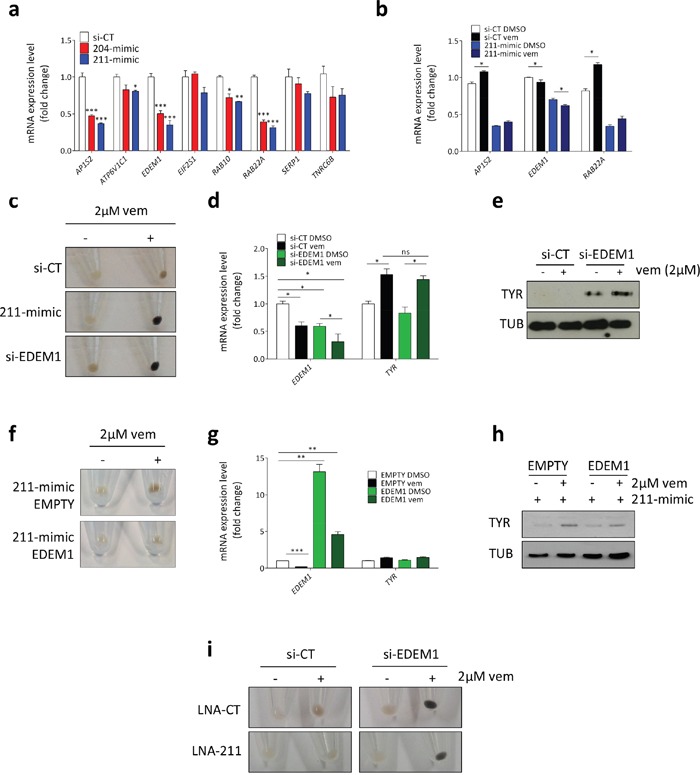
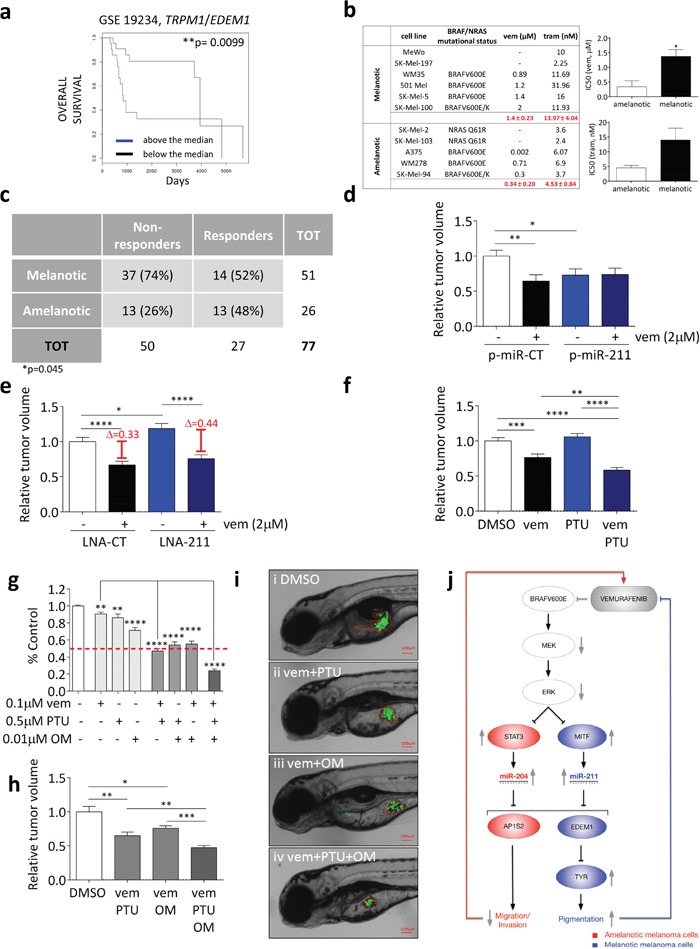
Despite increasing amounts of experimental evidence depicting the involvement of non-coding RNAs in cancer, the study of BRAFV600E-regulated genes has thus far focused mainly on protein-coding ones. Here, we identify and study the microRNAs that BRAFV600E regulates through the ERK pathway.By performing small RNA sequencing on A375 melanoma cells and a vemurafenib-resistant clone that was taken as negative control, we discover miR-204 and miR-211 as the miRNAs most induced by vemurafenib. We also demonstrate that, although belonging to the same family, these two miRNAs have distinctive features. miR-204 is under the control of STAT3 and its expression is induced in amelanotic melanoma cells, where it acts as an effector of vemurafenib's anti-motility activity by targeting AP1S2. Conversely, miR-211, a known transcriptional target of MITF, is induced in melanotic melanoma cells, where it targets EDEM1 and consequently impairs the degradation of TYROSINASE (TYR) through the ER-associated degradation (ERAD) pathway. In doing so, miR-211 serves as an effector of vemurafenib's pro-pigmentation activity. We also show that such an increase in pigmentation in turn represents an adaptive response that needs to be overcome using appropriate inhibitors in order to increase the efficacy of vemurafenib.In summary, we unveil the distinct and context-dependent activities exerted by miR-204 family members in melanoma cells. Our work challenges the widely accepted "same miRNA family = same function" rule and provides a rationale for a novel treatment strategy for melanotic melanomas that is based on the combination of ERK pathway inhibitors with pigmentation inhibitors.

Keywords: BRAFV600E; ERK pathway; context-dependency; melanoma; miR-204 family.


Conflict of interest statement

CONFLICTS OF INTEREST

The authors declare no conflicts of interest.

Figures

Figure 1
Figure 1. Mechanisms of acquired resistance displayed by vemurafenib-resistant clones and populations obtained from A375, 501 Mel and SK-Mel-28 cells
(a) Table that lists vemurafenib-resistant clones (C) and populations (P) and the corresponding resistance mechanism. The full list of known alterations that were searched for is reported in Supplementary Table 2. The resistance mechanism of SK-Mel-28 P1 population remains to be discovered. (b) Western blot for BRAFV600E protein in A375 parental cell line and vemurafenib-resistant clones (C) and populations (P). SK-Mel-197 cells, which are wt for BRAF, are included as a negative control. Immunoblotting for α-TUBULIN (TUB) is used as loading control. (c) Cartoon depicting the BRAFV600E splicing variants identified in A375 vemurafenib-resistant clones and populations. RBD: RAS-binding domain. (d) Electropherograms showing a single-nucleotide mutation (A→C) in the KRAS gene of A375 P2 resistant population (right) compared to A375 parental cell line (left), resulting in the K117N amino acid substitution. (e) Western blot for BRAFV600E protein in 501 Mel parental cell line and vemurafenib-resistant population (P1). SK-Mel-197 cells, which are wt for BRAF, are included as negative control. Immunoblotting for α-TUBULIN (TUB) is used as loading control. (f) Cartoon depicting the BRAFV600E splicing variant identified in 501 Mel P1. (g) In SK-Mel-28 C1 and C2 vemurafenib-resistant clones, EGFR and PDGFRβ are over-expressed, as detected by real-time PCR. The graphs represent the mean±SEM of 3 independent experiments. *p<0.05, **p<0.01.
Figure 2
Figure 2. Identification of miR-204 as a microRNA regulated by BRAFV600E through the ERK pathway
(a) Experimental design of miRNA-seq. A375 parental cell line and A375 C2 vemurafenib-resistant clone were treated with vehicle (DMSO) or 2uM vemurafenib for 48h. RNA was extracted and used to perform the miRNA-seq. (b) Sample clustering based on the distance matrix of miRNA profiles. Euclidean metric was used to measure the distance between samples. Darker blue represents higher similarity. (c) Heatmap of differentially expressed miRNAs. Variance-stabilized transformed count data is scaled and centered. (d) Dotplot of the miRNAs differentially expressed in A375 vemurafenib vs A375 DMSO (upper) and in C2 vemurafenib vs C2 DMSO (lower). (e) miR-204 reads obtained from miRNA-seq, relative to control (A375 treated with DMSO). In both (d) and (e), the graphs show that miR-204 levels are induced in A375 vemurafenib, but not in C2 vemurafenib. (f) (left) Sequence of miR-204 family members, miR-204 and miR-211. The sequence of the “miR-204 family” real-time PCR primer is also reported. (right) Schematic representation of miR-204 and miR-211 host genes (TRPM3 and TRPM1, respectively). Red and blue rectangles: exons; dashed lines: other exons/introns; arrows: host gene-specific real-time PCR primers. (g) Time course of miR-204 expression levels after the gene-expression inhibition of BRAF by siRNA. (h) miR-204 levels after 48h of treatment with 2uM vemurafenib in cells stably expressing the BRAFV600E Δ [–10] splicing variant compared to the empty vector. (i) miR-204 expression levels in A375 parental cell line and C2 and P2 vemurafenib-resistant derivatives after treatment with 2uM vemurafenib or 1nM trametinib for 48h. Vemurafenib and trametinib treatments are normalized on the control samples (DMSO, dotted line). The graphs represent the mean±SEM of 3 independent experiments. *p<0.05, **p<0.01, ***p<0.001.
Figure 3
Figure 3. Induction of TRPM3/miR-204 and TRPM1/miR-211 upon treatment of melanoma cell lines and metastatic melanoma patients with BRAFi and/or MEKi
(a) Fold induction of miR-204 family, TRPM1 and TRPM3 upon 48h of 2uM vemurafenib (V, upper) or 1nM trametinib treatment (T, lower) of the indicated BRAFV600E and wt BRAF (underlined) melanoma cell lines. Vemurafenib-resistant clones and populations are used as negative controls (when the drugs cannot function, there is no miRNA induction). D: DMSO. The expression levels of miR-204 family, TRPM1 and TRPM3 in each parental line treated with DMSO is taken as baseline and used as normalization control. Fold changes are therefore represented as increases over the baseline (a darker color means a higher fold change). (b-d) Expression levels of TRPM1 (blue) and TRPM3 (red) in bioptic samples collected from metastatic melanoma patients at 3 time points: before the beginning of the treatment (pre), early on during treatment (EDT) and at progression (progr). (b) In the GSE 50509 dataset, patient #10 was treated with the BRAFi dabrafenib and 2 different tumor sites were analyzed at progression. (c) In the GSE 61992 dataset, patient #1 was treated with the BRAFi dabrafenib and the MEKi trametinib. (d) In the EGAS00001000992 dataset, patients #6, #10 and #16 were treated with the BRAFi dabrafenib and the MEKi trametinib, while patient #24 was treated with the BRAFi vemurafenib.
Figure 4
Figure 4. Upon treatment with vemurafenib or trametinib, TRPM1/miR-211 induction is MITF-dependent, while TRPM3/miR-204 induction is STAT3-dependent
(a) si-MITF prevents TRPM1/miR-211 induction upon vemurafenib treatment in 501 Mel cells. The cells were transfected with si-CT or si-MITF and 24h later they were exposed to vehicle (DMSO) or 2uM vemurafenib for additional 48h. (b) si-MITF does not prevent TRPM3/miR-204 induction upon vemurafenib treatment in A375 cells. The cells were transfected with si-CT or si-MITF and 24h later they were exposed to vehicle (DMSO) or 2uM vemurafenib for additional 48h. (c) Upon 48h of treatment with 2uM vemurafenib, STAT3 phosphorylation is induced in A375 and WM278 cells (left), but not in 501 Mel and WM35 cells (right). (d-e) The induction of TRPM3/miR-204 caused by 48h treatment with 2uM vemurafenib (d) or 1nM trametinib (e) is impaired by the concomitant treatment with 4uM of the STAT3 inhibitor S3I-201. (f-g) A375 cells that stably express the inducible pTRE-TIGHT-BI-RY miR-204 sensor were treated with 2uM vemurafenib ± 4uM S3I-201 for 48h and then with 2 ug/ml doxycycline for additional 48h. Upon vemurafenib treatment, the increase in endogenous TRPM3/miR-204 levels causes a decrease in mCherry fluorescence (f), as well as in the mCherry/eYFP ratio (g). Upon the combined vemurafenib plus S3I-201 treatment, TRPM3/miR-204 induction is blunted and mCherry protein and mRNA return to basal levels. The graphs represent the mean±SEM of 3 independent experiments. *p<0.05, **p<0.01, ***<0.001.
Figure 5
Figure 5. miR-204 mediates the anti-motility activity of vemurafenib in amelanotic melanoma cells
(a-b) Wound closure of A375 cells that stably over-express a control miRNA (p-miR-CT, black), miR-204 (p-miR-204, red) or miR-211 (p-miR-211, blue). (c-d) Wound closure of A375 cells that stably over-express a control miRNA (p-miR-CT, black), miR-204 (p-miR-204, red) or miR-211 (p-miR-211, blue) and were treated for the indicated time points with vehicle (DMSO) or 2uM vemurafenib. Before being subjected to the assay, the cells were pretreated with vemurafenib for additional 24h. (e) Wound closure of A375 C2 vemurafenib-resistant cells that were transiently transfected with si-CT (black and grey) or 204-mimic (red and dark red), treated with vehicle (DMSO) or 2uM vemurafenib for 24h and then subjected to the wound healing assay for the indicated time points. (f) Wound closure of A375 cells that stably express a control AVV1 sgRNA (black) or a miR-204 sgRNA (red) and that were treated for the indicated time points with vehicle (DMSO) or 2uM vemurafenib. The cells were pretreated for 72h with doxycycline in order to induce the expression of Cas9 and hence the disruption of miR-204 gene, with the consequent dowregulation of the endogenous mature miRNA levels. (g-h) Matrigel invasion assay performed on A375 cells that stably over-express a control miRNA (p-miR-CT, white and black) or miR-204 (p-miR-204, red and dark red) and that were treated with 2uM vemurafenib for 6h. The graphs represent the mean±SEM of 3 independent experiments. *p<0.05, **p<0.01, ****<0.0001.
Figure 6
Figure 6. miR-204 inhibits motility by targeting AP1S2
(a) AP1S2, EZRIN, RAB22A and TGFbetaR2 levels in A375 cells that stably over-express a control miRNA (p-miR-CT) or miR-204 (p-miR-204) and were exposed to vehicle (DMSO) or 2uM vemurafenib for 24h. (b) Wound closure of A375 cells transfected with si-CT (black), 204-mimic (red) or si-AP1S2 (green) and then treated for the indicated time points with vehicle (DMSO) or 2uM vemurafenib, after 24h of pretreatment with the same drug. (c) Wound closure of A375 cells that were stably infected with PIG empty vector (PIG) or PIG-AP1S2 and transfected with si-CT or 204-mimic. (d) Matrigel invasion assay performed on A375 cells that were stably infected with PIG empty vector (PIG) or PIG-AP1S2, then transfected with si-CT or 204-mimic and finally allowed to invade for 6h. (e) Wound closure of A375 cells that stably express a control AVV1 sgRNA or a miR-204 sgRNA and transfected with si-CT or si-AP1S2. The cells were pretreated for 72h with doxycycline in order to induce the expression of Cas9 and hence the disruption of miR-204 gene, with the consequent down-regulation of the endogenous mature miRNA levels. (f) Above the median (red) and below the median (black) TRPM3/AP1S2 ratios allow to stratify metastatic melanoma patients according their overall survival (GSE 19234). The graphs represent the mean±SEM of 3 independent experiments. *p<0.05, **p<0.01, ***p<0.001, ****p<0.0001.
Figure 7
Figure 7. miR-211 mediates the pro-pigmentation activity of vemurafenib in melanotic melanoma cells
(a) Melanin content of 501 Mel cells 96h after the transient transfection of si-CT, 211-mimic or 204-mimic and 72h after the treatment with vehicle (DMSO) or 2uM vemurafenib. (b-d) Pictures of 501 Mel cells taken by transmission electron microscopy. (b) i) A representative cell transfected with si-CT and treated with DMSO for 72h. ii) A representative cell transfected with si-CT and treated with 2uM vemurafenib for 72h, showing mature melanosomes. iii) A representative cell transfected with 211-mimic and treated with DMSO for 72h, showing mature melanosomes. iv) A representative cell transfected with 211-mimic and treated with 2uM vemurafenib for 72h, showing abundant mature melanosomes. Unpigmented, immature melanosomes are indicated by asterisks (stage I) and white arrows (stage II). Mature melanosomes are indicated by arrowheads (stage III) and black arrows (stage IV). n: nucleus; pm: plasma membrane; m: mitochondrion; GA: Golgi Apparatus. In all 4 panels, scale bar represents 800 nm. (c-d) Quantification of the total number of melanosomes (c) and of the number of stage IV melanosomes (d) upon 72h treatment with 2uM vemurafenib of 501 Mel cells transfected with si-CT or 211-mimic. (e) Melanin content in 501 Mel cells 96h after the transient transfection of LNA-CT or LNA-211 and 72h after the treatment with vehicle (DMSO) or 2uM vemurafenib. (f-g) TYR RNA (f) and protein levels (g) in 501 Mel cells 96h after the transient transfection of si-CT, 211-mimic or 204-mimic and 72h after the treatment with vehicle (DMSO) or 2uM vemurafenib. (h-i) TYR RNA (h) and protein levels (i) in 501 Mel cells 96h after the transient transfection of LNA-CT or LNA-211 and 72h after the treatment with vehicle (DMSO) or 2uM vemurafenib. (j) Schematic representation of the analysis performed on the mRNA array data. The 81 genes showing an overlap between those differentially expressed upon the transient transfection of 211-mimic vs si-CT and those differentially expressed upon the transient transfection of 204-mimic vs si-CT (left) were subjected to GO enrichment analysis (biological processes), which highlighted the indicated categories among the most enriched (p<0.001, middle). The RNAs belonging to these categories and down-regulated (red, top) or up-regulated (green, bottom) upon 204-mimic and 211-mimic transfection are listed in the heatmap (logFC, right). The graphs represent the mean±SEM of 3 independent experiments. *p<0.05, **p<0.01, ***<0.001, ****<0.0001.
Figure 8
Figure 8. miR-211 promotes pigmentation by targeting EDEM1
(a) Validation of the array results. Expression levels of the mRNAs selected through GO enrichment analysis and measured 24h after the transient transfection of si-CT (white), 204-mimic (red) or 211-mimic (blue). (b) Effects of the transfection with 211-mimic and the treatment with 2uM vemurafenib on the levels of the indicated mRNAs. Vemurafenib was added 24h after the transfection and cell pellets were collected after additional 48h. (c-e) Melanin content (c), EDEM1 and TYR mRNA levels (d) and TYR protein levels (e) in 501 Mel cells transfected with si-CT or si-EDEM1 and then treated with 2uM vemurafenib for 72h. (f-h) Melanin content (f), EDEM1 and TYR mRNA levels (g) and TYR protein levels (h) in 501 Mel cells stably infected with an empty lentiviral vector or a lentiviral vector expressing the miRNA-insensitive EDEM1 ORF, then transfected with si-CT or 211-mimic and finally treated with 0.5uM vemurafenib for 48h. (i) Melanin content in 501 Mel transiently transfected with si-CT and LNA-CT or LNA-211, or with si-EDEM1 and LNA-CT or LNA-211. 24h after the transfection the cells were treated with DMSO or 2uM vemurafenib for 72h. The graphs represent the mean±SEM of 3 independent experiments. *p<0.05, **p<0.01, ***<0.001.
Figure 9
Figure 9. Pigmentation impairs the activity of BRAFi and MEKi
(a) Above the median (blue) and below the median (black) TRPM1/EDEM1 ratios allow to stratify metastatic melanoma patients according to their overall survival (GSE 19234). (b) IC50 of melanotic and amelanotic melanoma cell lines treated with vemurafenib (BRAFV600 E or K) and trametinib (BRAFV600 E or K, wt BRAF). (c) Response of 51 metastatic melanoma patients with melanotic tumors and 26 metastatic melanoma patients with amelanotic tumors to treatment with BRAFi or combined BRAFi/MEKi. Patients showing disease progression upon treatment were classified as non-responders, while patients showing stable disease, partial response or complete response upon treatment were classified as responders. The Fisher Exact Probability Test indicate that patients with melanotic metastases are significantly more likely to be non-responders to targeted therapy compared to patients with amelanotic metastases (p=0.045) (d) 501 Mel cells that stably over-express a control miRNA (p-miR-CT, white and black) or miR-211 (p-miR-211, blue and dark blue) were treated with DMSO or 2uM vemurafenib for 48h. They were then injected into the yolk sac of 48hfp zebrafish embryos. The masses of the xenografted tumors were measured 48h later. (e) 501 Mel cells transiently transfected with LNA-CT (white and black), or LNA-211 (blue and dark blue) were treated with DMSO or 2uM vemurafenib for 48h. They were then injected into the yolk sac of 48hpf zebrafish embryos. The masses of the xenografted tumors were measured 48h later. (f) 501 Mel cells were treated with DMSO (white), 0.2uM vemurafenib (black), 0.1uM PTU (blue) or 0.2uM vemurafenib plus 0.1uM PTU (dark blue) for 48h. They were then injected into the yolk sac of 48hpf stage zebrafish embryos. The masses of the xenografted tumors were measured 48h later. (g) Cell number upon the treatment of 501 Mel cells with 0.1uM vemurafenib, 0.5uM PTU and 0.01uM oligomycin (OM) or their combinations for one week. (h-i) 501 Mel cells were treated with DMSO (white), 0.1uM vemurafenib plus 0.5uM PTU, 0.1uM vemurafenib plus 0.01uM oligomycine or 0.1uM vemurafenib plus 0.5uM PTU plus 0.01uM oligomycine (dark grey) for 48h. They were then injected into the yolk sac of 48hpf zebrafish embryos. (h) The masses of the xenografted tumors were measured 48h later. (i) Representative pictures of the tumor masses. (j) Cartoon that summarizes the main findings of this article. miR-204 and miR-211 are negatively regulated by BRAFV600E through the ERK pathway and are under the transcriptional control of STAT3 and MITF, respectively. By targeting AP1S2, miR-204 is the mediator of the anti-motility activity exerted by vemurafenib on amelanotic cells. Conversely, by targeting EDEM1 and hence preventing TYR degradation through the ERAD pathway, miR-211 is the mediator of the pro-pigmentation activity exerted by vemurafenib on melanotic cells. Such an activity in turn limits the efficacy of vemurafenib itself. The graphs represent the mean±SEM of 3 independent experiments. *p<0.05, **p<0.01, ***<0.001, ***<0.001.

References

    1. Lavoie H, Therrien M. Regulation of RAF protein kinases in ERK signalling. Nat Rev Mol Cell Biol. 2015;16:281–298. - PubMed
    1. Roesch A, Vultur A, Bogeski I, Wang H, Zimmermann KM, Speicher D, Korbel C, Laschke MW, Gimotty PA, Philipp SE, Krause E, Patzold S, Villanueva J, et al. Overcoming intrinsic multidrug resistance in melanoma by blocking the mitochondrial respiratory chain of slow-cycling JARID1B(high) cells. Cancer Cell. 2013;23:811–825. - PMC - PubMed
    1. Haq R, Shoag J, Andreu-Perez P, Yokoyama S, Edelman H, Rowe GC, Frederick DT, Hurley AD, Nellore A, Kung AL, Wargo JA, Song JS, Fisher DE, et al. Oncogenic BRAF regulates oxidative metabolism via PGC1alpha and MITF. Cancer Cell. 2013;23:302–315. - PMC - PubMed
    1. Zhang G, Frederick DT, Wu L, Wei Z, Krepler C, Srinivasan S, Chae YC, Xu X, Choi H, Dimwamwa E, Ope O, Shannan B, Basu D, Zhang D, Guha M, Xiao M, et al. Targeting mitochondrial biogenesis to overcome drug resistance to MAPK inhibitors. J Clin Invest. 2016;126:1834–1856. - PMC - PubMed
    1. Yuan P, Ito K, Perez-Lorenzo R, Del Guzzo C, Lee JH, Shen CH, Bosenberg MW, McMahon M, Cantley LC, Zheng B. Phenformin enhances the therapeutic benefit of BRAF(V600E) inhibition in melanoma. Proc Natl Acad Sci U S A. 2013;110:18226–18231. - PMC - PubMed

MeSH terms