. 2017 Apr 11;8(15):24063-24076.
doi: 10.18632/oncotarget.16030.

Interaction between the estrogen receptor and fibroblast growth factor receptor pathways in non-small cell lung cancer

Affiliations

Interaction between the estrogen receptor and fibroblast growth factor receptor pathways in non-small cell lung cancer

Jill M Siegfried et al. Oncotarget. .

Abstract

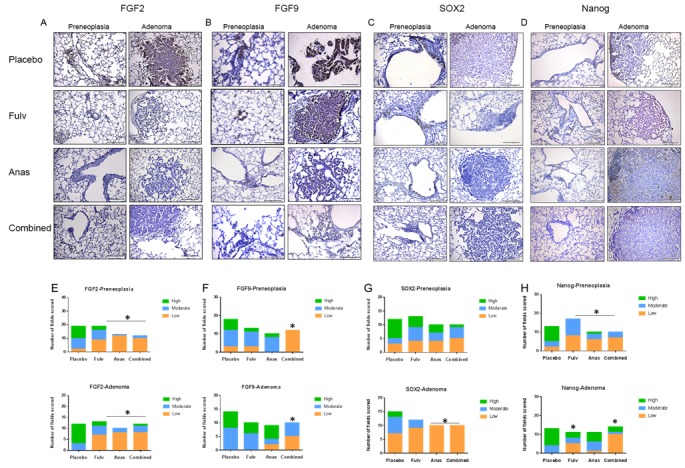
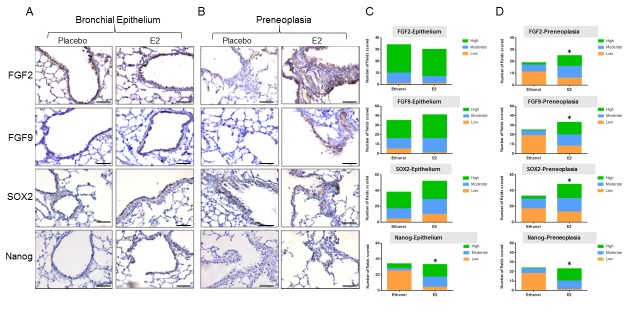
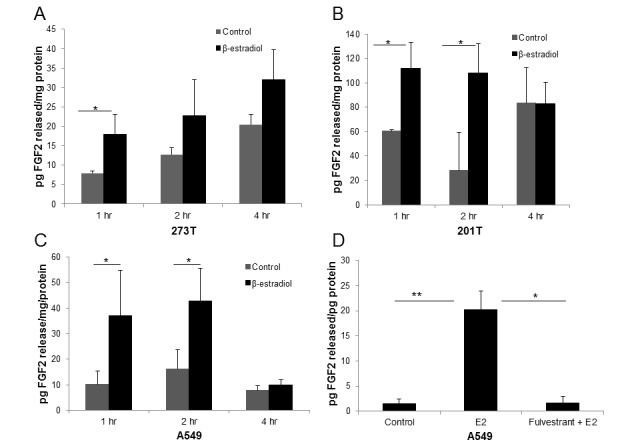
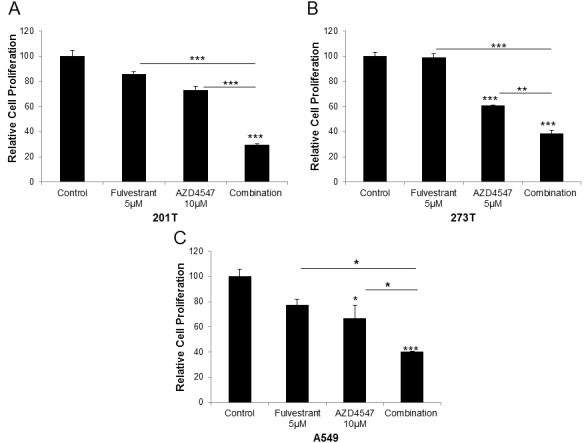
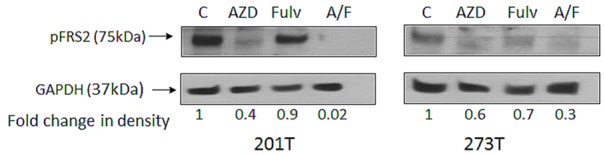
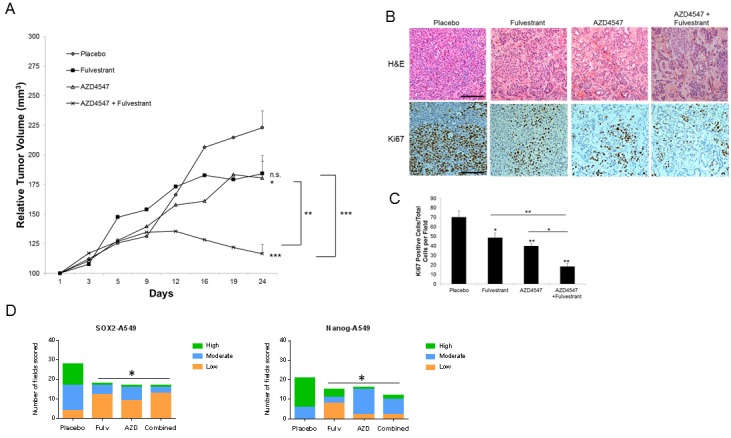
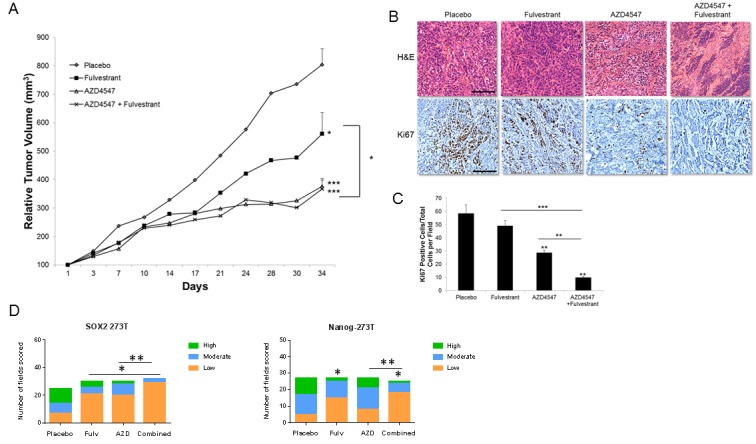
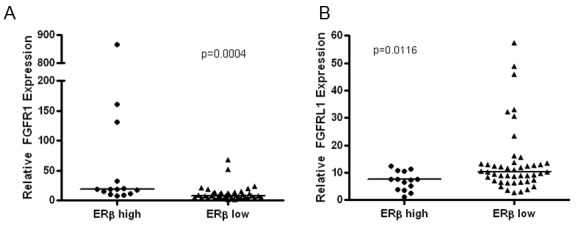
The estrogen receptor (ER) promotes non-small cell lung cancer (NSCLC) proliferation. Since fibroblast growth factors (FGFs) are known regulators of stem cell markers in ER positive breast cancer, we investigated whether a link between the ER, FGFs, and stem cell markers exists in NSCLC. In lung preneoplasias and adenomas of tobacco carcinogen exposed mice, the anti-estrogen fulvestrant and/or the aromatase inhibitor anastrozole blocked FGF2 and FGF9 secretion, and reduced expression of the stem cell markers SOX2 and nanog. Mice administered β-estradiol during carcinogen exposure showed increased FGF2, FGF9, SOX2, and Nanog expression in airway preneoplasias. In normal FGFR1 copy number NSCLC cell lines, multiple FGFR receptors were expressed and secreted several FGFs. β-estradiol caused enhanced FGF2 release, which was blocked by fulvestrant. Upon co-inhibition of ER and FGFRs using fulvestrant and the pan-FGFR inhibitor AZD4547, phosphorylation of FRS2, the FGFR docking protein, was maximally reduced, and enhanced anti-proliferative effects were observed. Combined AZD4547 and fulvestrant enhanced lung tumor xenograft growth inhibition and decreased Ki67 and stem cell marker expression. To verify a link between ERβ, the predominant ER in NSCLC, and FGFR signaling in patient tumors, mRNA analysis was performed comparing high versus low ERβ expressing tumors. The top differentially expressed genes in high ERβ tumors involved FGF signaling and human embryonic stem cell pluripotency. These results suggest interaction between the ER and FGFR pathways in NSCLC promotes a stem-like state. Combined FGFR and ER inhibition may increase the efficacy of FGFR inhibitors for NSCLC patients lacking FGFR genetic alterations.

Keywords: FGFR; NSCLC; estrogen.


Conflict of interest statement

CONFLICTS OF INTEREST

None declared.

Figures

Figure 1
Figure 1. FGF2, FGF9, SOX2, and Nanog expression is decreased in lungs of mice treated with fulvestrant and anastrozole
Representative IHC images are shown for FGF2 A., FGF9 B., SOX2 C., and Nanog D. from FFPE mouse lungs, which had previously been used for tumor assessment [16]. Preneoplasias and adenomas images were captured at 20X magnification and a representative image is shown for each protein (scale bar = 143μm). (E-H) Multiple images were captured from 4 FFPE blocks for each treatment group. The distribution of number of fields with each score (low, moderate, high) were plotted by treatment group for FGF2 E., FGF9 F., SOX2 G., and Nanog H.. A Chi-square test was performed to determine if statistical differences were present across the treatment groups (cutoff P < 0.05 or better), followed (if significant) by individual Fisher's exact tests to determine which treatments were significantly different. See Methods for details on scoring assessment. E. * P < 0.003; F. *P < 0.0002; G. *P < 0.02; H. *P < 0.05 or less (see text).
Figure 2
Figure 2. Exposure to E2 in the drinking water increases the expression of FGFs and stem cell markers in the lungs of male mice
A. Representative IHC staining of bronchial epithelium and B. preneoplasias for FGF2, FGF9, SOX2 and Nanog with and without E2 exposure in male mice (scale bar = 71.4μm). C. Distribution of scores for low, moderate and high staining, differences assessed by Chi Square test. See Methods for details on scoring assessment. C. * P < 0.0001; D. * P < 0.044 or less (see text).
Figure 3
Figure 3. E2 induces FGF2 release in NSCLC cell lines and fulvestrant inhibits E2-induced FGF2 secretion
In determining whether E2 treatment results in increased levels of FGF2 ligand release, cells were serum deprived for 48 hr prior to treatment with 10nM E2 or control for 1-4 hr. Media was collected and concentrated. Results were normalized to total protein content. A. 273T; B. 201T; C. A549. D. Serum-deprived A549 cells were pre-treated with 5μM fulvestrant for 24 hr followed by E2 treatment for 2 hr. Media and protein lysates were collected and analyzed for FGF2 secretion by ELISA. Results are expressed as the mean ± S.E. pg FGF2/mg protein released. *P < 0.05, **P < 0.01.
Figure 4
Figure 4. Fulvestrant enhances the anti-proliferative effects of FGFR inhibitor AZD4547 in NSCLC cell lines
Cells were treated with 5μM fulvestrant, 5 or 10μM AZD4547 or the combination for 72 hr. Cellular proliferation was measured using the Cell Titer 96 Aqueous One Solution Cell Proliferation Assay. Cell Titer reagent (20μl) was added to each well and plates were incubated for 1 hr. Results are the mean ± S.E. of at least 3 independent experiments each with 6 samples per experimental treatment. ANOVA, * = P < .05; ** = P < .01;*** = P < .001. A. 201T; B. 273T; C. A549.
Figure 5
Figure 5. Phosphorylation of FRS2 in presence of fulvestrant and AZD4547
201T and 273T cells were serum starved for 24 hr after plating, followed by addition of DMSO alone (control), AZD4547 (AZD; 2μM), fulvestrant (Fulv; 2μM), or the combination (A/F). Cells were harvested at 72 hr, whole cell lysates were immunoblotted for pFRS2. Expression of GAPDH was used as the loading control and densitometric measurements were corrected for amount of GAPDH.
Figure 6
Figure 6. Effect of fulvestrant and AZD4547 on in vivo A549 xenograft growth
A549 tumor bearing mice received the following treatments for 24 days: placebo, fulvestrant (30mg/kg; s.c.; twice weekly), AZD4547 (12.5 mg/kg p.o.; daily), or combination. A. Tumor growth was measured twice weekly and results represent the relative mean tumor volume ± S.E. of 6-8 tumors per treatment group. ANOVA * = P < .05; ** = P < .01;*** = P < .001. B. Representative H&E and Ki67 labeling of different treatment groups from xenografts harvested at 24 days (scale bar = 150μm). C. Quantitation of Ki67 labeling. Positive cells were counted in 5 high-powered fields per tumor and represent 3 tumors per experimental treatment group. ANOVA ** = P < .01;*** = P < .001. D. Distribution of SOX2 and Nanog IHC scores. SOX2 and Nanog were scored on a scale of low ( < 30% of cells in the field were positive), moderate (30-60% of cells were positive) and high ( > 60% of cells were positive). The distribution of number of fields with each score was plotted in each treatment group. A Chi-square test was performed to determine if statistical differences were present across the treatment groups (P < 0.05), followed by individual Fisher's exact tests to determine which treatments were significantly different. SOX2, * P < 0.02; Nanog, * P < 0.002.
Figure 7
Figure 7. Effect of fulvestrant and AZD4547 on in vivo 273T xenograft growth
273T tumor bearing mice received the same treatments as described in Figure 6A for 34 days. A. Tumor growth was measured twice weekly and results represent the relative mean tumor volume ± S.E. of 6-8 tumors per treatment group. ANOVA * = P < .05; *** = P < .001. B. Representative H&E and Ki67 labeling of different treatment groups from xenografts harvested at 34 days (scale bar = 150μm). C. Quantitation of Ki67 labeling. Positive cells were counted as described in Figure 6C. ANOVA ** = P < .01;*** = P < .001. D. Distribution of SOX2 and Nanog IHC scores. Quantitation and statistical analysis is as described in Figure 6D. SOX2, * P < 0.03; ** P < 0.05; Nanog, * P < 0.004, ** P < 0.014.
Figure 8
Figure 8. Quantitation of mRNA expression of FGFR1 and FGFRL1 (FGFR5) in NSCLC biospecimens that differ by ERβ status
TaqMan qRT-PCR validation of FGFR1 and FGFRL1 expression in the ERβ high/low cohort. Line represents median values in each set and P-values were determined using the Mann-Whitney test.

References

    1. Society AC. In: Society AC, ed.American Cancer Society. Atlanta: 2014. Cancer Facts & Figures 2014; pp. 15–7.1.
    1. Kris MG, Johnson BE, Berry LD, Kwiatkowski DJ, Iafrate AJ, Wistuba II, Varella-Garcia M, Franklin WA, Aronson SL, Su PF, Shyr Y, Camidge DR, Sequist LV, et al. Using multiplexed assays of oncogenic drivers in lung cancers to select targeted drugs. Jama. 2014;311:1998–2006. doi: 10.1001/jama.2014.3741. - DOI - PMC - PubMed
    1. Brooks AN, Kilgour E, Smith PD. Molecular pathways: fibroblast growth factor signaling: a new therapeutic opportunity in cancer. Clin Cancer Res. 2012;18:1855–62. doi: 10.1158/1078-0432.CCR-11-0699. - DOI - PubMed
    1. Marek L, Ware KE, Fritzsche A, Hercule P, Helton WR, Smith JE, McDermott LA, Coldren CD, Nemenoff RA, Merrick DT, Helfrich BA, Bunn PA, Jr, Heasley LE. Fibroblast growth factor (FGF) and FGF receptor-mediated autocrine signaling in non-small-cell lung cancer cells. Mol Pharmacol. 2009;75:196–207. doi: 10.1124/mol.108.049544. - DOI - PMC - PubMed
    1. Seo AN, Jin Y, Lee HJ, Sun PL, Kim H, Jheon S, Kim K, Lee CT, Chung JH. FGFR1 amplification is associated with poor prognosis and smoking in non-small-cell lung cancer. Virchows Arch. 2014;465:547–58. doi: 10.1007/s00428-014-1634-2. - DOI - PubMed

MeSH terms