. 2017 Apr 26;11(1):51.
doi: 10.1186/s12918-017-0427-z.

A scalable metabolite supplementation strategy against antibiotic resistant pathogen Chromobacterium violaceum induced by NAD+/NADH+ imbalance

Affiliations

A scalable metabolite supplementation strategy against antibiotic resistant pathogen Chromobacterium violaceum induced by NAD+/NADH+ imbalance

Deepanwita Banerjee et al. BMC Syst Biol. .

Abstract

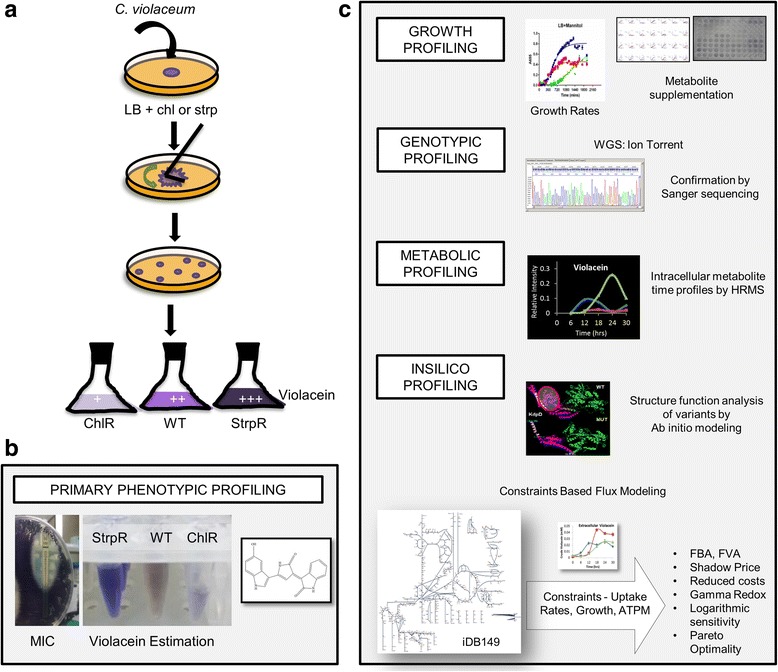
Background: The leading edge of the global problem of antibiotic resistance necessitates novel therapeutic strategies. This study develops a novel systems biology driven approach for killing antibiotic resistant pathogens using benign metabolites.

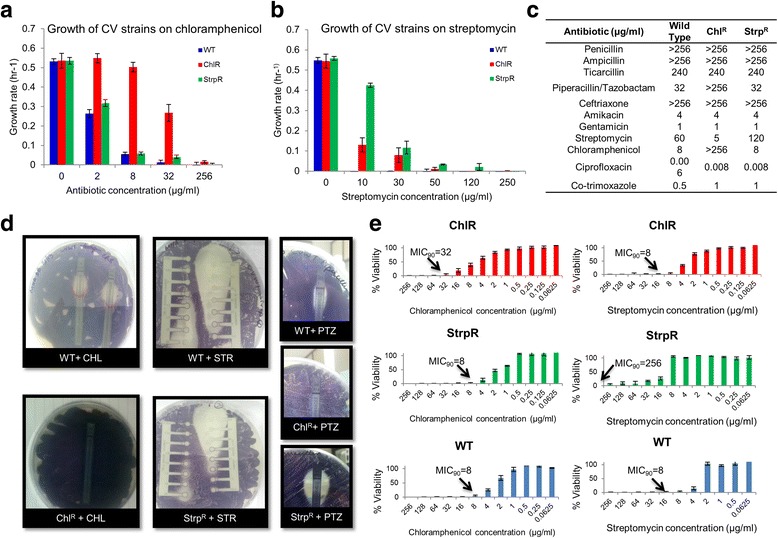
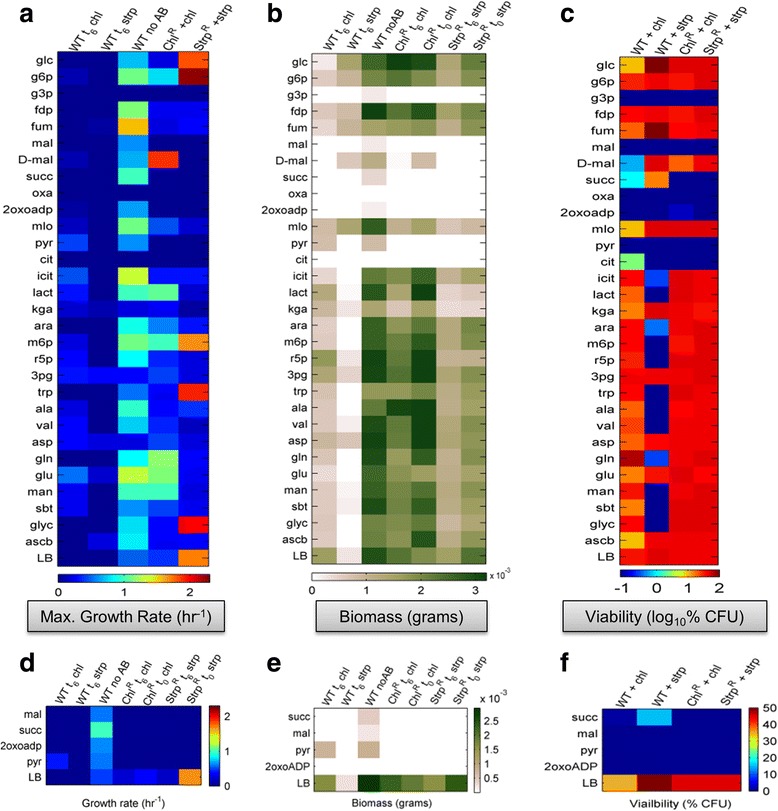
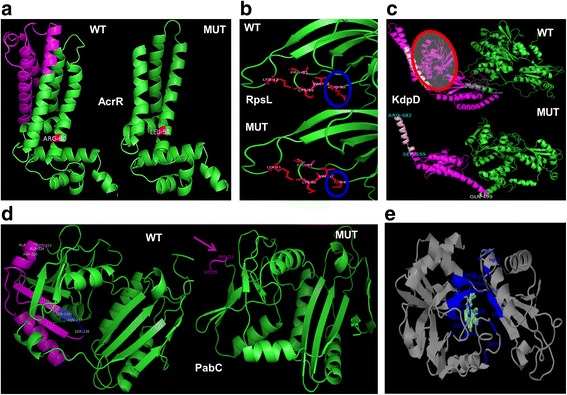
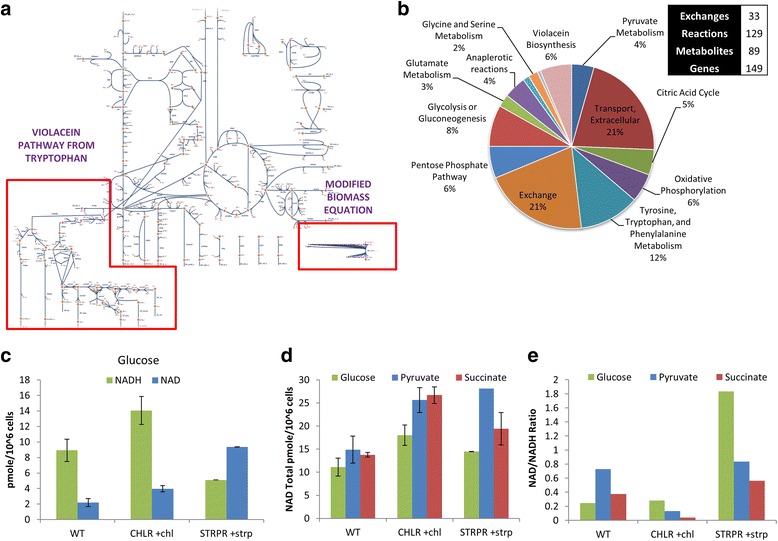
Results: Controlled laboratory evolutions established chloramphenicol and streptomycin resistant pathogens of Chromobacterium. These resistant pathogens showed higher growth rates and required higher lethal doses of antibiotic. Growth and viability testing identified malate, maleate, succinate, pyruvate and oxoadipate as resensitising agents for antibiotic therapy. Resistant genes were catalogued through whole genome sequencing. Intracellular metabolomic profiling identified violacein as a potential biomarker for resistance. The temporal variance of metabolites captured the linearized dynamics around the steady state and correlated to growth rate. A constraints-based flux balance model of the core metabolism was used to predict the metabolic basis of antibiotic susceptibility and resistance.

Conclusions: The model predicts electron imbalance and skewed NAD/NADH ratios as a result of antibiotics - chloramphenicol and streptomycin. The resistant pathogen rewired its metabolic networks to compensate for disruption of redox homeostasis. We foresee the utility of such scalable workflows in identifying metabolites for clinical isolates as inevitable solutions to mitigate antibiotic resistance.

Keywords: Antibiotic resistance; Flux balance analysis; Flux variability analysis; Metabolism; Metabolomic; NAD; NADH; Redox homeostasis.


Figures

Fig. 1
Fig. 1
Schematic/work flow of experimental design – From evolution to emergence. a Adaptive laboratory evolution (ALE) of antibiotic resistant populations of C. violaceum under sub-lethal concentrations of antibiotic. 5 μl of overnight culture of C. violaceum was evenly spread onto LB agar plates with respective antibiotic (10 μg/ml) and were incubated at 30 °C until colonies appeared on the agar plates. After clonal purification the resistant populations were cultured and showed characteristic violet color pigment, violacein. ChlR shows lower intensity of pigmentation while StrpR showed higher levels as compared to WT. b Primary phenotypic profiling performed to confirm the evolution of resistance against the two antibiotics using minimum inhibitory concentration (MIC) and violacein estimation (refer Methods for details). c Systems Biology approach used in this study with basic growth profiling, metabolite supplementation experiments, genotypic profiling using whole genome sequencing (WGS), HRMS metabolomics, and in silico structural analysis of variants and flux balance modeling using iDB149 network with constraints derived from in house data. This scalable pipeline allows understanding the genotype-phenotype relationship of the resistant pathogens
Fig. 2
Fig. 2
The evolved phenotypes of antibiotic resistance: Growth profiling and minimum inhibitory concentration typing across sensitive and resistant populations. a Growth rate on varying concentration of chloramphenicol showing a 17 and 7 fold change relative to wild type at 32 μg/mL for ChlR and StrpR respectively. b Growth rate on varying concentration of streptomycin showed no growth for WT and ChlR at 30 μg/mL and considerable growth rate for StrpR. c MIC using EzyMICTM Strips for 11 antibiotics. d Mueller Hinton agar plates showing primary resistance against chloramphenicol (Chl) and streptomycin (Str) and secondary resistance developed against piperacillin/tazobactam (PTZ). ChlR shows no zone of inhibition contrary to an elliptical zone of inhibition in case of WT and StrpR. e Broth dilution method shows high MIC values for the resistant populations against the respective antibiotics that they were evolved on. Legends are Blue for WT, Red for ChlR and Green for StrpR. Means ± S.D. represented in a, b and e (n ≥ 3)
Fig. 3
Fig. 3
Systematic evaluation of microenvironment metabolite supplemented antibiotic effects on biomass, growth and viability for the three populations. a The heat map represents the exponential growth rates (measured fitness) of the WT, ChlR and StrpR populations on multiple microenvironment metabolites. The predominantly blue-scale of the wild type in presence of antibiotics (first two columns) indicate the bactericidal and bacteriostatic effect of antibiotics. The last two columns show the evolution of resistance as indicated by the increased growth rates. The Inset (d) highlights the four metabolites maleate, succinate, pyruvate and 2oxoadipate on which growth rates are minimal even for the resistant populations. b The heat map represents the maximum amount of biomass after 30 h (as cell dry weight) that is produced by the WT, ChlR and StrpR populations on multiple microenvironment metabolites. The Inset (e) highlights the four metabolites maleate, succinate, pyruvate and 2oxoadipate on which biomass was minimal. The effect of initial colony forming units was assessed by adding at the start of the culture (t0) and 6 h after growth (t6). c The heat map represents viability (as log 10 values of colony forming units/ml) after 48 h in the absence of antibiotics on rich LB media plates. The inset (f) once again confirms the effect of the four metabolites maleate, succinate, pyruvate and oxoadipate on which viability is null
Fig. 4
Fig. 4
In silico protein structure and function alterations due to altered genotypes confirmed by sanger sequencing. a- d Ab-initio models for wild type (WT) and mutant (MUT) proteins for AcrR, KdpD and PabC using ROBETTA and homology model for RpsL. e 3DLigandSite representation of the ligand binding residues (blue) including Ser238 among others, lost in the mutated variant of pabC gene as shown in (d)
Fig. 5
Fig. 5
The metabolic basis of antibiotic resistance through dynamic metabolomic profiling shows metabolic reprogramming. a Violacein with its differential abundances as compared to wild type in the StrpR (50% increase) and ChlR populations (50% reduction). b Prodeoxyviolacein measured only in ChlR population. c Fold change with reference to wild type population across resistant populations in their average intracellular relative abundance (log 10 values). d Temporal variation of metabolite abundances across sensitive and resistant populations (log 10 values). e The oscillatory or linear behavior with varying amplitude, period and phase lag during growth on glucose across sensitive and resistant populations. The Central Carbon Metabolism Network is drawn for quick correlation. Solid blue squares show all amino acids, Fructose-1,6-biphosphate (1,6-FDP), D-ribose-5-phosphate (R5P), D-erythrose-4-phosphate (E4P), glycerate-3P (3PG), phosphoenolpyruvate (PEP), pyruvate (PYR). Yellow rounded rectangles show nucleotides. Various metabolite time profiles for the three strains are shown. All the values were normalized to the internal standard (Refer Methods for details). Graph legends: Blue – WT, Red – ChlR, Green – StrpR. Means ± S.D. represented in (a,b and e) (n ≥ 2)
Fig. 6
Fig. 6
Constraints-based Modeling predicts disruption of redox homeostasis and rewiring of metabolic network for compensation. a Core network representation of C. violaceum metabolism (iDB149) with tryptophan, violacein pathway (using Escher; https://escher.github.io/) and tailored biomass composition. b Reconstruction statistics and subsystem classification. c - e NADH and NAD experimental values attained for the three different strains using three different substrates – Glucose, Pyruvate and Succinate. Mean ± S.D. for triplicate samples represented

References

    1. Fani F, Leprohon P, Légaré D, Ouellette M. Whole genome sequencing of penicillin-resistant Streptococcus pneumoniae reveals mutations in penicillin-binding proteins and in a putative iron permease. Genome Biol. 2011;12:R115. doi: 10.1186/gb-2011-12-11-r115. - DOI - PMC - PubMed
    1. Lobritz MA, Belenky P, Porter CBM, Gutierrez A, Yang JH, Schwarz EG, Dwyer DJ, Khalil AS, Collins JJ. Antibiotic efficacy is linked to bacterial cellular respiration. Proc Natl Acad Sci. 2015;112:8173–80. doi: 10.1073/pnas.1509743112. - DOI - PMC - PubMed
    1. Stoesser N, Batty EM, Eyre DW, Morgan M, Wyllie DH, Del Ojo Elias C, Johnson JR, Walker AS, Peto TEA, Crook DW. Predicting antimicrobial susceptibilities for Escherichia coli and Klebsiella pneumoniae isolates using whole genomic sequence data. J Antimicrob Chemother. 2013;68:2234–44. - PMC - PubMed
    1. Toprak E, Veres A, Michel J-B, Chait R, Hartl DL, Kishony R. Evolutionary paths to antibiotic resistance under dynamically sustained drug selection. Nat Genet. 2012;44:101–5. doi: 10.1038/ng.1034. - DOI - PMC - PubMed
    1. Renzoni A, Andrey DO, Jousselin A, Barras C, Monod A, Vaudaux P, Lew D, Kelley WL. Whole genome sequencing and complete genetic analysis reveals novel pathways to glycopeptide resistance in Staphylococcus aureus. PLoS One. 2011;6:e21577. doi: 10.1371/journal.pone.0021577. - DOI - PMC - PubMed