

Re-directing bacterial microcompartment systems to enhance recombinant expression of lysis protein E from bacteriophage ϕX174 in Escherichia coli
- PMID: 28446197
- PMCID: PMC5405515
- DOI: 10.1186/s12934-017-0685-x
Re-directing bacterial microcompartment systems to enhance recombinant expression of lysis protein E from bacteriophage ϕX174 in Escherichia coli
Abstract
Background: Recombinant expression of toxic proteins remains a challenging problem. One potential method to shield toxicity and thus improve expression of these proteins is to encapsulate them within protein compartments to sequester them away from their targets. Many bacteria naturally produce so-called bacterial microcompartments (BMCs) in which enzymes comprising a biosynthetic pathway are encapsulated in a proteinaeous shell, which is in part thought to shield the cells from the toxicity of reaction intermediates. As a proof-of-concept, we attempted to encapsulate toxic, lysis protein E (E) from bacteriophage ϕX174 inside recombinant BMCs to enhance its expression and achieve higher yields during downstream purification.
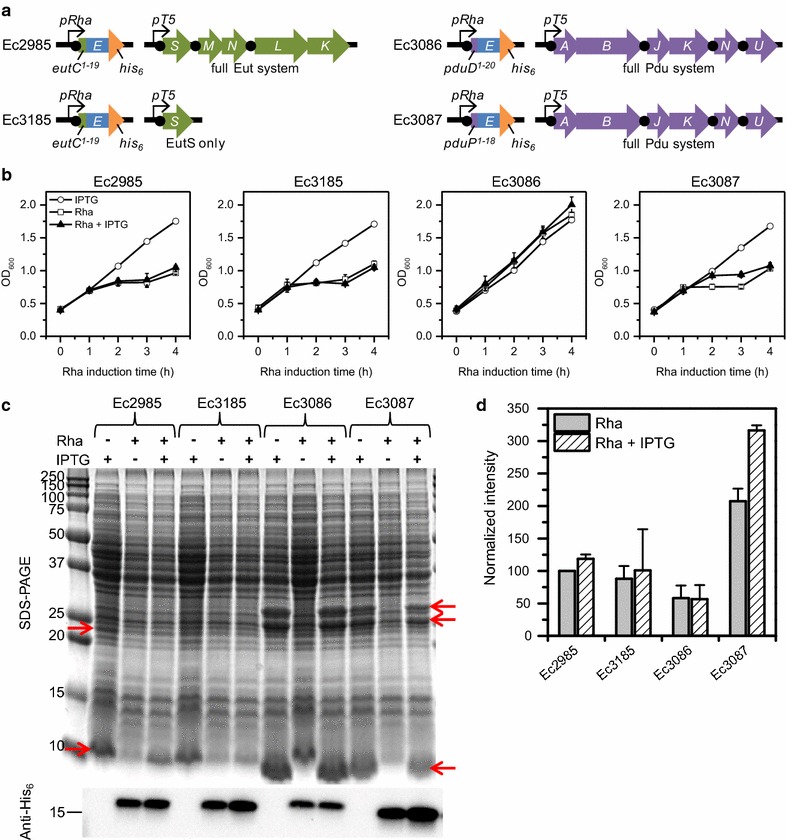
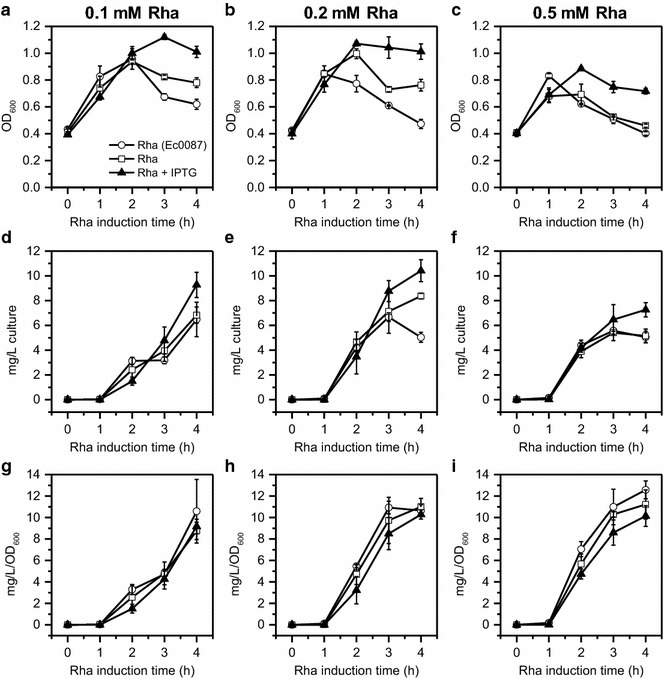
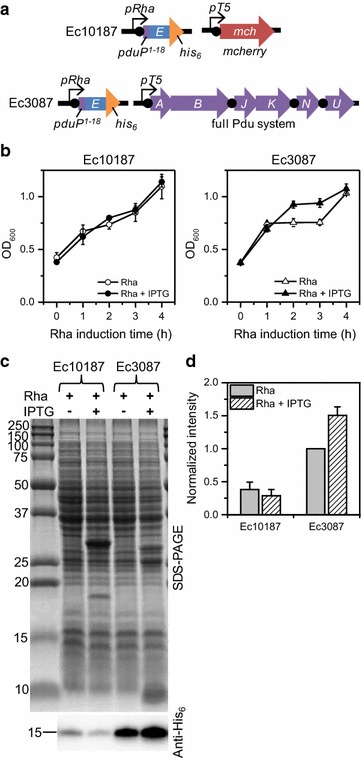
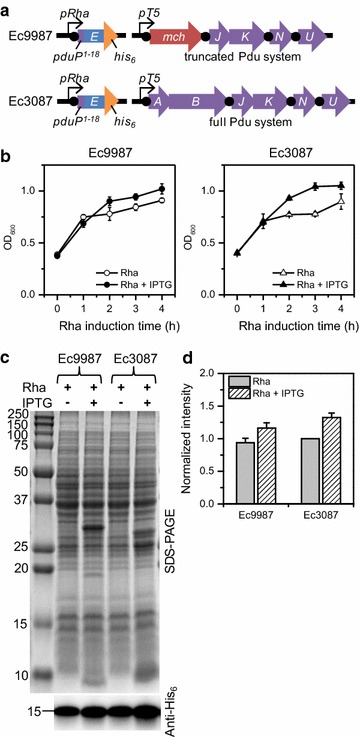
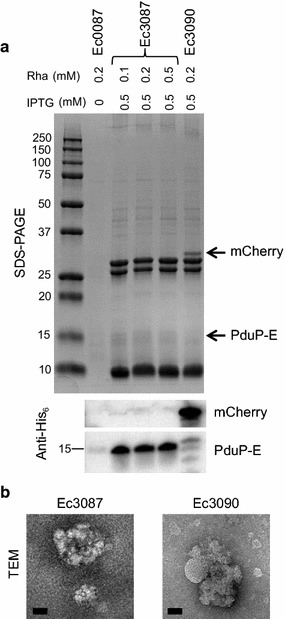
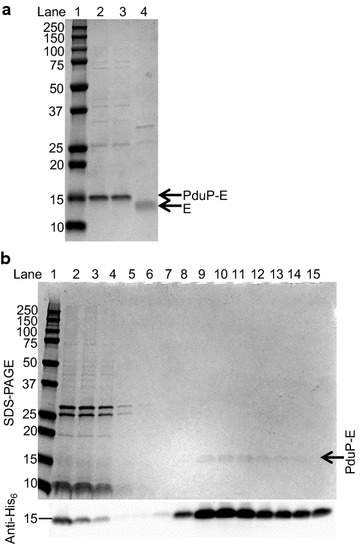
Results: E was fused with various N-terminal BMC targeting tags (PduP-, PduD-, and EutC-tags, 18-20 amino acids) and co-expressed with appropriate BMC shell proteins that associate with the tags and are required to form BMCs. Only BMC targeted E fusions, but not non-tagged E, could be successfully cloned, suggesting that the BMC tags reduce the toxicity of E. A PduP-tagged E system appeared to achieve the highest expression of E. Co-expression of Pdu BMC shell proteins with PduP-E increased its expression by 20-50%. Affinity purification of PduP-E via Ni-NTA in the presence of Empigen BB detergent yielded 270 µg of PduP-E per L of induced culture. Removal of the PduP-tag via proteolysis resulted in a final yield of 200 µg of E per L of induced culture, a nearly order of magnitude (~sevenfold) improvement compared to prior reports.
Conclusions: These results demonstrate improved expression of ϕX174 lysis protein E via re-directed BMC systems and ultimately higher E purification yields. Similar strategies can be used to enhance expression of other toxic proteins in recombinant Escherichia coli systems.
Keywords: BMC; Bacterial microcompartment; Bacteriophage phiX174; Lysis protein E; Toxic protein expression.
Figures
Similar articles
-
A novel method to recover inclusion body protein from recombinant E. coli fed-batch processes based on phage ΦX174-derived lysis protein E.Appl Microbiol Biotechnol. 2017 Jul;101(14):5603-5614. doi: 10.1007/s00253-017-8281-x. Epub 2017 Apr 20. Appl Microbiol Biotechnol. 2017. PMID: 28429059 Free PMC article.
-
Assembly of robust bacterial microcompartment shells using building blocks from an organelle of unknown function.J Mol Biol. 2014 May 29;426(11):2217-28. doi: 10.1016/j.jmb.2014.02.025. Epub 2014 Mar 11. J Mol Biol. 2014. PMID: 24631000
-
Employing bacterial microcompartment technology to engineer a shell-free enzyme-aggregate for enhanced 1,2-propanediol production in Escherichia coli.Metab Eng. 2016 Jul;36:48-56. doi: 10.1016/j.ymben.2016.02.007. Epub 2016 Mar 8. Metab Eng. 2016. PMID: 26969252 Free PMC article.
-
Bacteriophage lambda lysis gene product modified and inserted into Escherichia coli outer membrane: Rz1 lipoprotein.Microb Drug Resist. 1996 Spring;2(1):147-53. doi: 10.1089/mdr.1996.2.147. Microb Drug Resist. 1996. PMID: 9158738 Review.
-
Biotechnological Advances in Bacterial Microcompartment Technology.Trends Biotechnol. 2019 Mar;37(3):325-336. doi: 10.1016/j.tibtech.2018.08.006. Epub 2018 Sep 17. Trends Biotechnol. 2019. PMID: 30236905 Review.
Cited by
-
A Bacterial Microcompartment Is Used for Choline Fermentation by Escherichia coli 536.J Bacteriol. 2018 Apr 24;200(10):e00764-17. doi: 10.1128/JB.00764-17. Print 2018 May 15. J Bacteriol. 2018. PMID: 29507086 Free PMC article.
-
Genetic Characterization of a Glycyl Radical Microcompartment Used for 1,2-Propanediol Fermentation by Uropathogenic Escherichia coli CFT073.J Bacteriol. 2020 Apr 9;202(9):e00017-20. doi: 10.1128/JB.00017-20. Print 2020 Apr 9. J Bacteriol. 2020. PMID: 32071097 Free PMC article.
-
Facile methods for heterologous production of bacterial microcompartments in diverse host species.Microb Biotechnol. 2018 Jan;11(1):160-162. doi: 10.1111/1751-7915.12869. Epub 2017 Dec 4. Microb Biotechnol. 2018. PMID: 29205936 Free PMC article. Review. No abstract available.
-
Prokaryotic Organelles: Bacterial Microcompartments in E. coli and Salmonella.EcoSal Plus. 2020 Oct;9(1):10.1128/ecosalplus.ESP-0025-2019. doi: 10.1128/ecosalplus.ESP-0025-2019. EcoSal Plus. 2020. PMID: 33030141 Free PMC article. Review.
-
Enzyme Assembly for Compartmentalized Metabolic Flux Control.Metabolites. 2020 Mar 26;10(4):125. doi: 10.3390/metabo10040125. Metabolites. 2020. PMID: 32224973 Free PMC article. Review.
References
MeSH terms
Substances
LinkOut - more resources
Full Text Sources
Other Literature Sources
Research Materials
