. 2017 Apr 26;8(1):95.
doi: 10.1186/s13287-017-0544-z.

Label retention and stem cell marker expression in the developing and adult prostate identifies basal and luminal epithelial stem cell subpopulations

Affiliations

Label retention and stem cell marker expression in the developing and adult prostate identifies basal and luminal epithelial stem cell subpopulations

Jens Adam Ceder et al. Stem Cell Res Ther. .

Abstract

Background: Prostate cancer is the second most frequent cancer among males worldwide, and most patients with metastatic disease eventually develop therapy-resistant disease. Recent research has suggested the existence of cancer stem-like cells, and that such cells are behind the therapy resistance and progression.

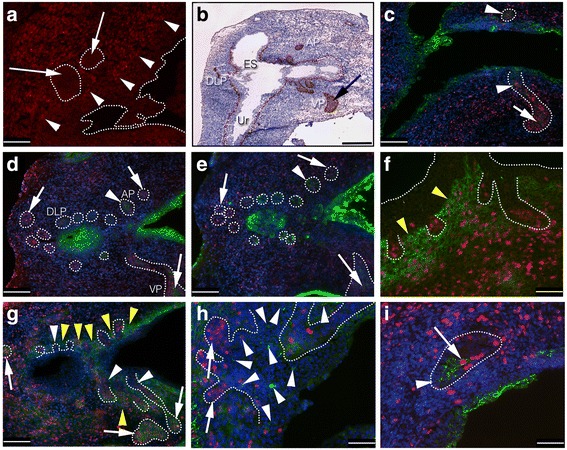
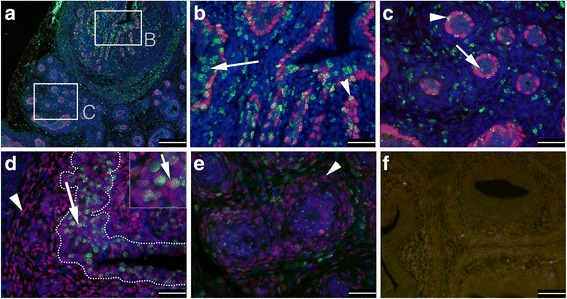
Methods: Here, we have taken advantage of the relatively quiescent nature of stem cells to identify the slow-cycling label-retaining stem cell (LRC) populations of the prostate gland. Mice were pulsed with bromodeoxyuridine (BrdU) during prostate organogenesis, and the LRC populations were then identified and characterized in 5-day-old and in 6-month-old adult animals using immunohistochemistry and immunofluorescence.

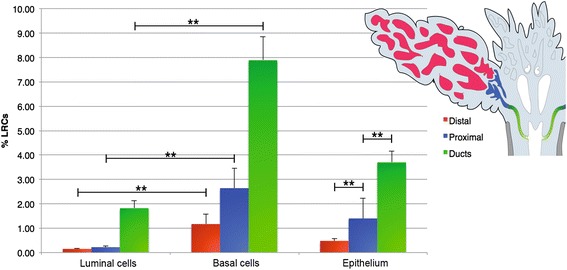
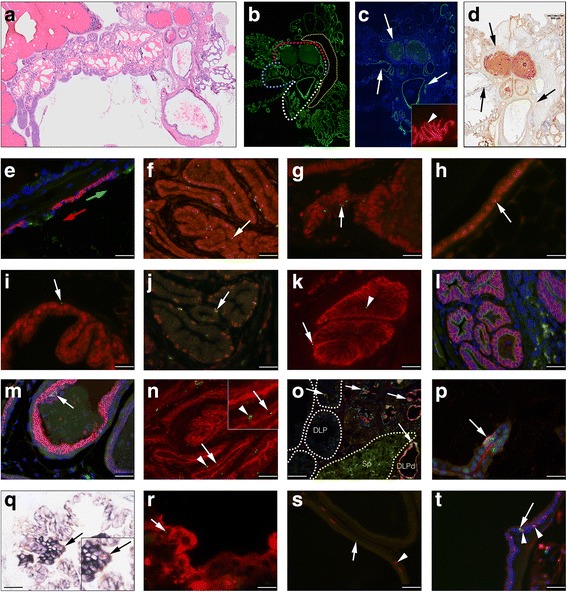
Results: Quantification of LRCs in the adult mouse prostate showed that epithelial LRCs were significantly more numerous in prostatic ducts (3.7 ± 0.47% SD) when compared to the proximal (1.4 ± 0.83%) and distal epithelium (0.48 ± 0.08%) of the secretory lobes. LRCs were identified in both the basal and epithelial cell layers of the prostate, and LRCs co-expressed several candidate stem cell markers in a developmental and duct/acini-specific manner, including Sca-1, TROP-2, CD133, CD44, c-kit, and the novel prostate progenitor marker cytokeratin-7. Importantly, a significant proportion of LRCs were localized in the luminal cell layer, the majority in ducts and the proximal prostate, that co-expressed high levels of androgen receptor in the adult prostate.

Conclusions: Our results suggest that there are separate basal and luminal stem cell populations in the prostate, and they open up the possibility that androgen receptor-expressing luminal stem-like cells could function as cancer-initiating and relapse-responsible cells in prostate cancer.

Keywords: Adult stem cells; Development; Label retaining; Organogenesis; Prostate.


Figures

Fig. 1
Fig. 1
IHC and IF analysis of cell lineage, SC markers, and proliferating cells in early developing mouse prostate. Sagittal sections of urogenital sinus day E18.5 embryo (a) and sagittal sections of postnatal day P0 (bi) were subjected to antibodies against AR (a; red), p63 (b; DAB), Ki67 (ci; red), KRT-8 (c; green), TROP-2 (d; green), Sca-1 (e; green), CD133 (f; green), CD44 (g; green), c-kit (h; green), and KRT-7 (i; green). Note mesenchymal AR expression (arrowheads) and absence of epithelial AR (arrows) during bud induction (a). Arrow in (b) shows p63 expression in ‘luminally’ located cells of distal epithelium in newborn prostates. Note weak luminally located KRT-8 expression of both proximal (arrowheads) and distal epithelium (arrow, c). Both TROP-2 and Sca-1 showed broader expression in the proximal AP (arrowhead, d, e) than in the distal AP (rightmost arrow, d, e) and distal DLP (leftmost arrow, d, e). Both markers, however, extended into the distal VP (lower arrow, d, e). CD133 expression was restricted to proximal periurethral mesenchyme (yellow arrowheads, f). CD44 was not, or only very rarely, detected in duct epithelium (arrowheads, g), but abundantly expressed in proliferative (ci) distal tips (arrows, g). Note proximal periurethral expression of CD44 in mesenchyme (yellow arrowheads, g). C-kit was expressed in rare cells, preferentially located in proximal epithelium (arrowheads, h), the majority negative for Ki67 (arrows, h). Note a single proliferating KRT-7-positive cell (arrow, i) at the proximal/intermediate border of the AP (arrowhead; proximal epithelium). Counterstaining when used was either HTX (IHC) or DAPI (IF). Scale bars = 100 μm (a, f, hi), 200 μm (ce, g) and 500 μm (b); b is a composite image of several micrographs. In (b), the ventral lobe (VP), anterior prostate (AP), dorso-lateral prostate (DLP), ejaculatory sinus (ES), and urethra (Ur) are indicated
Fig. 2
Fig. 2
IF analysis of the distribution of LRCs and co-expression of cell lineage markers in transversal sections of postnatal day 5 (P5) mouse prostates. Paraffin sections were subjected to antibodies against BrdU (a–e; green), p63 (a–c), AR (d, e), and negative control (f). Note that both basally (p63-positive; arrowheads) and luminally (p63-negative; arrows) located LRCs were more numerous and more strongly labeled in ducts (a,b) than when compared to distal epithelium (a, c). In P5 prostates, AR was expressed in terminal ducts (d), and some of the strongest AR-expressing cells co-expressed BrdU (arrow, d). However, distal acini (e) expressed no or only low levels of AR (arrowheads indicate stromal AR expression in d, e). DAPI was used as counterstaining in a–e. Scale bars = 200 μm (a), 100 μm (f), and 50 μm (b–e)
Fig. 3
Fig. 3
IF analysis of the distribution of LRCs and co-expression of SC markers in sagittal sections of postnatal day 5 (P5) mouse prostates. a A cartoon of a sagittal P5 section; bladder and urethra (indicated in yellow), stroma (light blue), sphincter (Sp; grey), vas deferens (VD) and ejaculatory duct (Ed) (both black), ejaculatory sinus (ES; orange), seminal vesicle (SV; brown), and the ventral prostate (VP; dark blue), dorso-lateral prostate (DLP; green), and anterior prostate (AP; red). bd are composite images of serial sagittal HTX stained sections, where ducts draining from a specific lobe are indicated by the addition of a ‘d’ to the lobular abbreviation. Frozen sections were subjected to antibodies against Sca-1 (red) and CK14 (green) (e, f), CD133 (green) (g), TROP-2 (green) and BrdU (red) (h), Sca-1 (red) and BrdU (green) (i), CD44 (red) and BrdU (green) (jl), c-kit (red) and BrdU (green) (m, o), c-kit (red) and Sca-1 (green) (n), and KRT-7 (red) and BrdU (green) (p). Sca-1 (e, f, i) and TROP-2 (h) were highly expressed in basal and luminal cells of ducts draining into the ES and urethra. The mesenchyme surrounding these proximal ducts was positive for CD133 expression (g). Sagittal sections clearly demonstrated that LRCs were more numerous and more strongly labeled in terminal draining ducts in or close to where the ES fuses with the urethra (h, j, k), whereas more distal structures contained fewer and less bright LRCs (h, k). The number and intensity of epithelial LRCs further abruptly decreased at the border of the Sp, where the ducts cross to enter the prostate lobes (i, p; arrows indicate luminal, whereas arrowheads indicates a basal location). At this border, many putative SC markers changed their distribution pattern in both epithelium and stroma, including Sca-1 (i, n), TROP-2 (h), CD44 (k), c-kit (n), and KRT-7 (p). Whereas Sca-1 (inset in (e) shows rare luminal Sca-1 expression of the VP from a serial section close to (e)), c-kit (n), and KRT-7 (p) expression was rare in distal epithelium of all lobes, we found TROP-2 to be more commonly expressed in the VP when compared to other lobes (h). CD133 was upregulated in the distal DLP (arrow, g) of P5 prostates, and whereas CD44 showed high expression in distal epithelium of the DLP (k) and AP (arrows and inset in k), CD44 was downregulated in distal luminal cells of the VP (k, l), but not in the basal cells (arrows, l). Additionally, VP ducts showed upregulation of CD44 in the basal cell layer (j, k) in P5 prostates. LRCs strongly reactive for BrdU in the prostate epithelium were found to express the putative SC markers TROP-2 (h), Sca-1 (i), CD44 (jl), c-kit (m,o), and KRT-7 (p). Counterstaining was either HTX (IHC) or DAPI (IF). Scale bars = 25 μm (i, o, p), 50 μm (h, j, l n), and 100 μm (eg, k). be are composite images of several micrographs
Fig. 4
Fig. 4
Quantitative analysis of label-retaining cell (LRC) distribution in the adult prostate. Quantification of LRCs in the adult mouse prostate showed that epithelial LRCs were significantly more numerous in prostatic ducts (green) (3.7 ± 0.47%, mean ± SD) as compared to both proximal (blue) and distal (red) lobular epithelium, and that proximal epithelium contained significantly more LRCs than distal epithelium (1.40 ± 0.83% vs. 0.48 ± 0.08%). Importantly, both basal and luminal LRCs were detected in the secretory epithelium and ducts of the adult prostate. Basal LRCs in the adult prostate varied significantly between ducts and proximal epithelium (7.89 ± 0.97% vs. 2.64 ± 0.81%, p < 0.01), and between proximal and distal secretory epithelium (2.64 ± 0.81 vs. 1.17 ± 0.42%, p < 0.01). Likewise, luminal LRCs varied significantly between ducts and proximal/distal epithelium (1.82 ± 0.31% vs. 0.22 ± 0.04%, p < 0.01; and 1.82 ± 0.31% vs. 0.15 ± 0.02%, p < 0.01), but not significantly between proximal and distal epithelium. Error bars represent standard deviation (SD). **p ≤ 0.01
Fig. 5
Fig. 5
IF and IHC analysis of the distribution of long-lived LRCs and expression of cell lineage and SC markers in the adult mouse prostate. a A transversal HTX stained section of an adult prostate; (b) shows KRT-8 expression (green) in a consecutive section to (a), with dotted lines marking the border between distal and proximal/ductal epithelium; the white line demarks the proximal VP, blue line demarks the proximal AP, and the DLP is demarked in red. A yellow dotted line demarks the sphincter muscle. In (c), the abrupt decrease in TROP-2 (green) at the proximal-distal border is indicated by arrows, and a representational magnification of BrdU (green) and TROP-2 (red) from the proximal AP is highlighted in the inset (arrowhead, c). In contrast, CD133 (DAB) was absent from the proximal lobes and ducts (arrow, d), but strongly expressed by luminal cells of the distal lobes (d). CD133 (green) and TROP-2 (red) expression showed some overlap at the very proximal-distal border of the AP lobes (green arrow points distally), but was mutually excluding at the cellular level (e). f, g LRCs (green) positive for AR expression (red) (arrows, fh). The arrow in (i) highlights a basal LRC (green) that is negative for AR. Basal LRCs (green) expressed p63 (red) (arrow, j), and both basal (arrow) and luminal (arrowhead) LRCs (green) in ducts were found to express CD44 (red). l KRT-7 (green) and TROP-2 (red) were co-expressed in prostate ducts. However, KRT-7 (green) had a more restricted expression pattern in distal epithelium (m) as compared to TROP-2 (red). Basal (arrowhead) and luminal (arrow) LRCs (green) co-expressed KRT-7 (red) in prostate ducts (n). o Co-expression of KRT-7 (red) and AR (green) is seen in the dorso-lateral prostate (DLP) (arrows); distal DLP epithelium is indicated by white dotted lines, and the sphincter muscle (Sp) is demarked by a yellow dotted line. Note a rare KRT-7 and AR co-expressing cell in the distal DLP and the high frequency of co-expressing cells in the ducts and proximal DLP (o). Rare KRT-7-expressing cells (red) in the distal AP further co-expressed high levels of AR (green) (arrow, p). The expression level of c-kit was lower in adult prostates and the harsh BrdU protocol hindered proper IF detection of c-kit; however, using double sequential chromogenic detection, c-kit (NBT/BCIP)-positive LRCs (DAB) could be detected (arrow, q). r A single LRC (green) co-expressing Sca-1 is indicated in the distal VP (arrow). No LRCs (green) (arrow, s) were found positive for the proliferative marker Ki67 (red) (arrowhead, s). The majority of proliferating (Ki67; green) cells were found in the luminal cell layer (arrow, t) and were negative for p63 (red) (arrowheads, t) expression. Counterstaining when applied was either with HTX (IHC) or DAPI (IF). ad are consecutive composite images of several individual photomicrographs. Scale bar = 500 μm (ad), 25 μm (i, o, p, r), 50 μm (h, j, ln, q), and 100 μm (eg, k, s-t)

References

    1. Alonso M, Ortega-Pérez I, Grubb MS, Bourgeois J-P, Charneau P, Lledo P-M. Turning astrocytes from the rostral migratory stream into neurons: a role for the olfactory sensory organ. J Neurosci. 2008;28:11089–102. doi: 10.1523/JNEUROSCI.3713-08.2008. - DOI - PMC - PubMed
    1. Aumuller G, Leonhardt M, Renneberg H, Rahden BV, Bjartell A, Abrahamsson P. Semiquantitative morphology of human prostatic development and regional distribution of prostatic neuroendocrine cells. Prostate. 2001;115:108–15. doi: 10.1002/1097-0045(20010201)46:2<108::AID-PROS1014>3.0.CO;2-9. - DOI - PubMed
    1. Balbas MD, Evans MJ, Hosfield DJ, Wongvipat J, Arora VK, Watson PA, Chen Y, Greene GL, Shen Y, Sawyers CL. Overcoming mutation-based resistance to antiandrogens with rational drug design. Elife. 2013;2:e00499. doi: 10.7554/eLife.00499. - DOI - PMC - PubMed
    1. Breault DT, Min IM, Carlone DL, Farilla LG, Ambruzs DM, Henderson DE, Algra S, Montgomery RK, Wagers AJ, Hole N. Generation of mTert-GFP mice as a model to identify and study tissue progenitor cells. Proc Natl Acad Sci U S A. 2008;105:10420–5. doi: 10.1073/pnas.0804800105. - DOI - PMC - PubMed
    1. Buczacki SJA, Zecchini HI, Nicholson AM, Russell R, Vermeulen L, Kemp R, Winton DJ. Intestinal label-retaining cells are secretory precursors expressing Lgr5. Nature. 2013;495:65–9. doi: 10.1038/nature11965. - DOI - PubMed

Publication types