. 2017 Aug;7(8):884-899.
doi: 10.1158/2159-8290.CD-16-1297. Epub 2017 Apr 26.

PAX3-FOXO1 Establishes Myogenic Super Enhancers and Confers BET Bromodomain Vulnerability

Affiliations

PAX3-FOXO1 Establishes Myogenic Super Enhancers and Confers BET Bromodomain Vulnerability

Berkley E Gryder et al. Cancer Discov. 2017 Aug.

Abstract

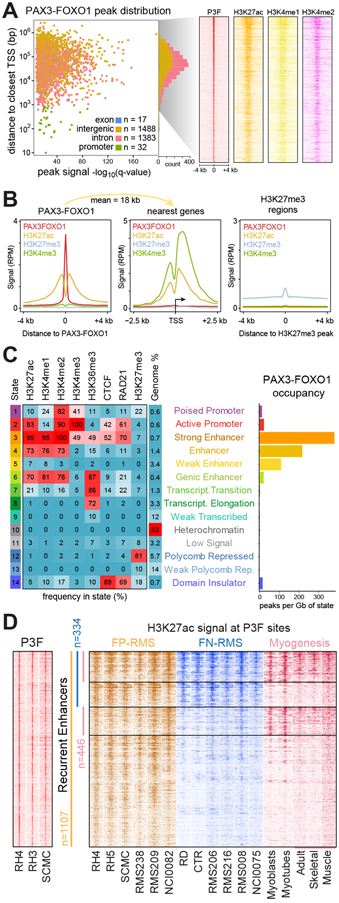
Alveolar rhabdomyosarcoma is a life-threatening myogenic cancer of children and adolescent young adults, driven primarily by the chimeric transcription factor PAX3-FOXO1. The mechanisms by which PAX3-FOXO1 dysregulates chromatin are unknown. We find PAX3-FOXO1 reprograms the cis-regulatory landscape by inducing de novo super enhancers. PAX3-FOXO1 uses super enhancers to set up autoregulatory loops in collaboration with the master transcription factors MYOG, MYOD, and MYCN. This myogenic super enhancer circuitry is consistent across cell lines and primary tumors. Cells harboring the fusion gene are selectively sensitive to small-molecule inhibition of protein targets induced by, or bound to, PAX3-FOXO1-occupied super enhancers. Furthermore, PAX3-FOXO1 recruits and requires the BET bromodomain protein BRD4 to function at super enhancers, resulting in a complete dependence on BRD4 and a significant susceptibility to BRD inhibition. These results yield insights into the epigenetic functions of PAX3-FOXO1 and reveal a specific vulnerability that can be exploited for precision therapy.Significance: PAX3-FOXO1 drives pediatric fusion-positive rhabdomyosarcoma, and its chromatin-level functions are critical to understanding its oncogenic activity. We find that PAX3-FOXO1 establishes a myoblastic super enhancer landscape and creates a profound subtype-unique dependence on BET bromodomains, the inhibition of which ablates PAX3-FOXO1 function, providing a mechanistic rationale for exploring BET inhibitors for patients bearing PAX-fusion rhabdomyosarcoma. Cancer Discov; 7(8); 884-99. ©2017 AACR.This article is highlighted in the In This Issue feature, p. 783.


Conflict of interest statement

All authors declare no conflicts of interest.

Figures

Figure 1.
Figure 1.. Chromatin State Mapping Pinpoints PAX3-FOXO1 in Active Enhancers.
(A) PAX3-FOXO1 peak distribution and heatmaps of PAX3-FOXO1, H3K27ac, H3K4me1, and H3K4me2 at distal regulatory elements in PAX3-FOXO1 bearing cell line (RH4). The scatter plot is accompanied by a histogram showing the amounts of PAX3-FOXO1 in intronic, exonic, intergenic or promoter-proximal sites. Rows are centered around PAX3-FOXO1 peaks and extended 4 kb in each direction, sorted by PAX3-FOXO1 signal strength. (B) PAX3-FOXO1, H3K27ac, H3K27me3 and H3K4me3 signal at PAX3-FOXO1 peaks (left), genes nearest to PAX3-FOXO1 peaks (center), and Polycomb repressed chromatin (right). Mean distance of PAX3-FOXO1 to its nearest genes (18 kb) is indicated. (C) Chromatin states in FP-RMS cells (left) and abundance of PAX3-FOXO1 peaks per Gb of each state (right). States were discovered de novo using ChIP-seq data for all histone marks (plus, CTCF and RAD21) with the hidden Markov modelling algorithm chromHMM, which bins the genome into states by recurring patterns. Frequency corresponds to the probability of each mark being present in a given state. (D) High-confidence PAX3-FOXO1 sites bound to enhancers recurrent (n = 1107) in FP-RMS cell lines and tumors, some of which are shared with FN-RMS (n = 334) and/or myogenic cells and tissue (n = 446).
Figure 2.
Figure 2.. Transcriptional and Epigenetic Landscapes of RMS Cell Lines and Primary Tumors
(A) Strategy for identifying master transcription factors (MTFs) from RNA-seq and ChIP-seq datasets. (B) RNA sequencing of patient RMS tumors reveals a set of candidate master transcription factors (n = 170) identified by filtering for significant overexpression (p<1E-30) across one or both RMS subtypes, and removal of general transcription factors (those ubiquitously expressed in all tumors and tissues). Candidates were ranked and plotted based on average overall expression in fusion positive RMS (cell lines and tissues) and myoblasts/myotubes. (C) Violin plots of gene expression of MYOD1, MYOG and MYCN across RMS, myoblast, myotubes and normal tissues. (D) H3K27ac binding at distal enhancers ranked by increasing signal in cell lines and primary tumors bearing PAX3-FOXO1 translocation. Super enhancers (SEs) were identified as those beyond the inflection point where rapid increase in signal is observed (indicated by a dashed gray line). TF genes associated with SEs are indicated in blue. (E) Number of RH4 SEs which occur as enhancers (n = 765) and SEs in FP-RMS cell lines or tumors (n = 466), or which also appear in FN-RMS as SEs (n = 337). (F) Enrichment of known recognition sequences for MYOD, MYOG, PAX3-FOXO1, and MYCN, compared with no enrichment for CTCF in FP-RMS SEs. (G) Reduction in cell viability upon siRNA against PAX3, MYOD1, MYOG, and MYCN in FN-RMS (RD, CTR) and FP-RMS (RH4, RH5) cells. PAX3 siRNAs targeted the first few exons, which are intact in the fusion PAX3-FOXO1. CellTiter-Glo was used to measure viability, and all data was normalized to cells treated with scrambled siRNA. Bars show median (error bars = range) of 3 independent siRNA sequences (RH5, RD, CTR) or 2 independent sequences (RH4). Experiments were performed at 48 hours of transient siRNA transfection. (H) MYOD1 enhancers are bound by PAX3-FOXO1 and loaded with active histone mark H3K27ac in RH4 cells (top) and are progress through myogenesis (middle) and are absent in other cell and tissue types (overlapping plots, bottom). ENCODE and Epigenome Roadmap data tracks are provided at WashU Epigenome browser session http://epigenomegateway.wustl.edu/browser/?genome=hg19&session=IHfj0MDWoA&statusId=728028850. (I) Myogenic enhancers at PAX3-FOXO1 binding sites diminish through muscle differentiation. RPM, reads per million mapped reads. FP-RMS signal is from RH4 cells, Myoblasts and Myotubes are from ENCODE, skeletal muscle data is from a normal tissue sample. (J) Same enhancer locations as (I) interrogated for H3K27ac signal in RH4 cells treated with shRNA for 48 hours (shScramble or shPAX3-FOXO1). Signal was normalized to spike-in Drosophila reads (ChIP with reference exogenous genome, ChIP-Rx) and are plotted as reference adjusted reads per ten million (RRPTM).
Figure 3.
Figure 3.. PAX3-FOXO1 Collaborates with Master Transcription Factors MYOD, MYOG and MYCN at Super Enhancers.
(A) Characteristics enlisting candidate MTFs in FP-RMS: SE driven, high expression, with motifs enriched across all SEs predicting TF binding. (B) The percent of enhancers (divided into groups by the number of MTFs therein) which classify as either typical or super. Null hypothesis (that the % of super enhancers does not depend on number of MTFs present in an enhancer) was evaluated with Fisher’s exact test; * = p < 0.04, **** = p < 0.0001, ns = not significant. (C) Left: read density profiles of H3K27ac, H3K4me1 and H3K4me2 at regions of typical enhancer (TE) and super enhancer (SE) architecture. Median enhancer length is indicated. Right: collaborative co-occupancy of MTFs in TEs and SEs. Presence of each MTF at enhancer is indicated by the respective colors. (D) Top: enhancer occupancy of each MTF at TEs or SEs. Bottom: fold enrichment of SEs over TE for each MTFs. (E) Average number of MTFs per enhancer type. Error bars show 95% confidence interval. (F) Expression of genes associated with enhancers of various MTF combinations (left) or SE and TE genes (right), associated by proximity. RNA-seq reported as FPKM, fragments per kilobase of transcript per million mapped reads. Error bars represent 95% confidence interval. P-values calculated by Welch’s unpaired t-test. (G) Mutual and self-reinforcement of master transcription factors via SEs for PAX3-FOXO1, MYOD1, MYCN and MYOG. Tracks show signal in RPM, reads per million mapped reads. TEs are indicated by gray bars, and SEs by red. To illustrate an example of multiple adjacent motifs presence within SEs, we have zoomed in on the PAX3 and MYOD/MYOG motifs present upstream of MYCN.
Figure 4.
Figure 4.. PAX3-FOXO1 Opens Chromatin and Recruits BRD4 at Looped Enhancers.
(A) Heatmaps of PAX3-FOXO1, DNase, p300, H3K27ac, BRD4, MED1, CTCF and RAD21 signal at PAX3-FOXO1 peaks, ranked by distance to closest BRD4 peak in RH4. Rug graph indicates which locations (red lines) are within SEs. (B) PAX3-FOXO1 and BRD4 co-occupancy at enhancers (top: typical, bottom: super). (C) Introduction of PAX3-FOXO1 into a fibroblast causes increased sensitivity to DNase, deposition of H2K27ac and recruitment of BRD4 at PAX3-FOXO1 sites. (D) Metagene analysis of DNase, H3K27ac, PAX3-FOXO1 and BRD4 upon PAX3-FOXO1 introduction into fibroblasts (left) compared to RH4 cells (end right). (E) Opening of chromatin at the MYOD1 SE by PAX3-FOXO1 in fibroblasts (7250) with empty vector (middle) or PAX3-FOXO1 (bottom), compared with RH4 cells (top). (F) Hi-C profile (top) surrounding MYOD1 locus from NHEK cells (19) with CTCF, RAD21, PAX3-FOXO1, p300, MED1, BRD4 and H3K27ac ChIP-seq data in RH4 cells. 4C-seq (bottom) from MYOD1 SE looping to adjacent SE region and MYOD1 promoter, and vice versa, in RH4 cells. Viewpoints are indicated by arrows anchored to their genomic locations.
Figure 5.
Figure 5.. Molecular Sensitivity Landscape of FP-RMS is Enriched in SE Associated Targets including BRD4
(A) Potency in PAX3-FOXO1 RMS cell lines verses toxicity in normal cell lines measured by dose response and summarized across 240 mechanistically distinct subcategories. The percent area under the dose response curve (%AUC) was averaged for all compounds within a target subcategory. The number of compounds in each category is indicated by the size of the bubble, and the difference in AUC (normal – RMS) is indicated by color scale. (B) Differential sensitivities against molecules targeting proteins associated with SEs, compared to non-SE targets and SE-signal transduction. Size of the bubble indicates number of molecules against each target. (C) IC50 Heat map of 5 BET bromodomain inhibitors and 1 pan-bromodomain inhibitor across 5 PAX-Fusion and 4 Fusion Negative RMS cell lines. (D) Growth curves of FP-RMS cells (RH5) and FN-RMS cells (CTR) exposed to increasing concentrations of JQ1 or DMSO. Confluence measured by phase-contrast images every 4 hours over multiple days of treatment. Inset: images of RH5 cells with DMSO or 120 nM JQ1. (E) PAX3-FOXO1 increases sensitivity of fibroblasts to JQ1.
Figure 6.
Figure 6.. JQ1 Selectively Ablates PAX3-FOXO1 Driven Transcription and BRD4 Interaction.
(A) Selective disruption of SE genes upon BET bromodomain inhibition (top) or inducible shRNA depletion of PAX3-FOXO1 (bottom) in RMS cells (RH4). Fold change in gene expression calculated by comparison with log2 of FPKM in controls (DMSO, scramble shRNA). Error bars show the 95% confidence interval. P-values calculated by Welch’s unpaired t-test. (B) Gene set enrichment analysis (GSEA) revealed the inhibition of PAX3-FOXO1 fusion gene targets, both by JQ1 and PAX3-FOXO1 knock down. NES, Normalized Enrichment Score. FDR, False Discovery Rate. Genes used were high-confidence PAX3-FOXO1 targets with recurrent enhancers in 83-100% of FP-RMS samples, as reported in Table S2. (C) mRNA expression alterations of SE (red bar) and PAX3-FOXO1 (red peak) targets after 6 hours of 500 nM JQ1 treatment in RH41 and RH4 cells. Heatmap indicates the log2 fold change in FPKM. (D) Protein levels of MYOD and MYOG by immunoblotting of RH4 cell lysates after treatment with JQ1(1 μM) over time. (E) Exon level expression and fold change in RH4 cells upon JQ1 treatment (6 hours, 500 nM), for PAX3-FOXO1, MYOD1, MYOG, MYC and MYCN. PAX3-FOXO1 expression remains intact upon JQ1 treatment unlike the other key transcription factors. (F) BRD4 and PAX3-FOXO1 localization shown via ChIP-seq (top) and re-ChIP-qPCR in the presence and absence of JQ1 (bottom) at the MYOD upstream SE, MYOG downstream SE and PIPOX intronic SE. RH4 cells were treated for 6 hours with DMSO or 1 μM JQ1. (G) Co-Immunoprecipitation of PAX3-FOXO1 and BRD4 from RH4 cells treated with DMSO or 1 μM JQ1 for 24 hours. (H) PAX3-FOXO1 immunoblot after 6 hour treatment of DMSO or JQ1 with increasing concentrations. Bar chart (top) quantization of PAX3-FOXO1 normalized to loading controls (β-actin). (I-J) Stability of PAX3-FOXO1 protein measured by immunoblotting after halting translation with cycloheximide (CHX) in RH4 cells treated with DMSO or JQ1 (1 μM).
Figure 7.
Figure 7.. PAX3-FOXO1 Dependent Super Enhancer Disruption by BET Inhibition In Vivo.
(A) JQ1 selectively abolishes PAX3-FOXO1 dependent enhancer activity, as measured in PAX3-FOXO1 containing cells (RH4) stably transduced with a lentiviral pGreenFire reporter construct under the control of the PAX3-FOXO1 driven ALK SE, while not reducing the CMV driven expression. CDK7 inhibitor THZ1 inhibits activity of both constructs. PAX3-FOXO1 driven luciferase (red line) is graphed on the left Y-axis (linear), and CMV driven luciferase (blue-green line) is graphed to the right Y-axis (log 10 scale). Error bars show standard deviation of duplicate wells, and results are representative of 2 independent experiments. (B) CMV (left flank) and ALK SE (right flank) reporter contructs in RH4 xenografts. JQ1 or vehicle treatment began on day 0 after the first image was taken. (C) Left: RMS (RH4) tumor growth with vehicle or JQ1 treated mice. Measurements taken with caliper and include both CMV and PAX3-FOXO1-SE legs. Right: tumor volume at day 27. P-value calculated by Welch’s unpaired t-test.

References

    1. Lee Tong I, Young Richard A Transcriptional Regulation and Its Misregulation in Disease. Cell. 2013;152(6):1237–51. - PMC - PubMed
    1. Rabbitts T Chromosomal translocations in human cancer. Nature. 1994;372(6502):143–9. - PubMed
    1. Shern JF, Chen L, Chmielecki J, Wei JS, Patidar R, Rosenberg M, et al. Comprehensive Genomic Analysis of Rhabdomyosarcoma Reveals a Landscape of Alterations Affecting a Common Genetic Axis in Fusion-Positive and Fusion-Negative Tumors. Cancer Discovery. 2014. - PMC - PubMed
    1. Chen X, Stewart E, Shelat Anang A, Qu C, Bahrami A, Hatley M, et al. Targeting Oxidative Stress in Embryonal Rhabdomyosarcoma. Cancer Cell. 2013;24(6):710–24. - PMC - PubMed
    1. Riggi N, Knoechel B, Gillespie Shawn M, Rheinbay E, Boulay G, Suvà Mario L, et al. EWS-FLI1 Utilizes Divergent Chromatin Remodeling Mechanisms to Directly Activate or Repress Enhancer Elements in Ewing Sarcoma. Cancer Cell. 2014;26(5):668–81. - PMC - PubMed

MeSH terms