

Proteomics Analysis of Tissue Samples Reveals Changes in Mitochondrial Protein Levels in Parathyroid Hyperplasia over Adenoma
- PMID: 28446534
- PMCID: PMC5420820
- DOI: 10.21873/cgp.20031
Proteomics Analysis of Tissue Samples Reveals Changes in Mitochondrial Protein Levels in Parathyroid Hyperplasia over Adenoma
Abstract
Background/aim: To unveil the pathophysiology of primary hyperparathyroidism, molecular details of parathyroid hyperplasia and adenoma have to be revealed. Such details will provide the tools necessary for differentiation of these two look-alike diseases. Therefore, in the present study, a comparative proteomic study using postoperative tissue samples from the parathyroid adenoma and parathyroid hyperplasia patients was performed.
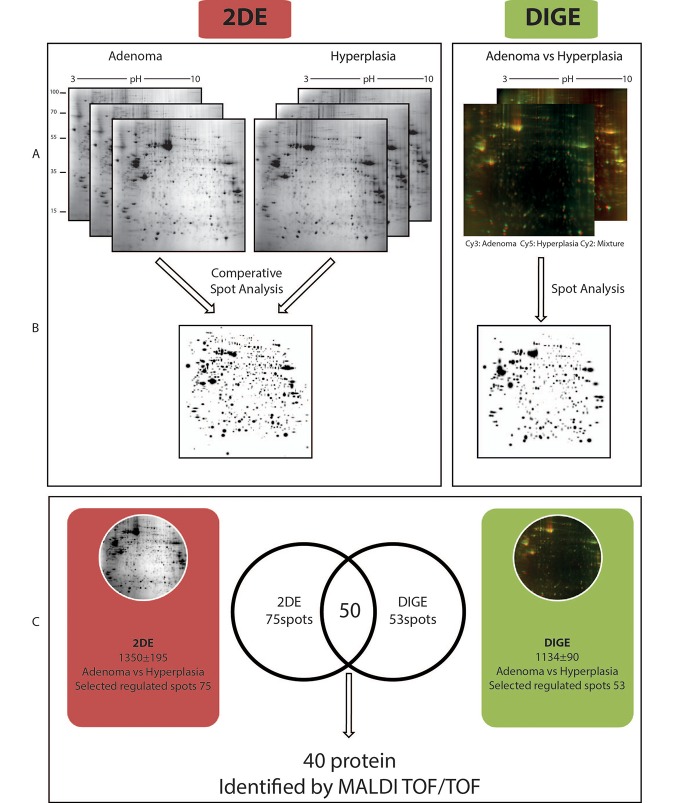
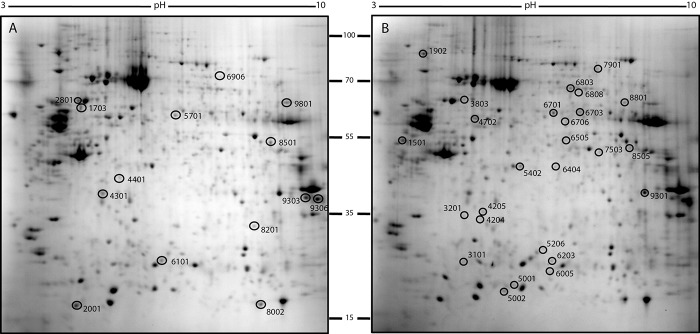
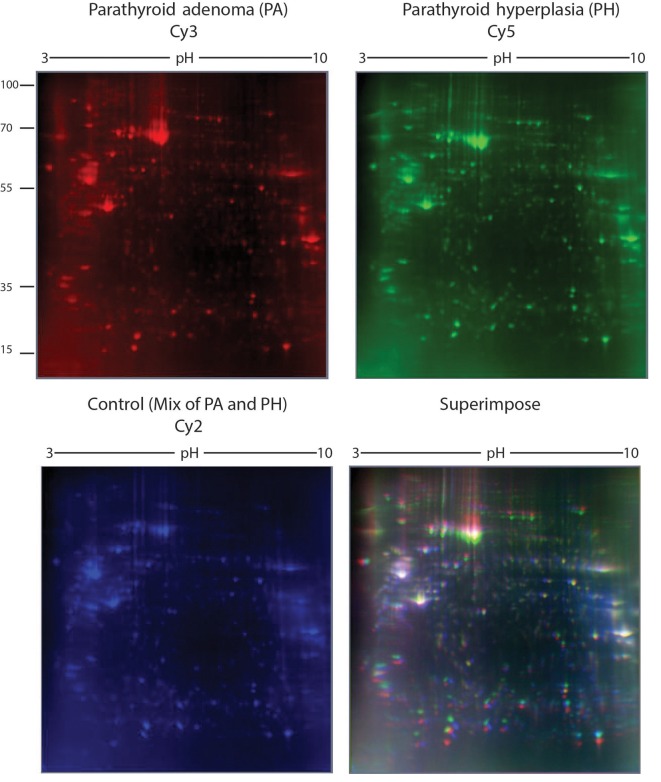
Materials and methods: Protein extracts were prepared from tissue samples (n=8 per group). Protein pools were created for each group and subjected to DIGE and conventional 2DE. Following image analysis, spots representing the differentially regulated proteins were excised from the and used for identification via MALDI-TOF/TOF analysis.
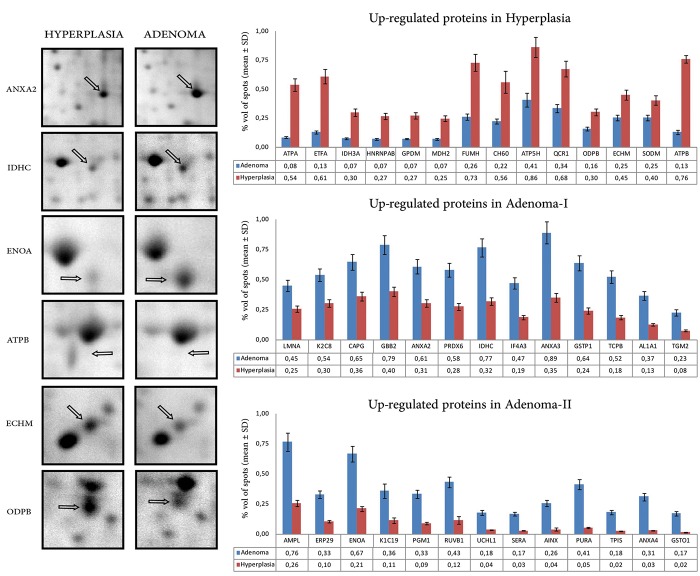
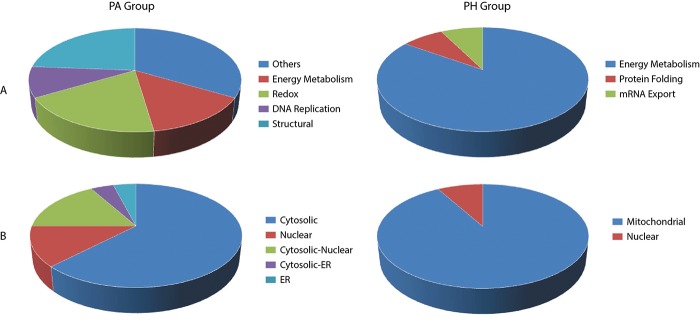
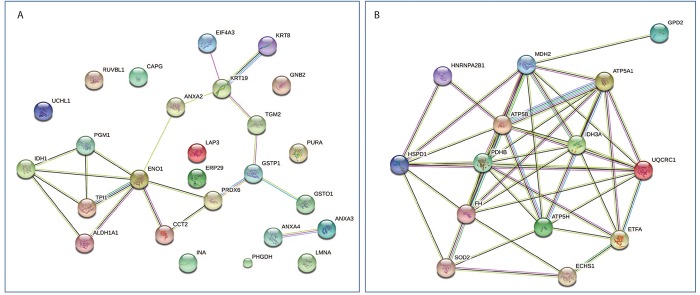
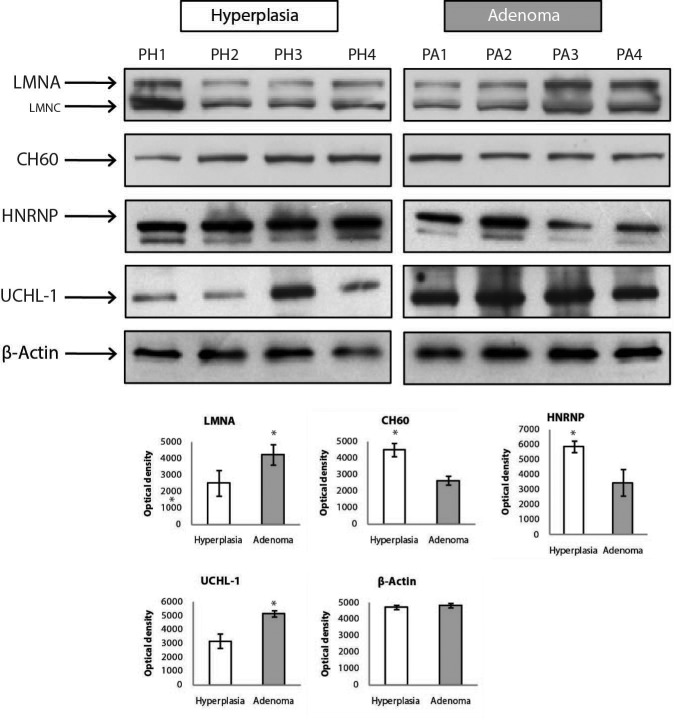
Results: The identities of 40 differentially-expressed proteins were revealed. Fourteen of these proteins were over-expressed in the hyperplasia while 26 of them were over-expressed in the adenoma.
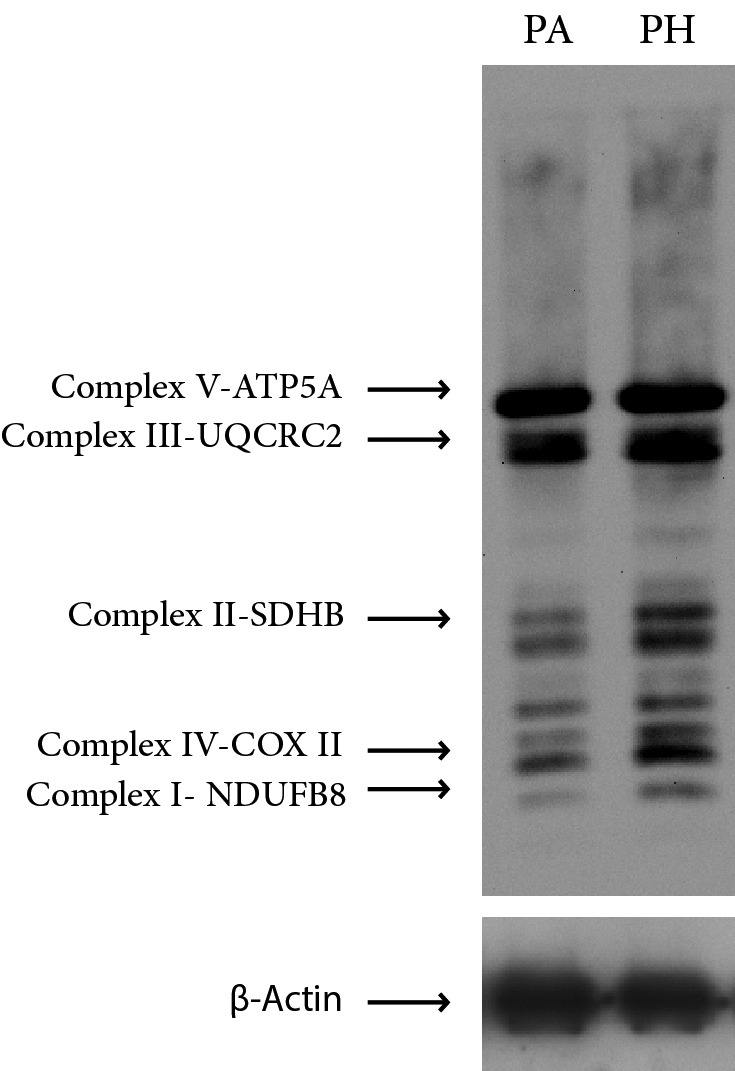
Conclusion: Most proteins found to be over-expressed in the hyperplasia samples were mitochondrial, underlying the importance of the mitochondrial activity as a potential biomarker for differentiation of parathyroid hyperplasia from adenoma.
Keywords: 2DE; MALDI-TOF/TOF; Parathyroid adenoma; Parathyroid gland; Parathyroid hyperplasia; proteomics.
Copyright© 2017, International Institute of Anticancer Research (Dr. George J. Delinasios), All rights reserved.
Figures
References
-
- Silverberg SJ, Bilezikian JP. Primary hyperparathyroidism: Still evolving. J Bone Miner Res. 1997;12(5):856–862. - PubMed
-
- Miedlich S, Krohn K, Paschke R. Update on genetic and clinical aspects of primary hyperparathyroidism. Clin Endocrinol (Oxf) 2003;59(5):539–554. - PubMed
-
- Marcocci C, Cetani F. Clinical practice. Primary hyperparathyroidism. N Engl J Med. 2011;365(25):2389–2397. - PubMed
-
- Duan K, Gomez Hernandez K, Mete O. Clinicopathological correlates of hyperparathyroidism. J Clin Pathol. 2015;68(10):771–787. - PubMed
MeSH terms
Substances
LinkOut - more resources
Full Text Sources
Other Literature Sources