. 2017 Jul 1;118(1):486-495.
doi: 10.1152/jn.00036.2017. Epub 2017 Apr 26.

Brain negativity as an indicator of predictive error processing: the contribution of visual action effect monitoring

Affiliations

Brain negativity as an indicator of predictive error processing: the contribution of visual action effect monitoring

Michael Joch et al. J Neurophysiol. .

Abstract

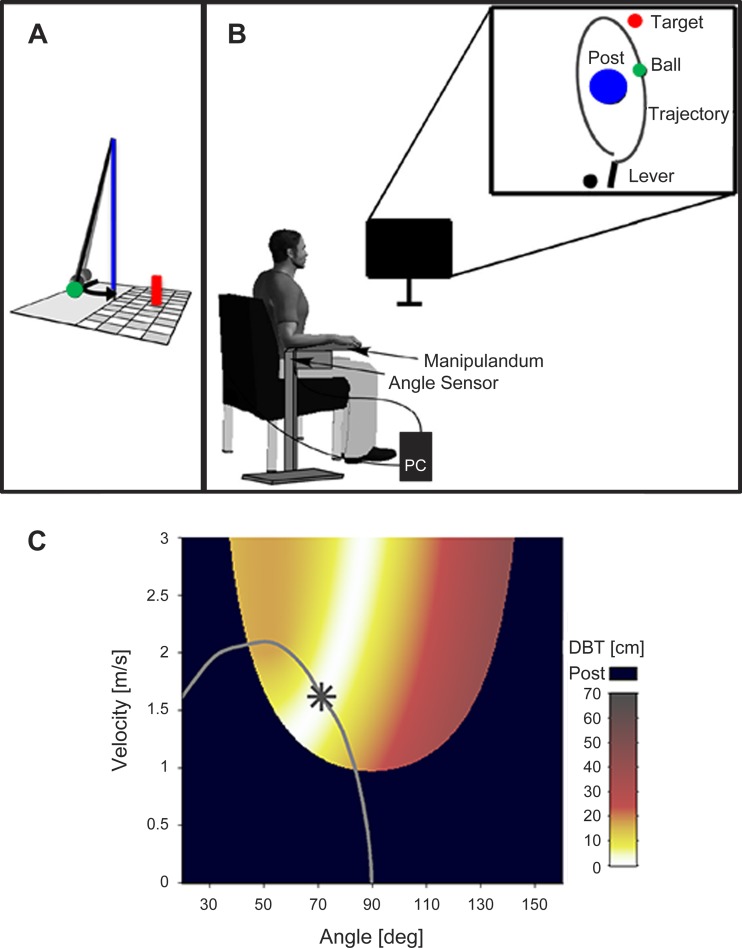
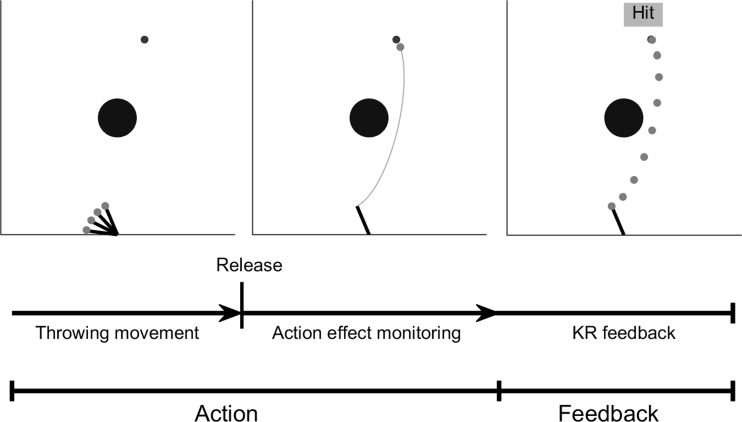
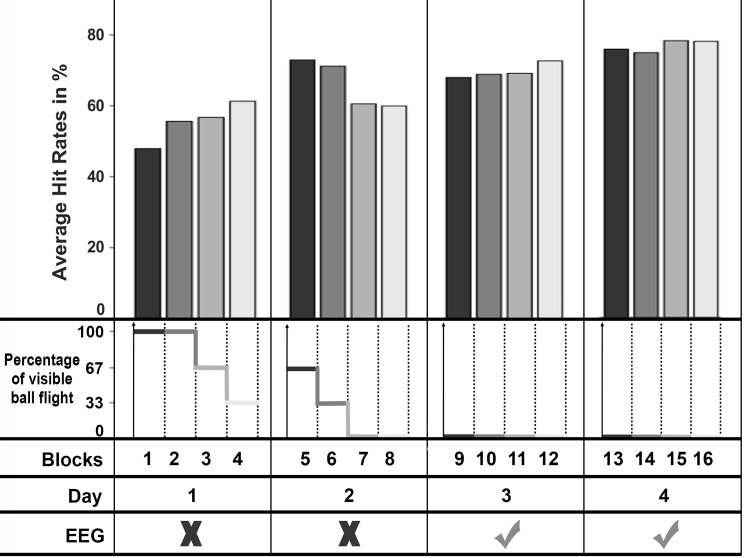
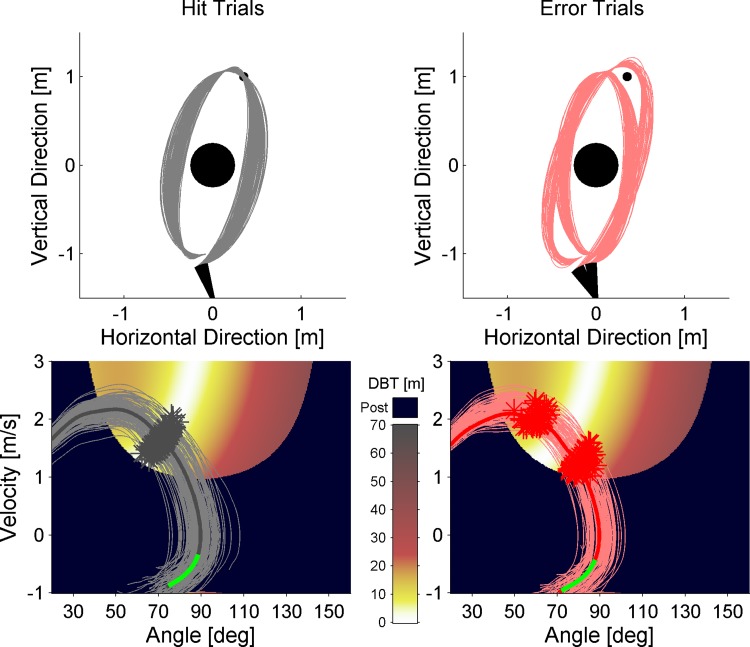
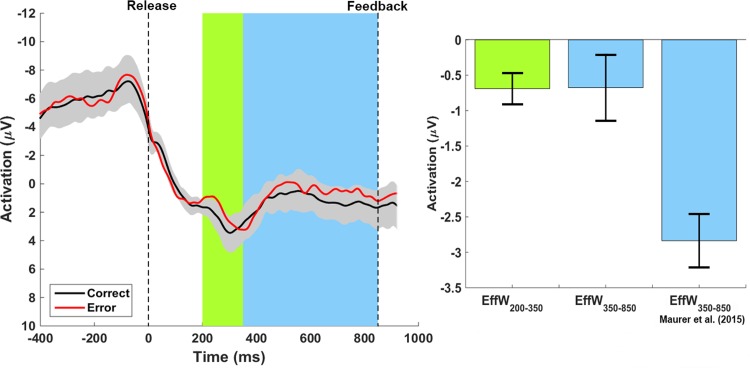
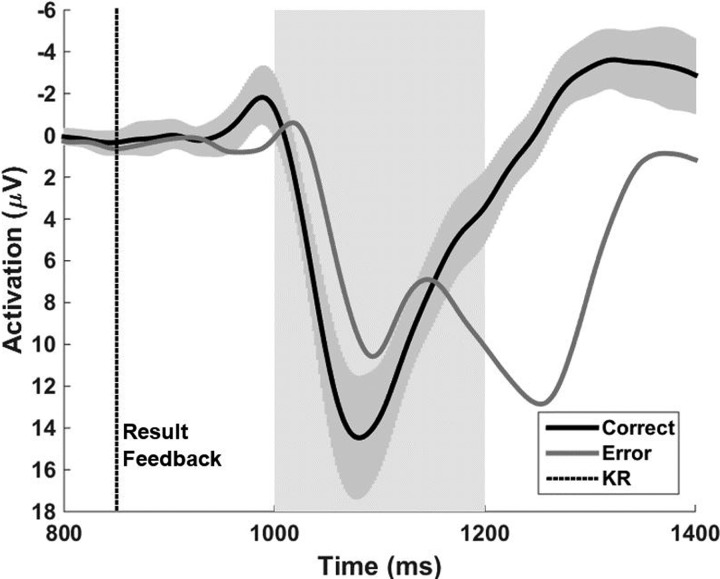
The error (related) negativity (Ne/ERN) is an event-related potential in the electroencephalogram (EEG) correlating with error processing. Its conditions of appearance before terminal external error information suggest that the Ne/ERN is indicative of predictive processes in the evaluation of errors. The aim of the present study was to specifically examine the Ne/ERN in a complex motor task and to particularly rule out other explaining sources of the Ne/ERN aside from error prediction processes. To this end, we focused on the dependency of the Ne/ERN on visual monitoring about the action outcome after movement termination but before result feedback (action effect monitoring). Participants performed a semi-virtual throwing task by using a manipulandum to throw a virtual ball displayed on a computer screen to hit a target object. Visual feedback about the ball flying to the target was masked to prevent action effect monitoring. Participants received a static feedback about the action outcome (850 ms) after each trial. We found a significant negative deflection in the average EEG curves of the error trials peaking at ~250 ms after ball release, i.e., before error feedback. Furthermore, this Ne/ERN signal did not depend on visual ball-flight monitoring after release. We conclude that the Ne/ERN has the potential to indicate error prediction in motor tasks and that it exists even in the absence of action effect monitoring.NEW & NOTEWORTHY In this study, we are separating different kinds of possible contributors to an electroencephalogram (EEG) error correlate (Ne/ERN) in a throwing task. We tested the influence of action effect monitoring on the Ne/ERN amplitude in the EEG. We used a task that allows us to restrict movement correction and action effect monitoring and to control the onset of result feedback. We ascribe the Ne/ERN to predictive error processing where a conscious feeling of failure is not a prerequisite.

Keywords: EEG; ERP; action effect monitoring; error negativity; forward model.


Figures

Fig. 1.
Fig. 1.
A: illustration of the British pub game skittles. The green ball must be thrown so that it flies around the center post and knocks down the target object (red cylinder). B: illustration of virtual skittles used in this study. The subjects sees the virtual version in 2 dimensions from a bird’s eye perspective. C: the execution and result space depicts every angle-velocity combination with its outcome coded by color (minimal distance ball to target, DBT). The gray line represents the course of angle-velocity combinations the ball passes through at one exemplary trial. The star on the trajectory represents the angle and velocity value at the moment of ball release.
Fig. 2.
Fig. 2.
The skittles task has an action and a feedback phase. During the action phase, subjects are throwing the ball with the help of the manipulandum (left). After the ball is released from the lever, the action is monitored until the thrown ball reaches the target (middle; note that in the present experiment, the ball is not visible during the action effect monitoring). At 850 ms after ball release, a static feedback about the ball flight trajectory, together with a verbal cue, is presented to provide information about the action outcome (KR feedback; right).
Fig. 3.
Fig. 3.
Development of hit rates (HR) over the 4 experimental days. To provide a better resolution about the trend of the HR, the 400 trials of each day are displayed in blocks of 100 trials. The EEG recordings were conducted at days 3 and 4. The second row displays the percentage of visible online feedback (ball flight) that participants received at each block.
Fig. 4.
Fig. 4.
Kinematic data (ball trajectories and corresponding movement trajectories) of all hit trials (left) and all error trials (right) of one example subject. Top, task space: single ball trajectories plotted onto the task space with center post, target, and the different release positions of the lever. Bottom, execution and result space: single throwing movement trajectories with corresponding release points (gray and red stars) and average trajectory (bold lines) plotted as a function of release variables (velocity and angle) and throwing result (distance ball to target, DBT). The background color of the execution and result space codes the distance from white, which indicates a target hit, to black, which indicates hitting the center post. The green part of the average trajectory represents the time period in the throwing trajectory where the Ne/ERN is expected to emerge.
Fig. 5.
Fig. 5.
Grand average curves of the hit (black) and error (red) trials. Data were synchronized to the moment of release (left broken line). The gray-shaded confidence band shows significant differences between the hit and error curves when the error curve falls outside the band. The green- and blue-shaded areas highlight the regions of the hypothesized effects. Bar diagram at right shows the mean difference activation for EffW200–350 in green and both the present effect and the effect found by Maurer et al. (2015) for EffW350–850 in blue (error bars represent SE).
Fig. 6.
Fig. 6.
Grand average curves of the hit and error trials. The time the subjects received the result feedback (KR) is displayed as a dotted line at 850 ms after ball release. The gray band illustrates the 95% confidence band that was constructed on the basis of the hit trials. The shaded area reaching from 1,000 to 1,200 ms represents the effect window for which the mean amplitude of differences curves was calculated and used for statistical testing.
Fig. 7.
Fig. 7.
Correlation between the mean amplitude within EffW200–350 and the average HR over EEG recording days.

Similar articles

Cited by

References

    1. Anguera JA, Seidler RD, Gehring WJ. Changes in performance monitoring during sensorimotor adaptation. J Neurophysiol 102: 1868–1879, 2009. doi:10.1152/jn.00063.2009. - DOI - PMC - PubMed
    1. de Bruijn ER, Hulstijn W, Meulenbroek RG, Van Galen GP. Action monitoring in motor control: ERPs following selection and execution errors in a force production task. Psychophysiology 40: 786–795, 2003. doi:10.1111/1469-8986.00079. - DOI - PubMed
    1. Desmurget M, Grafton S. Forward modeling allows feedback control for fast reaching movements. Trends Cogn Sci 4: 423–431, 2000. doi:10.1016/S1364-6613(00)01537-0. - DOI - PubMed
    1. Falkenstein M, Hohnsbein J, Hoormann J, Blanke L. Effects of crossmodal divided attention on late ERP components. II. Error processing in choice reaction tasks. Electroencephalogr Clin Neurophysiol 78: 447–455, 1991. doi:10.1016/0013-4694(91)90062-9. - DOI - PubMed
    1. Falkenstein M, Hoormann J, Christ S, Hohnsbein J. ERP components on reaction errors and their functional significance: a tutorial. Biol Psychol 51: 87–107, 2000. doi:10.1016/S0301-0511(99)00031-9. - DOI - PubMed

Publication types

LinkOut - more resources