. 2017 Jul 1;118(1):455-470.
doi: 10.1152/jn.00784.2016. Epub 2017 Apr 26.

Muscle synergies obtained from comprehensive mapping of the primary motor cortex forelimb representation using high-frequency, long-duration ICMS

Affiliations

Muscle synergies obtained from comprehensive mapping of the primary motor cortex forelimb representation using high-frequency, long-duration ICMS

Sommer L Amundsen Huffmaster et al. J Neurophysiol. .

Abstract

Simplifying neuromuscular control for movement has previously been explored by extracting muscle synergies from voluntary movement electromyography (EMG) patterns. The purpose of this study was to investigate muscle synergies represented in EMG recordings associated with direct electrical stimulation of single sites in primary motor cortex (M1). We applied single-electrode high-frequency, long-duration intracortical microstimulation (HFLD-ICMS) to the forelimb region of M1 in two rhesus macaques using parameters previously found to produce forelimb movements to stable spatial end points (90-150 Hz, 90-150 μA, 1,000-ms stimulus train lengths). To develop a comprehensive representation of cortical output, stimulation was applied systematically across the full extent of M1. We recorded EMG activity from 24 forelimb muscles together with movement kinematics. Nonnegative matrix factorization (NMF) was applied to the mean stimulus-evoked EMG, and the weighting coefficients associated with each synergy were mapped to the cortical location of the stimulating electrode. Synergies were found for three data sets including 1) all stimulated sites in the cortex, 2) a subset of sites that produced stable movement end points, and 3) EMG activity associated with voluntary reaching. Two or three synergies accounted for 90% of the overall variation in voluntary movement EMG whereas four or five synergies were needed for HFLD-ICMS-evoked EMG data sets. Maps of the weighting coefficients from the full HFLD-ICMS data set show limited regional areas of higher activation for particular synergies. Our results demonstrate fundamental NMF-based muscle synergies in the collective M1 output, but whether and how the central nervous system might coordinate movements using these synergies remains unclear.NEW & NOTEWORTHY While muscle synergies have been investigated in various muscle activity sets, it is unclear whether and how synergies may be organized in the cortex. We have investigated muscle synergies resulting from high-frequency, long-duration intracortical microstimulation (HFLD-ICMS) applied throughout M1. We compared HFLD-ICMS synergies to synergies from voluntary movement. While synergies can be identified from M1 stimulation, they are not clearly related to voluntary movement synergies and do not show an orderly topographic organization across M1.

Keywords: EMG; ICMS; motor cortex; muscle synergies; nonnegative matrix factorization.


Figures

Fig. 1.
Fig. 1.
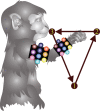
Diagram of monkey engaged in three-location reach-to-grasp task: 1, home plate lever; 2, food-well; and 3, mouth. Approximate marker cluster setup also pictured (not to scale).
Fig. 2.
Fig. 2.
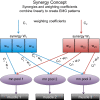
Synergy concept. Depiction of how NMF synergies would theoretically combine linearly to generate a variety of muscle activation patterns. C is the weighting coefficient vector, W is a synergy vector (with elements of w), and mn is a motoneuron. Figure modified from Ting and Macpherson (2005).
Fig. 3.
Fig. 3.
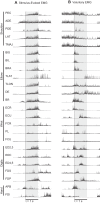
EMG activity at a single cortical site derived from HFLD-ICMS that interrupted voluntary activity to move the monkey's hand from the pellet feeder to a stable end point near the mouth (A) and voluntary movement over the same feeder-to-mouth trajectory (B). HFLD-ICMS was collected at 110 Hz and 110 µA for 1 s. starting when the hand was at the feeder. The gray shading denotes the HFLD-ICMS duration (A) and voluntary movement (B) from the feeder to the mouth approximating the same time frame and movement trajectory of the left column (HFLD-ICMS). HFLD-ICMS and voluntary movement records are averaged across five trials. All HFLD-ICMS EMG data were processed to remove stimulus artifacts. Note that our previous work has shown that HFLD-ICMS blocks natural activation of cortical output neurons and produces a pattern of muscle activation that is entirely stimulus driven (Griffin et al. 2011; Cheney et al. 2013). Therefore, it is not surprising that the detailed muscle activation patterns observed for voluntary movement (right column) and HFLD-ICMS (left column) are dissimilar, although many basic features generally match, for example, activity in elbow and shoulder flexors. For muscle abbreviations, see Table 1.
Fig. 4.
Fig. 4.
Overall variation accounted for (VAF) for the six data sets for increasing number of synergies. Monkey A’s data (“A”) is shown with circles, monkey X’s data (“X”) is shown with x’s. Data from the ALL sites data set is orange, green shows data from the sites with stable end points (END), and purple denotes data from voluntary movement (VOL). Red boxes mark the first rank to cross the 90% VAF threshold, which were designated for further analysis. Note that A VOL is derived from the fixed-target task, while X VOL is derived from the variable-target task. Note that the first crossing of the 90% threshold for the ALL and END data points for monkey X are nearly superimposed and contained in one box.
Fig. 5.
Fig. 5.
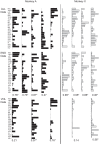
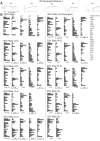
The synergies profiles shown are the 2–5 synergies needed to reach the 90% VAF threshold for each data set. Left columns, monkey A; right columns: monkey X. Synergies are from top row, ALL sites stimulated near 110 μA, 110 Hz (ALL); middle row, all sites with stable spatial end points (END); bottom row, voluntary data (VOL, including fixed-target task data for A and variable-target task for X). Synergies in the middle and bottom panels are aligned with the closest match to the ALL synergies. Pearson correlation coefficients (R) to the ALL sites data set are printed under the end point subset and the voluntary data set, synergies (*P < 0.05). The muscle order is listed on the left (*FDI was only collected for monkey A).
Fig. 6.
Fig. 6.
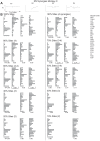
Monkey A RS (random data sets) synergy R values and profiles. A: the correlation coefficients of each percentage subset were averaged over the 20 repetitions and the mean and standard deviations are plotted vs. increasing percentage of data for each synergy. B: the synergy profiles, averaged over 20 full recalculations, shown for the minimum rank needed to achieve 90% VAF, for different percentages of M1 stimulation sites included for synergy analysis. Synergies are aligned with the closest matching synergy from the 100% ALL synergies data set. Pearson correlation coefficients (R) are given for each synergy matched to a synergy calculated from 100% of the M1 sites. The muscle order for each bar plot is given in the legend at the right. The brackets below each synergy designate that the synergy was not always present over the 20 repetitions. The titles above each synergy set show the number of synergies that were required for 90% VAF.
Fig. 7.
Fig. 7.
Monkey X RS synergy R values and profiles. Description is the same as Fig. 6.
Fig. 8.
Fig. 8.
Radial plots for stimulus-evoked synergies from ALL cortical sites (A) and VOL data compared across monkeys (B) (monkey A in the red dashed lines and monkey X in blue). ALL data synergies are from the top row of the bar plots in Fig. 5, while VOL data synergies correspond to the bottom row in Fig. 5. Synergies are arranged in each set in order of best to worst correlation. VOL data is from the fixed-target task for monkey A and the variable-target task for monkey X. C: the radial plot legend shows shades of purple designating different regions of the arm from most proximal to most distal, while muscles with higher activations are labeled on each plot. The muscles are arranged in 15° increments around a unit circle where the outermost circle has value of 1, and the dashed circles show levels of muscle activation at 0.25, 0.5, and 0.75.
Fig. 9.
Fig. 9.
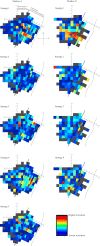
Heat maps showing the average weighting coefficients for each synergy at each cortical stimulation location for the ALL data set synergies. Coefficients were averaged over the 3–5 trials available. Synergies are ordered to match the radial plots with the best matches across monkeys being first. The legend showing the color scale from low to high activation level is at the bottom right and was normalized to the maximum weighting coefficient seen in each map.

Similar articles

Cited by

References

    1. Ajiboye AB, Weir RF. Muscle synergies as a predictive framework for the EMG patterns of new hand postures. J Neural Eng 6: 036004, 2009. doi:10.1088/1741-2560/6/3/036004. - DOI - PMC - PubMed
    1. Badeau R, Bertin N, Vincent E. Stability analysis of multiplicative update algorithms and application to nonnegative matrix factorization. IEEE Trans Neural Netw 21: 1869–1881, 2010. doi:10.1109/TNN.2010.2076831. - DOI - PubMed
    1. Bernstein NA. The Coordination and Regulation of Movement. London: Pergamon, 1967.
    1. Berry MW, Browne M, Langville AN, Pauca VP, Plemmons RJ. Algorithms and applications for approximate nonnegative matrix factorization. Comput Stat Data Anal 52: 155–173, 2007. doi:10.1016/j.csda.2006.11.006. - DOI
    1. Bonazzi L, Viaro R, Lodi E, Canto R, Bonifazzi C, Franchi G. Complex movement topography and extrinsic space representation in the rat forelimb motor cortex as defined by long-duration intracortical microstimulation. J Neurosci 33: 2097–2107, 2013. doi:10.1523/JNEUROSCI.3454-12.2013. - DOI - PMC - PubMed

Publication types

LinkOut - more resources