. 2017 Jul 1;118(1):471-485.
doi: 10.1152/jn.00789.2016. Epub 2017 Apr 26.

Temporal integration and 1/ f power scaling in a circuit model of cerebellar interneurons

Affiliations

Temporal integration and 1/ f power scaling in a circuit model of cerebellar interneurons

Reinoud Maex et al. J Neurophysiol. .

Abstract

Inhibitory interneurons interconnected via electrical and chemical (GABAA receptor) synapses form extensive circuits in several brain regions. They are thought to be involved in timing and synchronization through fast feedforward control of principal neurons. Theoretical studies have shown, however, that whereas self-inhibition does indeed reduce response duration, lateral inhibition, in contrast, may generate slow response components through a process of gradual disinhibition. Here we simulated a circuit of interneurons (stellate and basket cells) of the molecular layer of the cerebellar cortex and observed circuit time constants that could rise, depending on parameter values, to >1 s. The integration time scaled both with the strength of inhibition, vanishing completely when inhibition was blocked, and with the average connection distance, which determined the balance between lateral and self-inhibition. Electrical synapses could further enhance the integration time by limiting heterogeneity among the interneurons and by introducing a slow capacitive current. The model can explain several observations, such as the slow time course of OFF-beam inhibition, the phase lag of interneurons during vestibular rotation, or the phase lead of Purkinje cells. Interestingly, the interneuron spike trains displayed power that scaled approximately as 1/f at low frequencies. In conclusion, stellate and basket cells in cerebellar cortex, and interneuron circuits in general, may not only provide fast inhibition to principal cells but also act as temporal integrators that build a very short-term memory.NEW & NOTEWORTHY The most common function attributed to inhibitory interneurons is feedforward control of principal neurons. In many brain regions, however, the interneurons are densely interconnected via both chemical and electrical synapses but the function of this coupling is largely unknown. Based on large-scale simulations of an interneuron circuit of cerebellar cortex, we propose that this coupling enhances the integration time constant, and hence the memory trace, of the circuit.

Keywords: basket cell; cerebellum; computational model; integrator; lateral inhibition; stellate cell.


Figures

Fig. 1.
Fig. 1.
Temporal integration in a pair of reciprocally coupled inhibitory neurons (after Cannon et al. 1983). Two neurons were modeled as half-wave rectified leaky integrators (τdVi/dt = −Viw[Vj] + I ± ΔI) inhibiting each other with weight w. They received a shared input I between 20 and 80 s, on which a push-pull input ±ΔI from 40 to 60 s was superimposed (see inputs, top left). As w was varied from 0.9 to 0.999, the time constant of the response to the push-pull input increased from the neurons’ intrinsic time constant of 20 ms to 200 ms (w 0.9), 2 s (w 0.99), and 20 s (w 0.999). Meanwhile, the response to the shared input remained fast (actually, its time constant decreased from 20 ms to ~10 ms). Because the neurons would also amplify the push-pull inputs during the integration process, ΔI had to be varied as well (ΔI/I = 0.02 for w = 0.9 and 0.002 for w = 0.99 and 0.999).
Fig. 2.
Fig. 2.
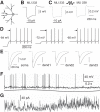
Interneuron model (A) and its responses to electrical (B–D) and synaptic (E–G) stimulation. A: MLI neuron model, with active soma and 21 passive dendritic compartments. The axon was not modeled explicitly. Black dots in secondary and tertiary dendritic compartments indicate positions of electrical synapses. B and C: voltage responses to the injection of 10-pA hyperpolarizing current into MLI 233, which was either isolated (B) or electrically coupled in the circuit (C). The isolated MLI in B and the entire 800-MLI circuit in C were kept subthreshold at −66.4 mV by having Eleak set at −65 mV. MLI 238 (C, right) was coupled to MLI 233 by two 200-pS gap junctions. D: rebound spiking in an isolated MLI from 3 different holding potentials. Arrow lengths indicate first-spike latency. Unequal spike heights are a sampling artifact. E: soma IPSPs after activation of GABAAR synapses on the soma, or a primary (dend1), secondary (dend2), or tertiary (dend3) dendritic compartment, for both isolated MLIs (black traces) and MLIs embedded in a circuit (gray traces). F and G: traces of the somatic membrane potential (F) and the GABAAR-generated current (G) for MLI 447 during the first cycle of a sinusoidal PF stimulation protocol. In G, MLI 447 had its soma voltage-clamped at −50 mV and its PF input blocked; resting and junctional currents were subtracted.
Fig. 3.
Fig. 3.
The MLI circuit and its connection kernels. For visualization, the circuit is projected on a sagittal (A) or frontal (B) plane. Open circles and filled diamonds, bottom, indicate the positions of the somata of MLIs with caudally and rostrally projecting axons, respectively. In A only half of the length of the circuit is shown. Top panels, vertically offset for clarity, show MLI 212 with the skeleton of its dendrite and the 51 boutons (synapses) on its virtual axon; its soma is located at the black circle in bottom rasters. Note that the circuit was constructed by first positioning the somata at the vertices of a regular hexagonal grid and then shifting randomly their positions, along each of the 3 dimensions, over distances of maximally half the grid edge. The connectivity kernel generating the axonal boutons consisted of 2 Gaussian ellipsoids positioned at 40 and 160 μm from the soma, with semiaxes measuring (60, 60, 60) μm and (40, 100, 60) μm along the (PF, sagittal, radial) dimensions. The proximal and distal kernels had relative connection probabilities of 0.5 and 1.5, respectively.
Fig. 4.
Fig. 4.
Responses of the interneuron circuit to sine-wave stimulation of a narrow PF beam. A: raster plot of spikes fired over 10 stimulus cycles by the subpopulation of 400 MLIs with caudally projecting axons. The almost indistinguishable raster plot of the 400 rostrally projecting MLIs is not shown for clarity. The MLIs are ranked vertically by their position along the sagittal axis. B: spike-rate time histograms of the PF beam (averaged over its 141 constituent PFs) and of subpopulations of 20 ON-beam MLIs (receiving monosynaptic excitation, positioned at black rectangle in A) and 20 OFF-beam MLIs (receiving disynaptic inhibition, gray rectangle in A). C: histograms averaged over 100 cycles of the 2,048-ms period. Bin width 16 ms in B and C. D: polar response plot for each of the 20 ON-beam and 20 OFF-beam MLIs from B and C. Response amplitude is distance to the origin (as spike rate). Response phase is the angle of rotation with respect to the PF input located on the y-axis (black diamond). Counterclockwise rotation indicates phase lag. Black squares are average vectors. E: polar responses for the entire population of 800 MLIs. Gray square is the average population vector after rectification (see materials and methods). Axes in D and E measure spike rate (s−1).
Fig. 5.
Fig. 5.
Integration times and spiking dynamics vary with the strength of inhibition. A: response amplitude (solid lines, left y-axis), and response phase expressed as integration time (broken lines, right y-axis), calculated from the polar responses of the same subpopulations of 20 ON-beam and 20 OFF-beam MLIs as illustrated in Fig. 4, B–D, but for varying strengths of inhibition in the circuit. B: mean spike rate ± SD (solid line, left y-axis) and CV2 of the interspike interval (dashed line, right y-axis) averaged across all 800 MLIs. C: effect of varying the level of PF excitation. Each graph plots the mean integration time over the entire circuit (calculated from the population vector, see gray square in Fig. 4E) for a different PF spike rate (increasing from left to right as indicated at top). The resulting MLI spike rate is plotted on x-axis. Within each graph the level of inhibition was varied so as to assess its optimal value, which measured ~100% (PF rate > 40 s−1), 80% (40 s−1), 66% (10–25 s−1), or 400% (2 and 5 s−1).
Fig. 6.
Fig. 6.
Integration time critically depends on the connection distance (A) but not on the fraction of autapses (B) or the circuit length (C). A: each data point plots the integration time of a different MLI circuit as measured from the anticlockwise rotation of its population vector (as in Fig. 4E). The connection distance (x-axis) was measured as the average sagittal distance between the soma of the afferent MLI and the postsynaptic compartment of the efferent MLI, averaged over all MLI-MLI connections in the circuit. Different instantiations of the circuit were generated by varying the spacing of MLIs, the connection kernel, the connection probability, or the strength of inhibition. Black data points are from circuits of MLIs lacking the CaT channel (see materials and methods); triangles denote circuits with 40-μm instead of 20-μm inter-MLI spacing. Gray circle represents the standard version of the circuit model. Diamond and horizontal line give mean and SD across sample of 26 MLIs in Sultan and Bower (1998). Insets: dendritic trees and axonal boutons of representative caudally and rostrally projecting MLIs in circuits with mean connection lengths of 40 μm and 131 μm, respectively. The corresponding connection kernels were as described in legend of Fig. 2, except that both kernels were centered at 40 μm for the MLI with the shorter connection distance. B: same data points as in A plotted against the fraction of MLIs making autapses. C: polar responses of a circuit of 1,600 MLIs of twice the sagittal length of the standard circuit. For clarity, MLI responses were lumped into 80 groups of 20 MLIs. The sinusoidal stimulus was conveyed by 3 PF beams 400 μm apart. The PF spike rate was 40 s−1 and the strength of inhibition 80% (which were about the optimal parameter values according to Fig. 5C). Oblique lines of constant phase are labeled by the corresponding integration time constants in seconds. Gray square indicates population average after rectification. Axes have units of spike rate (s−1).
Fig. 7.
Fig. 7.
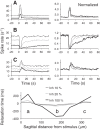
Pulse stimulation of a PF beam produces slow OFF-beam inhibition. The stimulus was a 50-ms jump in PF spike rate (from 10 to 500 s−1) of a narrow PF beam (see materials and methods). Response histograms at left plot average spike rate over 20 MLIs located either close to the center of the beam (A) or at sagittal distances of 173 and 311 μm (B and C) (bin width 10 ms; average of 200 trials). Histograms at right were normalized over the mean spike rate during the 200-ms prestimulus interval. The circuit had either full-blown inhibition (100%) or inhibition reduced to 20% or 10% as indicated. Relaxation time at bottom was calculated as the interval to 1/e recovery; negative relaxation times indicate recovery from troughs.
Fig. 8.
Fig. 8.
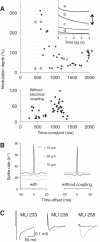
Electrical synapses enhance the integration time but have no effect on synchronization. A: Simulations of the same circuit as in Fig. 4 but in the absence of a PF beam: all PFs fired at a stationary Poisson rate of 10 s−1. Data points plot the time constant and modulation depth of the autocorrelogram for each of 40 subpopulations of 20 MLIs. Inset: 1-sided autocorrelograms (bin width 1 ms) for 4 labeled subpopulations (gray traces) along with their best-fitting exponentials (black). Modulation depth was calculated as % peak height above baseline (arrow). Central peaks in inset are truncated. Bottom: the same data for the electrically uncoupled circuit. B: comparison of synchronization in the coupled (left) and uncoupled (right) circuit. The spike trains from the subpopulation of 20 MLIs labeled a in A were cross-correlated either among each other (black trace) or with MLIs on average 35 and 70 μm apart (gray trace). C: details of electrical transmission. An action potential (evoked in MLI 233) spreads to MLIs 238 and 258 via mono- and disynaptic electrical connections (black traces). Same circuit organization as for Fig. 2B, with all MLIs held subthreshold at −61 mV.
Fig. 9.
Fig. 9.
Spectral analysis of spike trains reveals 1/f scaling at low frequencies. Analysis of the circuit of Fig. 8A, with either full-strength inhibition (A–C) or inhibition of varying strengths compared (D–F). Power spectra were calculated from the spike-train histograms collected for each of the 40 subpopulations of 20 MLIs, using bin widths of 1 ms and Hann filtering in sliding windows of 4,096-ms length. A and D: population data of the power-law exponent vs. mean spike rate. y-Axis plots exponent of best-fitting power function within the 0.5–15 Hz domain (slope of straight lines in C and F). B and E: log-log spectrograms (in arbitrary units) for subpopulations labeled a–d (B) and for subpopulation c at varying levels of inhibition (E). C and F: log-log spectrograms from B and E restricted to the low-frequency domain (gray) with fitted power functions (black). In C and F traces are offset for clarity.
Fig. 10.
Fig. 10.
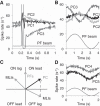
Various response types of model PCs receiving PF excitation and MLI inhibition. The model PC had a reduced dendritic tree with an average of 227 PF and 152 MLI synapses. A: responses to a 50-ms PF pulse as in Fig. 7. Truncated PF pulse peaks at 150 spikes/s. B: phase-lagged responses of the same PCs to 0.25 Hz sine-wave modulation of the PF beam. C: diagram explaining how vector summation of the PF input (gray arrow on y-axis) and the OFF-beam MLI response (gray arrow to bottom right quadrant) may generate a PC response that leads the PFs. D: phase-leading responses of 2 model PCs receiving twice the strength of PF input. PC responses averaged over 800 (A) or 200 (B and D) trials.

Similar articles

Cited by

References

    1. Abrahamsson T, Cathala L, Matsui K, Shigemoto R, Digregorio DA. Thin dendrites of cerebellar interneurons confer sublinear synaptic integration and a gradient of short-term plasticity. Neuron 73: 1159–1172, 2012. doi:10.1016/j.neuron.2012.01.027. - DOI - PubMed
    1. Abrams ZR, Warrier A, Wang Y, Trauner D, Zhang X. Tunable oscillations in the Purkinje neuron. Phys Rev E Stat Nonlin Soft Matter Phys 85: 041905, 2012. doi:10.1103/PhysRevE.85.041905. - DOI - PubMed
    1. Alcami P, Marty A. Estimating functional connectivity in an electrically coupled interneuron network. Proc Natl Acad Sci USA 110: E4798–E4807, 2013. doi:10.1073/pnas.1310983110. - DOI - PMC - PubMed
    1. Andersen P, Eccles JC, Voorhoeve PE. Postsynaptic inhibition of cerebellar Purkinje cells. J Neurophysiol 27: 1138–1153, 1964. - PubMed
    1. Anderson D, Mehaffey WH, Iftinca M, Rehak R, Engbers JD, Hameed S, Zamponi GW, Turner RW. Regulation of neuronal activity by Cav3-Kv4 channel signaling complexes. Nat Neurosci 13: 333–337, 2010. doi:10.1038/nn.2493. - DOI - PubMed

Publication types

LinkOut - more resources