. 2017 Aug 1;118(2):717-731.
doi: 10.1152/jn.00899.2016. Epub 2017 Apr 26.

Hierarchical differences in population coding within auditory cortex

Affiliations

Hierarchical differences in population coding within auditory cortex

Joshua D Downer et al. J Neurophysiol. .

Abstract

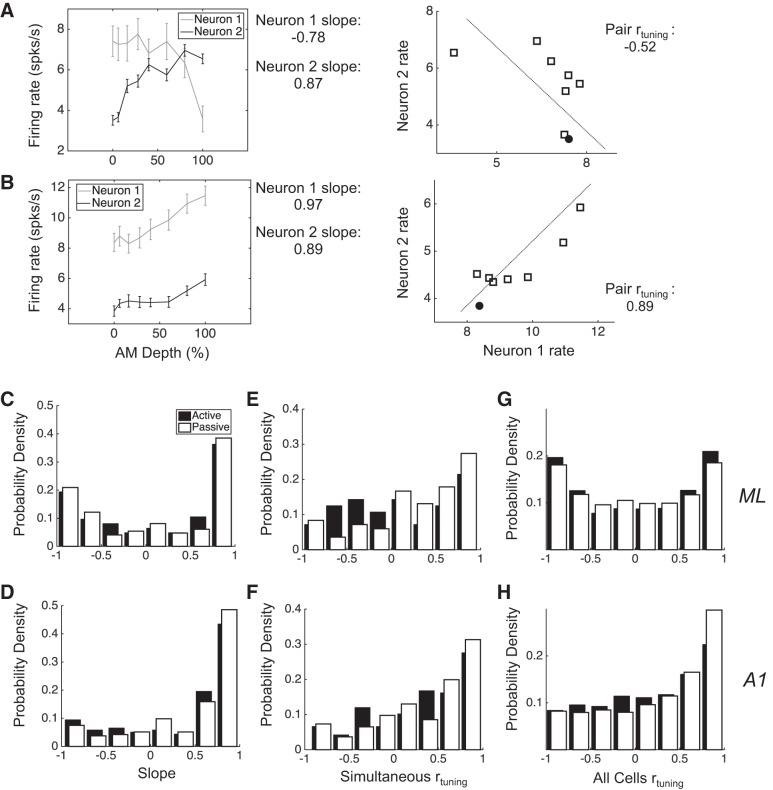
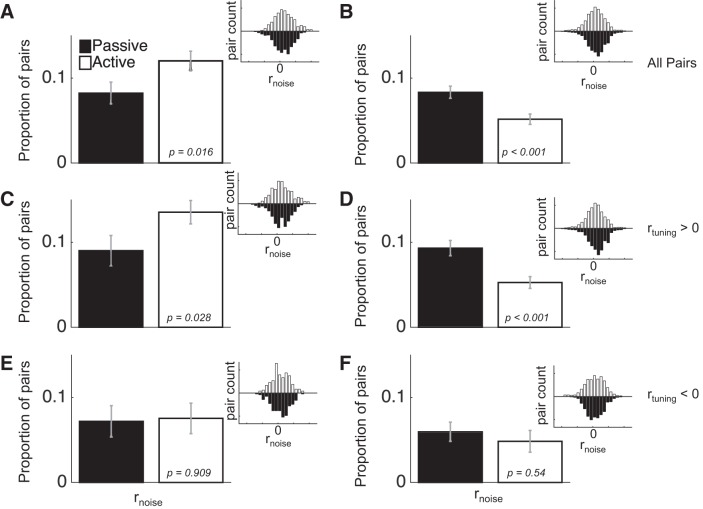
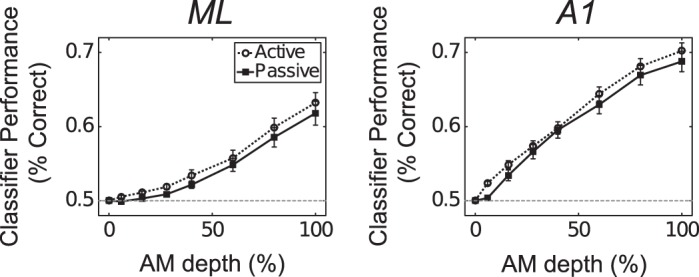
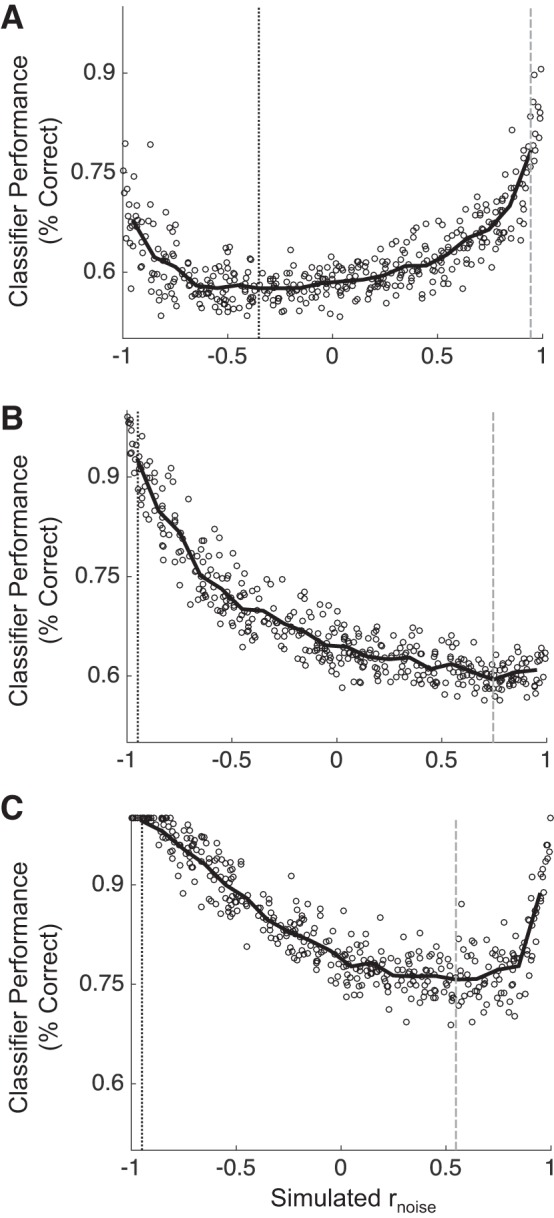
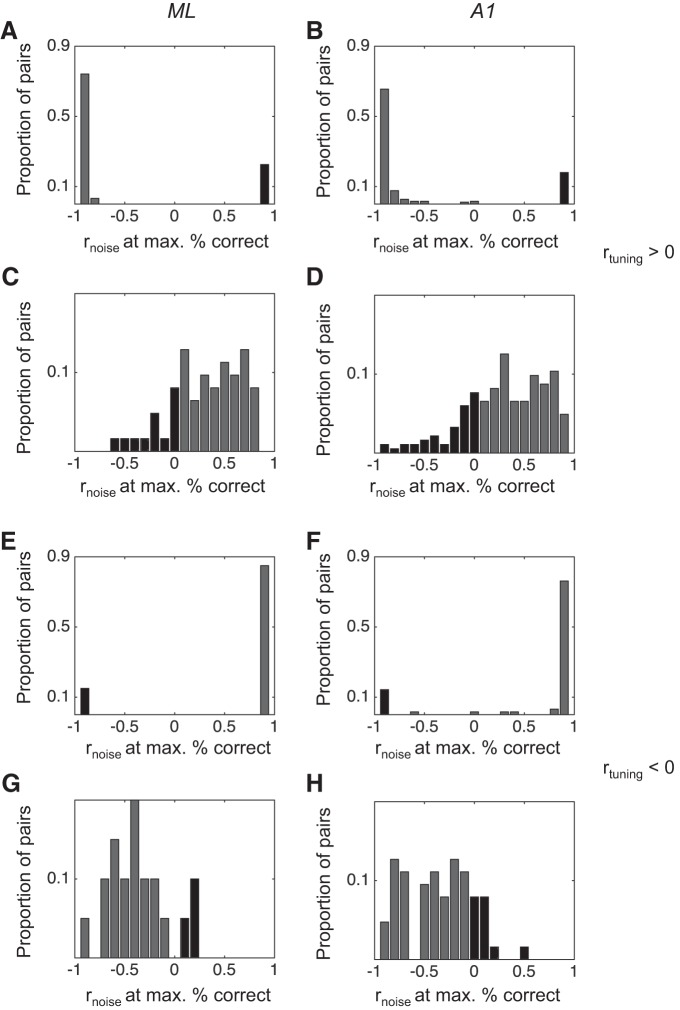
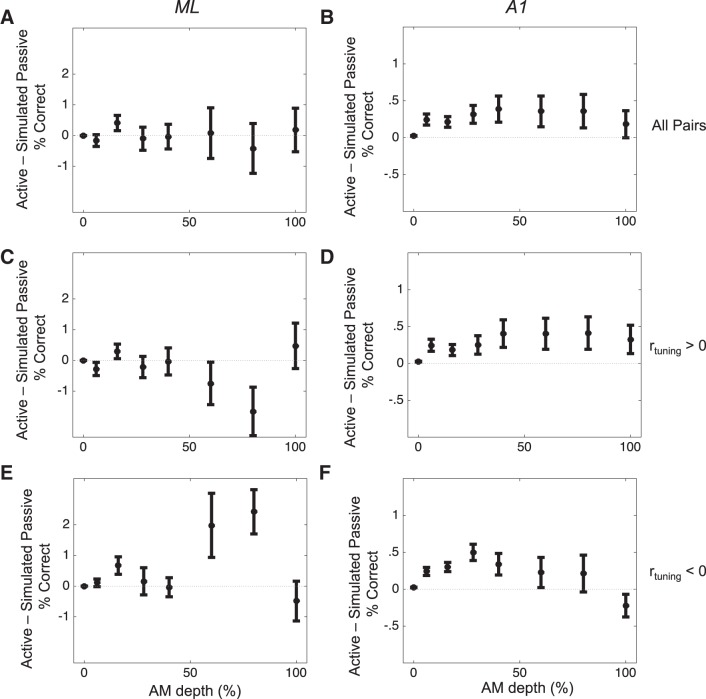
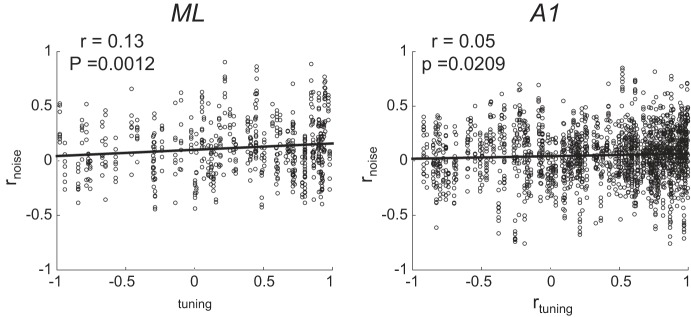
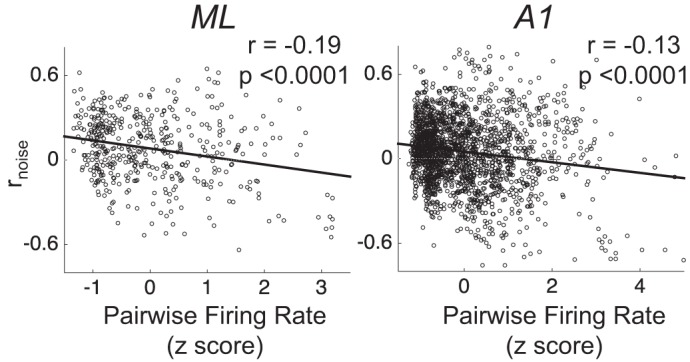
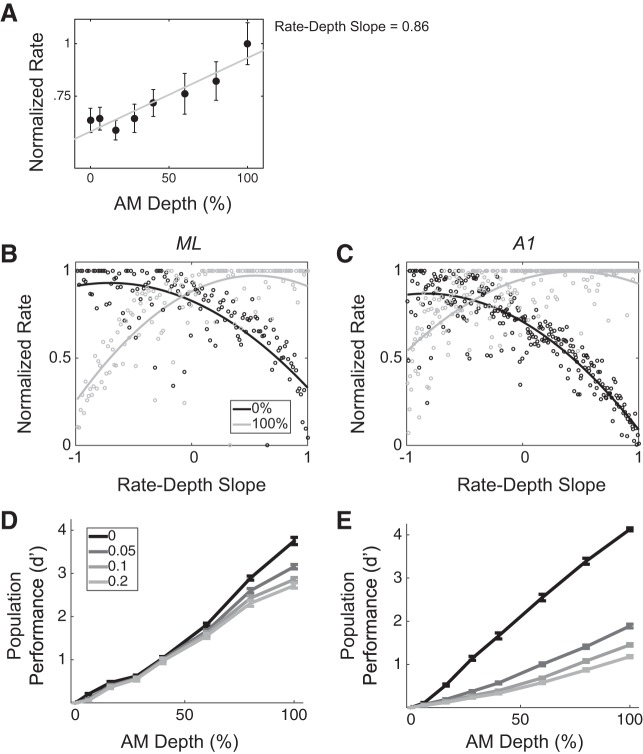
Most models of auditory cortical (AC) population coding have focused on primary auditory cortex (A1). Thus our understanding of how neural coding for sounds progresses along the cortical hierarchy remains obscure. To illuminate this, we recorded from two AC fields: A1 and middle lateral belt (ML) of rhesus macaques. We presented amplitude-modulated (AM) noise during both passive listening and while the animals performed an AM detection task ("active" condition). In both fields, neurons exhibit monotonic AM-depth tuning, with A1 neurons mostly exhibiting increasing rate-depth functions and ML neurons approximately evenly distributed between increasing and decreasing functions. We measured noise correlation (rnoise) between simultaneously recorded neurons and found that whereas engagement decreased average rnoise in A1, engagement increased average rnoise in ML. This finding surprised us, because attentive states are commonly reported to decrease average rnoise We analyzed the effect of rnoise on AM coding in both A1 and ML and found that whereas engagement-related shifts in rnoise in A1 enhance AM coding, rnoise shifts in ML have little effect. These results imply that the effect of rnoise differs between sensory areas, based on the distribution of tuning properties among the neurons within each population. A possible explanation of this is that higher areas need to encode nonsensory variables (e.g., attention, choice, and motor preparation), which impart common noise, thus increasing rnoise Therefore, the hierarchical emergence of rnoise-robust population coding (e.g., as we observed in ML) enhances the ability of sensory cortex to integrate cognitive and sensory information without a loss of sensory fidelity.NEW & NOTEWORTHY Prevailing models of population coding of sensory information are based on a limited subset of neural structures. An important and under-explored question in neuroscience is how distinct areas of sensory cortex differ in their population coding strategies. In this study, we compared population coding between primary and secondary auditory cortex. Our findings demonstrate striking differences between the two areas and highlight the importance of considering the diversity of neural structures as we develop models of population coding.

Keywords: amplitude modulation; attention; auditory cortex; belt; noise correlation.


Figures

Fig. 1.
Fig. 1.
Different AM tuning properties in A1 and ML lead to different rtuning distributions. A, left: shown are the firing rates along the range of tested AM depths for 2 simultaneously recorded ML neurons, with their rate-depth slopes noted at right. Right panel shows their joint mean firing rate distribution and the rtuning value between them. This value is negative because as the mean firing rate of neuron 1 decreases, the mean firing rate of neuron 2 increases. B: same as in A but for a pair with positive rtuning. C and D: the distribution of slopes in ML has 2 peaks, corresponding to distinct populations of neurons with increasing and decreasing rate-depth slopes, respectively, whereas the distribution in A1 has 1 peak and favors increasing slopes. E and F: the rtuning of simultaneously recorded pairs in ML and A1 (simultaneous rtuning) reveals a greater proportion of pairs with negative rtuning in ML. G and H: rtuning is calculated between all recorded neurons (all cells rtuning), showing that the rtuning distribution has 2 peaks in ML and 1 positive peak in A1. Error bars are SE.
Fig. 2.
Fig. 2.
Task engagement differentially affects rnoise in ML and A1. A and B: during task engagement (active; open bars), rnoise on average goes up in ML (A) but goes down in A1 (B). These effects, in both A1 and ML, hold primarily for pairs with positive rtuning (C and D), whereas task engagement does not significantly impact rnoise in pairs with negative rtuning (E and F). Inset histograms show the distribution of rnoise values across the pairs used for each comparison. Error bars are SE.
Fig. 3.
Fig. 3.
In both ML (A) and A1 (B), pairs classify sounds better in the active condition (open circles) relative to the passive condition (filled squares).
Fig. 4.
Fig. 4.
Classifier performance in 3 example pairs over a range of simulated rnoise values. rnoise was varied from −1 to 1 measure classifier performance for each simulation. The pairs in A and C show striking nonmonotonicity in their relationships between rnoise and classifier performance. The pair in B, on the other hand, shows a monotonic relationship. Gray vertical lines show rnoise at maximum performance, and black vertical lines show rnoise at minimum performance.
Fig. 5.
Fig. 5.
Distributions of rnoise values corresponding to pairs’ best (max) and worst (min) classifier performance in ML and A1. For pairs that violate the SR, rnoise at maximum performance will be at a value that is the same sign as the rtuning value, and/or rnoise at minimum will have the opposite sign as rtuning. These distributions are not distinct between ML and A1, suggesting that pairwise violations of the SR do not contribute to a different role for rnoise in sensory coding between ML and A1. Dark shaded bars indicate pairs that violate the SR.
Fig. 6.
Fig. 6.
Task-related changes in rnoise enhance coding in A1, not in ML. Values above 0 indicate that rnoise in the active condition uniquely brings about an improvement in pairwise performance. rnoise changes in ML (A) do not uniquely contribute to the observed increase in pairwise performance shown in Fig. 3. However, in A1 (B), rnoise does make a contribution to increased coding accuracy. In ML (C and E), task-related rnoise effects do not contribute to average performance differences in either the positive (C) or negative (E) rtuning groups. However, at AM depths of 60 and 80%, rnoise contributes to decreased (C) or increased (E) performance, in pairs with positive or negative rtuning, respectively. In A1 (D and F), task-related rnoise effects appear to enhance sensory coding across both rtuning categories.
Fig. 7.
Fig. 7.
In both ML and A1, rtuning and rnoise are positively correlated. We incorporate this relationship in our simulations of rnoise across modeled neural populations. Note that each pair contributes 8 points to the plot (1 point per stimulus condition).
Fig. 8.
Fig. 8.
In both ML and A1, pairwise firing rate and rnoise are negatively correlated. As in Fig. 7, each pair contributes 8 points (1 per stimulus condition) to this plot. Firing rates are z-scored within each pair, across stimulus conditions. We also incorporate this relationship in our simulations of rnoise across modeled neural populations.
Fig. 9.
Fig. 9.
ML and A1 modeled populations are differentially affected by rnoise. A: an example neuron’s normalized firing rate and slope. B and C: 2 example instantiations of modeled populations of size n = 100 neurons. Populations are modeled as arrays of tuned filters, with neurons arranged according to AM slope (from most negative to most positive). Population mean responses to each stimulus are fit with 3rd-order polynomial least-squares curves (solid lines). Each data point represent the mean (maximum normalized) response of one neuron to one stimulus (black for 0% AM and gray for 100% AM). D and E: in populations of n = 100 neurons, across 400 simulated trials per simulated rnoise, average classifier performance was obtained at each AM depth in ML and A1. Whereas ML is modestly affected by rnoise, and only at higher AM depths, A1 performance is dramatically reduced for weakly positive rnoise values at each depth other than 6%.

Similar articles

Cited by

References

    1. Abbott LF, Dayan P. The effect of correlated variability on the accuracy of a population code. Neural Comput 11: 91–101, 1999. doi:10.1162/089976699300016827. - DOI - PubMed
    1. Averbeck BB, Latham PE, Pouget A. Neural correlations, population coding and computation. Nat Rev Neurosci 7: 358–366, 2006. doi:10.1038/nrn1888. - DOI - PubMed
    1. Bendor D, Wang X. Neural response properties of primary, rostral, and rostrotemporal core fields in the auditory cortex of marmoset monkeys. J Neurophysiol 100: 888–906, 2008. doi:10.1152/jn.00884.2007. - DOI - PMC - PubMed
    1. Bizley JK, Walker KM, Nodal FR, King AJ, Schnupp JW. Auditory cortex represents both pitch judgments and the corresponding acoustic cues. Curr Biol 23: 620–625, 2013. doi:10.1016/j.cub.2013.03.003. - DOI - PMC - PubMed
    1. Britten KH, Shadlen MN, Newsome WT, Movshon JA. The analysis of visual motion: a comparison of neuronal and psychophysical performance. J Neurosci 12: 4745–4765, 1992. - PMC - PubMed

Publication types

LinkOut - more resources