. 2017 Aug;31(8):3540-3554.
doi: 10.1096/fj.201700010R. Epub 2017 Apr 26.

Bim gene dosage is critical in modulating nephron progenitor survival in the absence of microRNAs during kidney development

Affiliations

Bim gene dosage is critical in modulating nephron progenitor survival in the absence of microRNAs during kidney development

Débora M Cerqueira et al. FASEB J. 2017 Aug.

Abstract

Low nephron endowment at birth has been associated with an increased risk for developing hypertension and chronic kidney disease. We demonstrated in an earlier study that conditional deletion of the microRNA (miRNA)-processing enzyme Dicer from nephron progenitors results in premature depletion of the progenitors and increased expression of the proapoptotic protein Bim (also known as Bcl-2L11). In this study, we generated a compound mouse model with conditional deletion of both Dicer and Bim, to determine the biologic significance of increased Bim expression in Dicer-deficient nephron progenitors. The loss of Bim partially restored the number of nephron progenitors and improved nephron formation. The number of progenitors undergoing apoptosis was significantly reduced in kidneys with loss of a single allele, or both alleles, of Bim compared to mutant kidneys. Furthermore, 2 miRNAs expressed in nephron progenitors (miR-17 and miR-106b) regulated Bim levels in vitro and in vivo Together, these data suggest that miRNA-mediated regulation of Bim controls nephron progenitor survival during nephrogenesis, as one potential means of regulating nephron endowment.-Cerqueira, D. M., Bodnar, A. J., Phua, Y. L., Freer, R., Hemker, S. L., Walensky, L. D., Hukriede, N. A., Ho, J. Bim gene dosage is critical in modulating nephron progenitor survival in the absence of microRNAs during kidney development.

Keywords: Bcl-2L11; Dicer; apoptosis; metanephros; nephrogenesis.


Figures

Figure 1.
Figure 1.
Loss of Bim in nephron progenitors results in decreased Bim expression in Six2-TGCTg/+, Dicerflx/flx nephron progenitors. A) PCR genotyping showing Dicer wild type (Wt) (350 bp), Dicerflx (400 bp), Bim Wt (250 bp), and Bimflx (300 bp) alleles. B) qPCR analysis demonstrating reduced expression of Dicer exon 24 in mutant (Six2-TGCTg/+, Bim+/+, Dicerflx/flx), heterozygous rescue (Six2-TGCTg/+, Bimflx/+, Dicerflx/flx) and homozygous rescue (Six2-TGCTg/+, Bimflx/flx, Dicerflx/flx), when compared to control (Six2-TGCTg/+, Bim+/+, Dicer+/+) kidneys. There was no statistically significant difference between these 4 genotypes for Dicer exon 21, an internal control (n = 3 embryos per genotype derived from 3 litters). Error bars ± sem. **P ≤ 0.01 (1-way ANOVA with Tukey’s post hoc test). CF) Immunostaining on P0 kidney sections demonstrate that Bim expression is increased in nephron progenitors of mutant kidneys (D) and decreased in heterozygous rescue (E) and homozygous rescue (F) nephron progenitors, compared to control (C). Images shown are representative of 3 independent experiments (n ≥ 3 embryos per genotype derived from at least 3 litters). Scale bar, 50 μm. G) Western blot analysis comparing the levels of the Bim isoforms (BimEL, BimL, and BimS) and Bcl-2 in P0 kidneys from control, mutant, heterozygous rescue, and homozygous rescue mice. The expression of BimEL was decreased in homozygous rescue kidneys, confirming the efficiency of Cre-mediated Bim deletion. GAPDH was used as a loading control.
Figure 2.
Figure 2.
Loss of Bim function results in a partial rescue of the defects in nephron formation in mice that lack Dicer in nephron progenitors. AD) H&E staining of P0 kidney sections from control (A), mutant (B), homozygous rescue (C), and heterozygous rescue (D) kidneys demonstrate fewer developing nephron structures and glomeruli in mutant kidneys (B) compared to controls (A). In contrast, heterozygous (C) or homozygous (D) loss of Bim function results in a partial rescue of the phenotype, with an increased number of developing nephron structures and glomeruli. Black arrows: glomeruli. EH) Immunostaining of P0 kidneys from control (E), mutant (F), homozygous rescue (G), and heterozygous rescue (H) mice for WT1 expression. Red arrows: glomeruli. Images shown are representative of 3 independent experiments (n ≥ 3 embryos per genotype derived from at least 3 litters). Scale bars, 100 μm. I) Stereological quantification of glomerular number demonstrates that mutant kidneys exhibit a decreased number of glomeruli when compared to control, and the loss of Bim partially restores the number of these structures in Dicer-deficient kidneys (n = 4 embryos per genotype derived from at least 3 litters). J) Kidney length is significantly smaller in mutant, heterozygous and homozygous rescue kidneys at P0 when compared to control (Six2-TGCTg/+, Bim+/+, Dicerflx/+) kidneys. However, both heterozygous and homozygous rescue kidneys are intermediate in size between control and mutant kidneys, and rescue kidneys are significantly longer than mutant kidneys (n ≥ 14 embryos per genotype derived from at least 10 litters). K) There was no statistically significant difference between any of the genotypes in crown–rump length (n ≥ 7 embryos per genotype derived from at least 4 litters). Error bars ± sem. N.s., nonsignificant. *P ≤ 0.05, **P ≤ 0.01, ***P ≤ 0.001, ****P ≤ 0.0001 (1-way ANOVA with Tukey’s post hoc test).
Figure 3.
Figure 3.
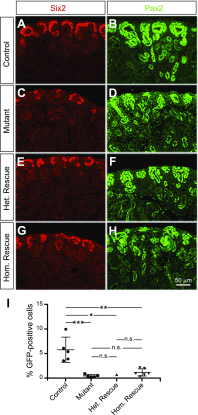
Decreased Bim expression in nephron progenitors of Six2-TGC Tg/+; Dicerflx/flx kidneys partially rescues depletion of nephron progenitors in mutant kidneys. A–H) Immunofluorescence was performed on control (A, B), mutant (C, D), heterozygous rescue (E, F), and homozygous rescue (G, H) P0 kidneys. Staining with Six2 (red; A, C, E, G) and Pax2 (green; B, D, F, H) revealed improved progenitor capping around the ureteric tips in heterozygous and homozygous rescue kidneys when compared to mutant kidneys. Notably, the few forming nephrons in mutant kidneys appear dysplastic. Pax2 also labels ureteric bud and collecting duct. Images shown are representative of 3 independent experiments (n = 3 embryos per genotype derived from 3 litters). Scale bar, 50 μm. I) Quantification of GFP+ cells sorted by fluorescence-activated cell sorting demonstrated a dramatic reduction in the percentage of nephron progenitors in mutant kidneys (∼0.46%) when compared to control kidneys (∼5.79%). The percentage of nephron progenitors in heterozygous rescue and homozygous rescue kidneys was ∼0.75% and 1.18%, respectively (n = 5 embryos per genotype derived from 3 litters, except for heterozygous rescue, from 1 litter). Error bars ± sem. N.s., nonsignificant. *P ≤ 0.05, **P ≤ 0.01, ***P ≤ 0.001 (1-way ANOVA with Tukey’s post hoc test).
Figure 4.
Figure 4.
Decreased Bim activity partially restores the number of early epithelial structures in Six2-TGCTg/+;Dicerflx/flx kidneys. AH) Early epithelial derivatives of nephron progenitors were detected in kidney sections from P0 control (A, B), mutant (C, D), homozygous rescue (E, F) and heterozygous rescue (G, H) mice using immunostaining for Jagged1 (red; A, C, E, G) and NCAM (green; B, D, F, H). NCAM expression also marks nephron progenitors and the renal interstitium. White arrows: early developing nephrons. Images are representative of 3 independent experiments (n = 3 embryos per genotype derived from 3 litters). Scale bar, 50 μm. I) Semiquantitative analysis of the number of Jagged1+ structures demonstrated that mutant kidneys exhibited only a few developing nephrons, compared to control kidneys. An intermediate number of early epithelial structures was observed in heterozygous and homozygous rescue kidneys. The number of Jagged1+ structures was calculated by using 10 digital images per kidney (n = 3 embryos per genotype derived from 3 litters). Error bars ± sem. N.s., nonsignificant. *P ≤ 0.05, **P ≤ 0.01 (1-way ANOVA with Tukey’s post hoc test). J) Western blot analysis comparing the levels of the Jagged1 in P0 kidneys from control, mutant, heterozygous rescue and homozygous rescue mice. GAPDH was used as a loading control. K) Densitometric analyses of the bands on the Western blot shown in J. The relative levels of Jagged1 were calculated by normalizing with GAPDH.
Figure 5.
Figure 5.
Increased Bim activity is sufficient to induce apoptosis in nephron progenitors, whereas decreased Bim expression reduces apoptosis in nephron progenitors. A) Sequences of the murine BIM SAHBA1 peptide and its R153D mutant control. BD) TUNEL assay (green) followed by immunostaining for the nephron progenitor marker, Six2 (red) and the ureteric bud marker calbindin (blue) in E12.5 wild-type kidney explants. Increased apoptotic Six2+/TUNEL+ double-positive cells were observed in kidneys explants treated with 4.8 μM of BIM SAHBA1 peptide (C), when compared to those treated with the vehicle (0.48% DMSO) (B) or 4.8 μM of the mutant control peptide, BIM SAHBA1 R153D (D). EJ) Immunofluorescence of kidney sections from P0 control, mutant, and homozygous rescue mice for Six2 (red). Apoptotic (EG) and proliferating (H–J) cells were detected with TUNEL assay (green) and anti-pHH3 antibody (green), respectively. Images are representative of 3 independent experiments (n = 3 embryos per genotype derived from at least 3 litters). Scale bars, 25 μm. K) Quantification of the Six2+/TUNEL+ double-positive cells demonstrated an increased number of nephron progenitors undergoing apoptosis in mutant kidneys compared to control kidneys. The loss of Bim significantly reduces apoptosis in homozygous rescue kidneys. L) Quantification of the Six2+/pHH3+ double-positive cells demonstrated no significant difference in the number of proliferating nephron progenitors between the 3 genotypes. Numbers across 8 images per kidney (n = 3 embryos per genotype derived from at least 3 litters) were summed, and the percentage of Six2+/TUNEL+ and Six2+/pHH3+ cells was calculated. Error bars ± sem. N.s., nonsignificant. *P ≤ 0.05 (1-way ANOVA with Tukey’s post hoc test).
Figure 6.
Figure 6.
miR-24-1, miR-17, miR-106b, and miR-10a repress the expression of Bim in vitro and in vivo. A) Schematic of the pmiRGLO-Bim 3′-UTR luciferase reporter vector containing the mouse Bim 3′-UTR. Potential miRNA binding sites predicted by in silico analyses are represented by vertical bars. Blue: predicted binding sites for miR-24-1, miR-17, miR-106b, and miR-10a. Luciferase reporter assays performed in HEK 293 cells transfected with pmiRGLO-Bim 3′-UTR in the presence of Dicer shRNA and miRNA mimics (miR-24-1, miR-17, miR-106b, and miR-10a). There was a reduction of ∼10, 11, and 18% in luciferase activity in the presence of miR-24-1, miR-17, and miR-106b, respectively. No significant change in luciferase activity was observed in the presence of miR-10a mimic (n = 3 independent experiments). Error bars ± sem. N.s., nonsignificant. *P ≤ 0.05, **P ≤ 0.01, ***P ≤ 0.001 (1-way ANOVA with Turkey’s post hoc test). B) Western blot analysis comparing Bim levels in protein extracts of HEK 293 cells transfected with either shRNA control or Dicer shRNA, in the presence of miRNA mimics. The miR-24-1, miR-17, miR-106b, and miR-10a mimics decreased the expression of BimEL. GAPDH was used as a loading control. C) Densitometric analyses of the bands on the Western blot shown in (B). The relative levels of BimEL were calculated by normalizing with GAPDH. DK) Xenopus laevis embryos were microinjected with a synthetic full-length Bim 3′-UTR fused to the EGFP reporter gene, in the presence or absence of pri-mmu-miR-24-1, pri-mmu-miR-17, pri-mmu-miR-106b, or pri-mmu-miR-10a. D) EGFP expression was assessed at stage 10. E–K) Representative images (EJ) and the quantification (K) of 3 independent experiments are shown. The total number of embryos analyzed is indicated above the individual bars. L) qPCR analysis demonstrating the levels of mature miRNAs (mmu-miR-24-1, mmu-miR-17, mmu-miR-106b, and mmu-miR-10a) in embryos injected with the primary transcripts, pri-mmu-miR-24-1, pri-mmu-miR-17, pri-mmu-miR-106b, and pri-mmu-miR-10a (n = 3 biologic replicates per condition from 3 independent experiments. Each replicate represented 4 embryos that were pooled). Error bars ± sem. N.s., nonsignificant. *P ≤ 0.05, **P ≤ 0.01 (Student’s unpaired Student’s t test).
Figure 7.
Figure 7.
Proposed model for Bim function in nephron progenitors during kidney development. AC) In control kidneys, nephron progenitors (red) form a cap of cells surrounding the ureteric bud tips (blue) (A); whereas in mutant kidneys, the deletion of Dicer from nephron progenitors results in premature ablation of this cell population (B). The loss of Bim partially restores the number of progenitors in Dicer-deficient kidneys (C). A′–C′) Pre-miRNAs are cleaved by Dicer to produce mature miRNAs. Mature miRNAs recognize specific binding sites on the 3′-UTR of the Bim mRNA, recruit the RNA-induced silencing complex (RISC), causing either Bim mRNA degradation or its translational repression. During kidney development, low Bim levels in nephron progenitors allow this cell population to be maintained (A′). In mutant kidneys, the absence of Dicer impairs the formation of mature miRNAs, resulting in increased Bim expression, and nephron progenitors preferentially undergo apoptosis (B′). In heterozygous rescue and homozygous rescue kidneys, nephron progenitors lacking mature miRNAs also display reduced or absent expression of Bim mRNA, which in turn favors cell survival (C′).

Similar articles

Cited by

References

    1. Vize P. D., Woolf A. S., Bard J. (2003) The Kidney: From Normal Development to Congenital Disease, Academic, Amsterdam/London
    1. Lechner M. S., Dressler G. R. (1997) The molecular basis of embryonic kidney development. Mech. Dev. 62, 105–120 - PubMed
    1. Saxén L., Sariola H. (1987) Early organogenesis of the kidney. Pediatr. Nephrol. 1, 385–392 - PubMed
    1. Dressler G. R. (2009) Advances in early kidney specification, development and patterning. Development 136, 3863–3874 - PMC - PubMed
    1. Hinchliffe S. A., Sargent P. H., Howard C. V., Chan Y. F., van Velzen D. (1991) Human intrauterine renal growth expressed in absolute number of glomeruli assessed by the disector method and Cavalieri principle. Lab. Invest. 64, 777–784 - PubMed

Publication types

MeSH terms