. 2017 Apr 1;31(7):674-687.
doi: 10.1101/gad.296301.117.

Dicer loss and recovery induce an oncogenic switch driven by transcriptional activation of the oncofetal Imp1-3 family

Affiliations

Dicer loss and recovery induce an oncogenic switch driven by transcriptional activation of the oncofetal Imp1-3 family

Courtney K JnBaptiste et al. Genes Dev. .

Erratum in

Abstract

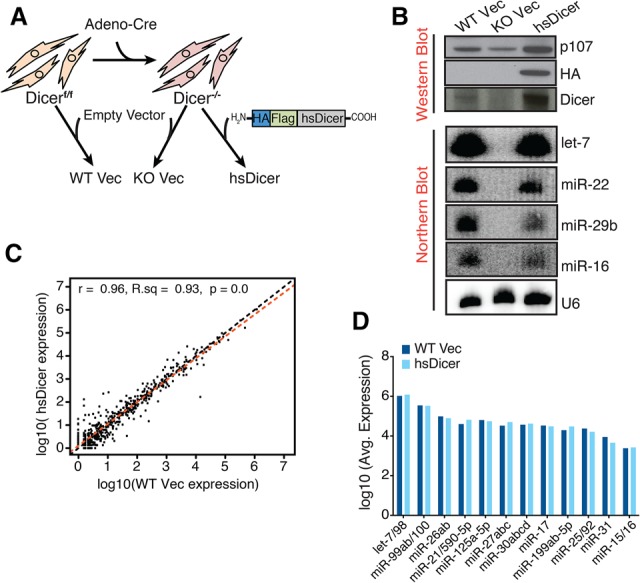
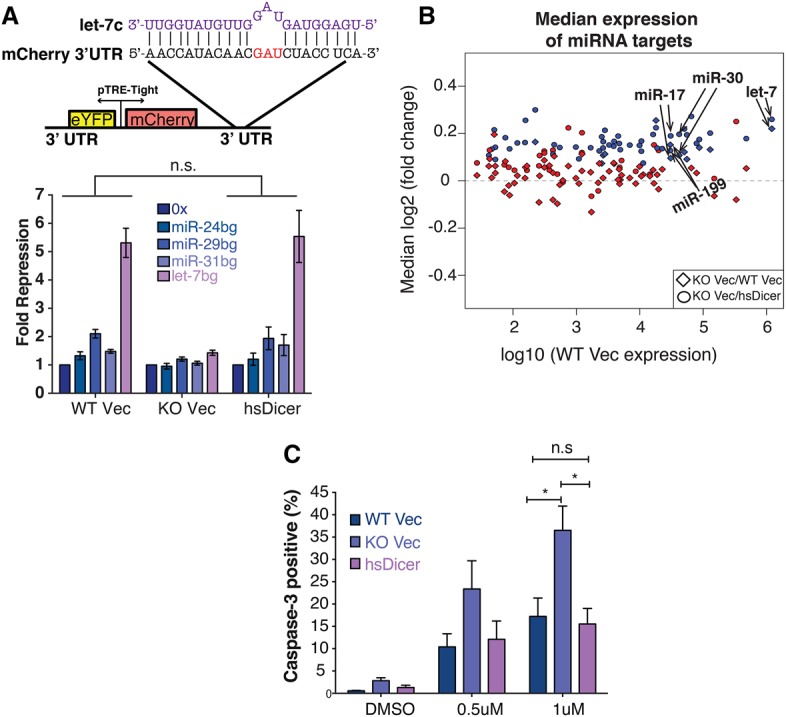
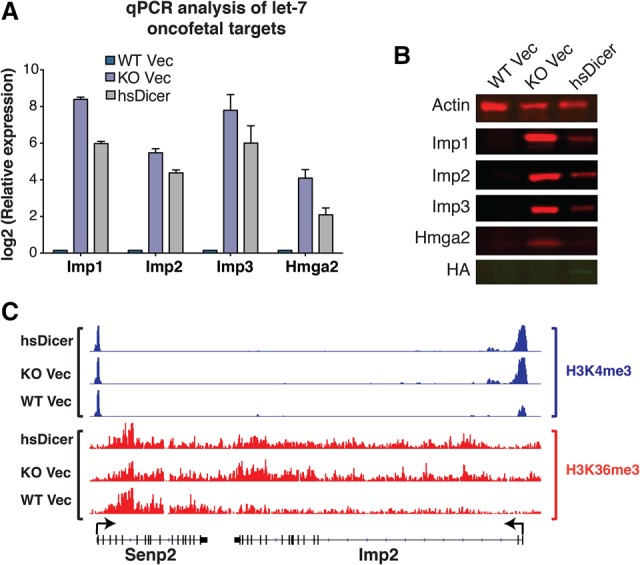
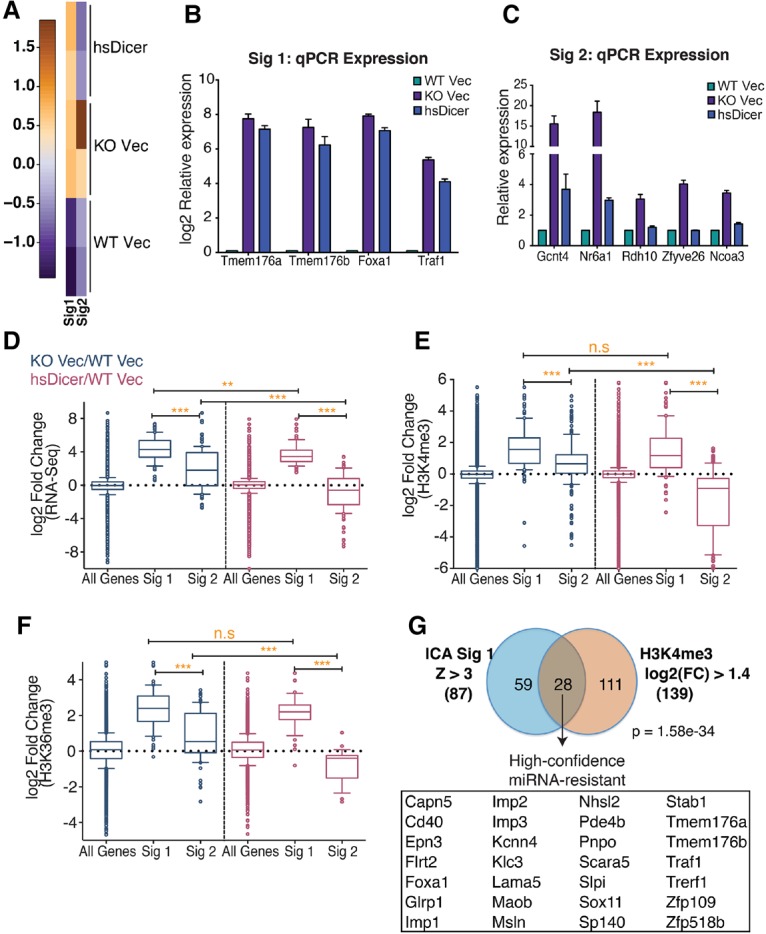
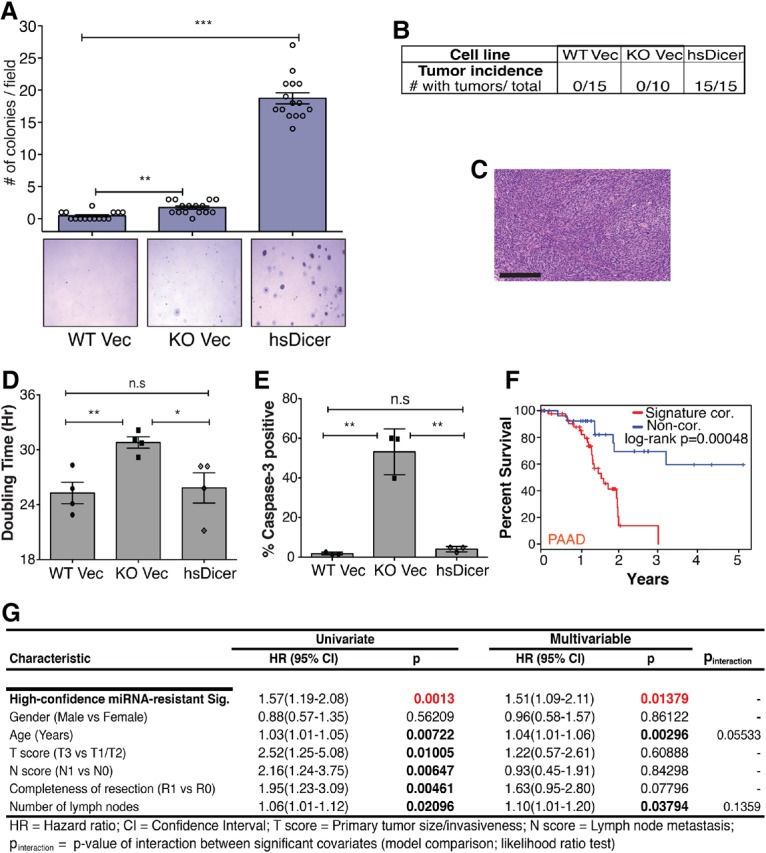
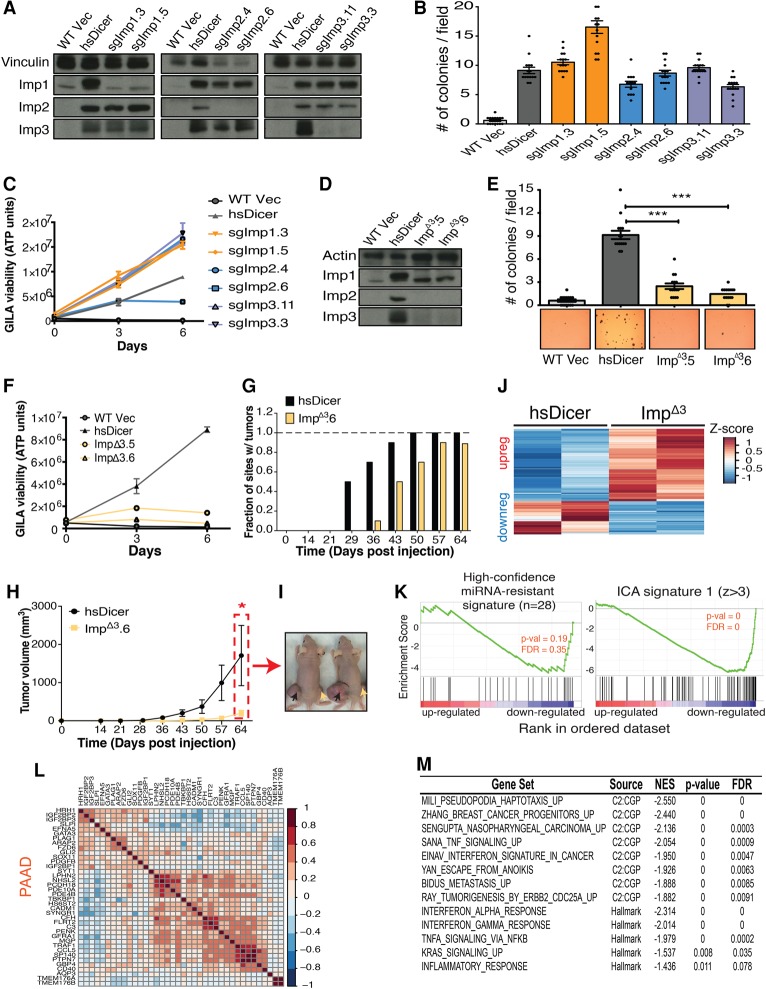
MicroRNAs (miRNAs) are post-transcriptional regulators of gene expression critical for organismal viability. Changes in miRNA activity are common in cancer, but how these changes relate to subsequent alterations in transcription and the process of tumorigenesis is not well understood. Here, we report a deep transcriptional, oncogenic network regulated by miRNAs. We present analysis of the gene expression and phenotypic changes associated with global miRNA restoration in miRNA-deficient fibroblasts. This analysis uncovers a miRNA-repressed network containing oncofetal genes Imp1, Imp2, and Imp3 (Imp1-3) that is up-regulated primarily transcriptionally >100-fold upon Dicer loss and is resistant to resilencing by complete restoration of miRNA activity. This Dicer-resistant epigenetic switch confers tumorigenicity to these cells. Let-7 targets Imp1-3 are required for this tumorigenicity and feed back to reinforce and sustain expression of the oncogenic network. Together, these Dicer-resistant genes constitute an mRNA expression signature that is present in numerous human cancers and is associated with poor survival.

Keywords: Dicer; Imp1–3; cancer; let-7; miRNA; oncofetal.


Figures

Figure 1.
Figure 1.
hsDicer rescues murine miRNA expression. (A) Schematized experimental design. Wild-type hsDicer was HA-Flag-epitope-tagged at the N terminus and cloned into pMMP-Puro, a puromycin-resistant vector. SV40-large T immortalized Dicerf/f or Dicer−/− cells were infected with virus encoding the Vec or HA-Flag-hsDicer (hsDicer), drug-selected, and passaged prior to experiments. (B, top panel) Western blot analysis across the heterogeneous population of resistant cells. p107 is shown as a loading control. (Bottom panel) Representative Northern blot analysis across a set of monoclonal lines isolated by low-density seeding from the heterogeneous population of resistant cells. U6 is shown as a loading control. (C) Global miRNA profile comparison between wild-type Vec and hsDicer. miRNAs collapsed by TargetScan family. The indicated values are normalized average expression counts across both replicates within each condition (two wild-type clones and two hsDicer clones). (Black line) y = x; (red line) line of best fit. (D) Normalized expression counts for the 12 TargetScan miRNA families that show significant Ago2 cross-linking at their target sites over background (Bosson et al. 2014). Adjusted P-value = 1 for all comparisons.
Figure 2.
Figure 2.
hsDicer expression recovers miRNA activity. (A, top panel) Schematic of the dual-color reporter used to assay miRNA repression. The 3′ UTR of mCherry contains sites imperfectly complementary to the miRNA of interest. The let-7c sequence is shown in purple. (Bottom panel) After transfecting with the reporter, flow cytometry was used to measure mCherry and eYFP levels. For each cell type, fold repression is relative to the nontargeted 0x reporter. Data shown are the mean and standard deviation of three independent experiments. P-values were calculated by paired Student's t-test. (B) Scatter plot of the median change in expression of miRNA targets relative to control genes matched for 3′ UTR length, GC content, and expression. Each point represents conserved targets of a single TargetScan miRNA family. miRNA expression is based on the average wild-type Vec expression reported in this study. Only expressed miRNAs are shown. (Blue) Significant change (Wilcoxon rank sum P ≤ 0.05); (red) not significant. (C) Doxorubicin-induced apoptosis measured by caspase-3 cleavage. The mean ± SEM of three independent experiments is indicated. P-values were calculated by unpaired Students t-test. (*) P < 0.05; (n.s) not significant.
Figure 3.
Figure 3.
Despite miRNA rescue, let-7 oncofetal targets remain activated. (A) qPCR analysis of four let-7-regulated oncofetal genes. Note the logarithmic scale. For each gene, expression is relative to wild-type Vec levels. Data are plotted as the mean ± SEM of four or more independent experiments. (B) Western blot analysis of the oncofetal gene set. HA tag was used to indicate hsDicer expression. Actin was used as a loading control. (C) Normalized read counts for H3K4me3 and H3K36me3 marks at the Imp2 locus across the three cell lines. Within each chromatin mark, all conditions are set to the same scale. Flanking genes are shown as controls. Arrows indicate transcription start sites (TSSs).
Figure 4.
Figure 4.
Identification of a high-confidence miRNA-resistant gene signature. (A) Heat map depicting two independent, statistically significant gene signatures detected in the RNA-seq expression data set using ICA. Signature 1 (Sig1) represents an expression pattern of genes up-regulated in knockout Vec and hsDicer conditions relative to wild-type Vec. Signature 2 (Sig2) represents genes that are down-regulated to wild-type Vec levels upon introduction of hsDicer. (B,C) qPCR validation of “irreversible” or “miRNA-resistant” genes identified from signature 1 (B) and “reversible” or “miRNA-sensitive” genes identified from signature 2 (C). Results are plotted relative to wild-type Vec levels. Bars represent mean ± SEM of at least three independent experiments. (D) Box and whisker plots of normalized RNA-seq expression fold changes for all expressed genes (n = 12834), signature 1-correlated genes (n = 87), and signature 2-correlated genes (n = 112). (E,F) Same as in D but for fold changes in normalized counts for gene-associated H3K4me3 peaks (E) and H3K36me3 peaks (F). Whiskers represent the 10th–90th percentile, and all other points are shown as individual dots. The P-values were calculated by Mann-Whitney U-test. (**) P < 0.01; (***) P < 0.0001; (n.s) not significant. (G) Overlap of signature 1-correlated genes and genes with a log2 fold change of at least 1.4 in H3K4me3 peak counts near their TSSs. The H3K4me3 criteria is satisfied by both knockout Vec/wild-type Vec and hsDicer/wild-type Vec comparisons. High-confidence miRNA-resistant genes are listed. The hypergeometric test's P-value is indicated.
Figure 5.
Figure 5.
miRNA restoration through hsDicer expression transforms MSCs. (A) Colony formation of MSCs after ∼15 d of growth in agarose-containing medium. Representative 4× bright-field images for each genotype are shown. Colonies were counted by eye in five random fields for three independent experiments. Data are plotted as the mean ± SEM. The Student's t-test P-value is indicated. (B) Frequency of tumor formation by the three parental MSC lines 8 wk after injection of 105 cells into the flanks of immune-compromised mice. (C) Representative hematoxylin and eosin staining of an hsDicer tumor section at 20× magnification. Bar, 200 µm. (D) Proliferation assay indicating the mean ± SEM of two experiments with two replicates each. (E) Apoptosis assayed by capase-3 cleavage. Mean and standard deviation are plotted. P-values were calculated by Student's t-test. (*) P < 0.05; (**) P < 0.01; (***) P < 0.0001; (n.s) not significant. (F) Kaplan-Meier survival analysis of The Cancer Genome Atlas's (TCGA) pancreatic adenocarcinoma (PAAD) patients stratified by their correlation score with the high-confidence miRNA-resistant signature. |z| > 0.5 extremes of score distribution; n = 46 most correlated; n = 28 least correlated. Patients with most correlated gene expression scores (red) exhibit significantly reduced survival times compared with least correlated patients (blue). See the Supplemental Material for details. (G) Results of univariate and multivariable Cox proportional hazard model on overall survival in the TCGA PAAD cohort (all patients). The high-confidence miRNA-resistant signature is found to be independently prognostic within the cohort of TCGA PAAD patients.
Figure 6.
Figure 6.
Combined loss of Imp1–3 greatly impairs tumorigenicity in vivo. (A) Western blot of lysates derived from CRISPR–Cas9-generated Imp knockout cells. Two independent clones of each knockout cell type are indicated. (Left panel) Imp1 knockouts (the upper band is the specific band). (Middle panel) Imp2 knockouts. (Right panel) Imp3 knockouts. Vinculin was used as a loading control. (B) Quantification of soft agar colony counts from the cell lines depicted in A. Data are plotted as the mean ± SEM. (C) Growth time course of cells in GILA assay. The ATP yield at each time point is a measure of cell viability. Data are plotted as the mean ± standard deviation. n = 3. (D) Western blot of whole-cell lysates from two independent clones of CRISPR–Cas9-generated Imp1–3 triple-knockout (ImpΔ3) cells. Actin was used as a loading control. (E) Quantification of soft agar colony counts from the cell lines depicted in D. Representative bright-field soft agar images for each genotype are shown at 4× magnification. (F) Same as in C but for ImpΔ3 cells. (G) Cumulative fraction of injected sites where tumors formed as a function of time. Each mouse from this cohort was subcutaneously injected with two cell types: hsDicer cells on the left flank and ImpΔ3 cells on the right flank. n = 10. (H) Kinetics of subcutaneous tumor growth for hsDicer- and ImpΔ3-derived tumors. (*) P < 0.05 from paired Wilcoxon signed rank test. (I) Representative image depicting gross subcutaneous tumor sizes at the experimental end point (64 d after injection). Black and yellow arrows indicate sites of hsDicer or ImpΔ3 cell injection, respectively. (J) Heat map of the 302 genes differentially expressed between hsDicer and ImpΔ3 cells. For each gene (each row), normalized gene expression is z-score standardized. (K) GSEA plots for the high-confidence miRNA-resistant (left panel) and ICA-derived (right panel) signature 1 signatures. Genes are ranked according to descending (ImpΔ3/hsDicer) log2 fold change such that most down-regulated genes are skewed to the right of the plot. Nominal P-values and false discovery rate (FDR) q-values are indicated. (L) Heat map depicting gene-by-gene Spearman correlation coefficients in tumor samples of PAAD patients from TCGA. Depicted genes are the leading edge core genes driving the enrichment of ICA signature 1 in K above. (M) Summary table for GSEA results showing enriched gene sets from the Molecular Signatures Database (MSigDB) curated or hallmark gene set collections. Genes down-regulated with Imp1–3 loss are significantly enriched for gene sets associated with pseudopodia-, cancer-, anoikis-, and inflammation-associated signaling.

References

    1. Anders S, Huber W. 2010. Differential expression analysis for sequence count data. Genome Biol 11: R106. - PMC - PubMed
    1. Baek D, Villen J, Shin C, Camargo FD, Gygi SP, Bartel DP. 2008. The impact of microRNAs on protein output. Nature 455: 64–71. - PMC - PubMed
    1. Bahubeshi A, Bal N, Rio Frio T, Hamel N, Pouchet C, Yilmaz A, Bouron-Dal Soglio D, Williams GM, Tischkowitz M, Priest JR, et al. 2010. Germline DICER1 mutations and familial cystic nephroma. J Med Genet 47: 863–866. - PubMed
    1. Bartel DP. 2009. MicroRNAs: target recognition and regulatory functions. Cell 136: 215–233. - PMC - PubMed
    1. Bell JL, Wachter K, Muhleck B, Pazaitis N, Kohn M, Lederer M, Huttelmaier S. 2013. Insulin-like growth factor 2 mRNA-binding proteins (IGF2BPs): post-transcriptional drivers of cancer progression? Cell Mol Life Sci 70: 2657–2675. - PMC - PubMed

Publication types

MeSH terms