. 2017 Apr 1;31(7):688-701.
doi: 10.1101/gad.295287.116.

The histone variant H2A.Z promotes splicing of weak introns

Affiliations

The histone variant H2A.Z promotes splicing of weak introns

Kelly E Nissen et al. Genes Dev. .

Abstract

Multiple lines of evidence implicate chromatin in the regulation of premessenger RNA (pre-mRNA) splicing. However, the influence of chromatin factors on cotranscriptional splice site usage remains unclear. Here we investigated the function of the highly conserved histone variant H2A.Z in pre-mRNA splicing using the intron-rich model yeast Schizosaccharomyces pombe Using epistatic miniarray profiles (EMAPs) to survey the genetic interaction landscape of the Swr1 nucleosome remodeling complex, which deposits H2A.Z, we uncovered evidence for functional interactions with components of the spliceosome. In support of these genetic connections, splicing-specific microarrays show that H2A.Z and the Swr1 ATPase are required during temperature stress for the efficient splicing of a subset of introns. Notably, affected introns are enriched for H2A.Z occupancy and more likely to contain nonconsensus splice sites. To test the significance of the latter correlation, we mutated the splice sites in an affected intron to consensus and found that this suppressed the requirement for H2A.Z in splicing of that intron. These data suggest that H2A.Z occupancy promotes cotranscriptional splicing of suboptimal introns that may otherwise be discarded via proofreading ATPases. Consistent with this model, we show that overexpression of splicing ATPase Prp16 suppresses both the growth and splicing defects seen in the absence of H2A.Z.

Keywords: H2A.Z; Prp16; Swr1 complex; chromatin; fission yeast; pre-mRNA splicing.


Figures

Figure 1.
Figure 1.
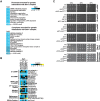
The Swr1 complex has strong genetic interactions across the spliceosome. (A) Processes and complexes enriched for significant negative genetic interactions with the Swr1 complex in the S. pombe EMAP. Processes are defined by the S. pombe GO Slim database (PomBase). Complexes are from the S. pombe cellular component GO list (PomBase), with splicing subcomplexes manually defined as in Supplemental Table S1. Complexes involved in chromatin remodeling are not shown. Significance is defined as Bonferonni corrected P-value < 0.00005 for processes and P-value < 0.005 for complexes. (B) Heat map of genetic interaction S scores between Swr1 complex factors and splicing factors. Splicing factors shown have at least one S score either >2.0 or less than −2.5. Gray squares indicate no data. S. cerevisiae gene names in are paretheses. (C) Serial dilutions (1:5) of wild type (WT), the pht1Δ mutant, splicing factor mutation alleles representing different splicing subcomplexes, and their double mutants with pht1Δ, grown at 16°C, 30°C, and 37°C.
Figure 2.
Figure 2.
H2A.Z is required for pre-mRNA splicing. (A) Cartoon depicting splicing-specific microarray probes and splicing index. (B) Splicing profile of pht1Δ and usp107DAmP single-mutant and pht1Δ usp107DAmP double-mutant strains. The EMAP S score for pht1Δ usp107DAmP was 0.455335 (neutral). cDNA from each single- and double-mutant strain was competitively hybridized on the splicing-specific microarray against that from wild type. A splicing index value was calculated for each intron by normalizing the log2 ratio of the intron change to junction change, multiplied by the exon change. The heat map shows the splicing index score for most introns in S. pombe of the indicated strain compared with wild type. Gene order along the Y-axis was the same for all arrays. The stacked bar plots below show the number of introns with a splicing index score >0.3 or less than −0.3. The color scale shows the distribution of the severity of the splicing defects. (C) Stacked bar plots of splicing index scores for the pht1Δ strain. The method was the same as in B except that cultures were grown to mid-log phase at 30°C and then shifted for 9 h to 16°C where indicated. Data for 30°C are the same as in B. (D) RT-qPCR validation of the splicing defect observed in pht1Δ at 16°C microarray on three introns. Bars represent the ratio of intron to exon signal. Error bars represent the SEM of three biological replicates. (*) P < 0.05; (**) P < 0.01, calculated by one-tailed t-test
Figure 3.
Figure 3.
Loss of H2A.Z impairs splicing of weak introns at the 5′ ends of genes. (A) Schematic representation of an S. pombe intron with arrows indicating features of intron architecture. The bar graph shows the probability of the indicated feature increasing the likelihood of intron retention, represented as log odds or log odds per nucleotide (positive log odds at a given feature indicate that increased length or frequency correlated with intron retention.) Affected introns were defined as having a corrected P-value of <0.05. Error bars represent the SEM of a logistic regression model (Lipp et al. 2015). (*) P < 0.05; (**) P < 0.01; (***) P < 0.001. (B) Schematic representation of the S. pombe 5′SS, BP, and 3′SS, with consensus nucleotides indicated in black and nonconsensus nucleotides indicated in red. The probability of a specific nucleotide change increasing the likelihood of retention is represented as log odds (positive log odds at a given position indicate that nonconsensus nucleotides correlate with intron retention). Statistics are the same as above. (C) Histogram of 5′SS and BP strength in S. pombe introns, plotted by their distance in base pairs from the TSS. Introns in the bottom decile of 5′SS and BP strength are enriched in the 5′ ends of genes. P-values are from a Kolmogorov-Smirnov (K-S) test.
Figure 4.
Figure 4.
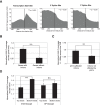
H2A.Z is enriched at splice sites. (A) Pileup of H2A.Z ChIP-seq reads around all TSSs, 5′SSs, and 3′SSs, normalized to input sample. Graphs represent a single replicate from this study. P-values are from a K-S test for data compared with a uniform distribution. (B) Bar plots representing the average level of H2A.Z coverage measured by ChIP-seq across genes with or without introns, normalized to WCE and the coverage of both data sets. Error bars represent the SEM. (***) P < 0.001, calculated by t-test. (C) Bar plots representing the average level of H2A.Z coverage measured by ChIP-seq within ±150 bp around the TSS for intron-containing genes with or without pht1Δ-affected introns, normalized to WCE and the coverage of both data sets. Error bars represent the SEM. (***) P < 0.001 calculated by t-test. (D) Bar plots representing the average level of H2A.Z coverage measured by ChIP-seq across introns in the top and bottom deciles of 5′SS and BP strength, normalized to WCE and the coverage of both data sets. Error bars represent the SEM. (***) P < 0.001, calculated by t-test; (N.S.) not significant.
Figure 5.
Figure 5.
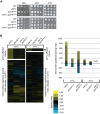
Overexpression of prp16 ATPase suppresses growth and splicing defects in pht1Δ and swr1Δ at restrictive temperatures. (A) Serial dilutions (1:5) of wild-type and single- and double-mutant strains grown at 16°C, 30°C, and 37°C. (B) Heat maps of the splicing profiles of the pht1Δ or swr1Δ, prp16DAmP, and their respective double-mutant strains. Cultures were grown to mid-log phase at 30°C and shifted for 9 h to 16°C or for 2 h to 37°C where indicated; cDNA from each single- and double-mutant strain was competitively hybridized on the splicing-specific microarray against that from wild type. The stacked bar plot shows the number of introns with a splicing index score >0.3 or less than −0.3. The color scale shows distribution of the severity of the splicing defect. (N.S.) Not significant
Figure 6.
Figure 6.
Mutating cis-splicing sequences to consensus suppresses the splicing defect of a model intron in pht1Δ at 16°C. (A) Cartoon depicting the architecture and 5′SS and BP sequences of intron 1 of model gene SPBPJ4664.05. Mutation of cis-splicing sequence nucleotides to the consensus sequence is indicated in red. (B) Bar graphs representing the splicing efficiency of SPBPJ4664.05 intron 1 in wild-type and pht1Δ strains with and without mutations to the 5′SSs and BPs as indicated above. Cultures were grown to mid-log phase at 30°C and shifted for 9 h to 16°C. Bars represent the ratio of intronic to exonic signal measured by RT-qPCR. Error bars represent the SEM of three biological replicates. (***) P < 0.001, calculated by one-tailed t-test.
Figure 7.
Figure 7.
Model illustrating the effect of H2A.Z loss on splicing efficiency and suppression by overexpression of prp16 and exacerbation by overexpression of prp43. Cartoon depicting a gene with a weak intron near the +1 nucleosome. When H2A.Z is absent, splicing of this weak intron does not proceed efficiently. Overexpression of Prp16 ATPase recues this splicing efficiency defect, possibly through altering the kinetics of splicing catalysis. Through mass action, overexpressed Prp16 is more likely to be bound to the spliceosome, thereby preventing discard by Prp43, promoting weak splice site sampling, and/or driving splicing catalysis forward. Overexpression of Prp43, on the other hand, preferentially acts to discard the spliceosomes on the weak substrate, which are possibly stalled due to the absence of H2A.Z.

Similar articles

Cited by

References

    1. Adam M, Robert F, Larochelle M, Gaudreau L. 2001. H2A.Z is required for global chromatin integrity and for recruitment of RNA polymerase II under specific conditions. Mol Cell Biol 21: 6270–6279. - PMC - PubMed
    1. Ahmed S, Dul B, Qiu X, Walworth NC. 2007. Msc1 acts through histone H2A.Z to promote chromosome stability in Schizosaccharomyces pombe. Genetics 177: 1487–1497. - PMC - PubMed
    1. Ast G. 2004. How did alternative splicing evolve? Nat Rev Genet 5: 773–782. - PubMed
    1. Awan AR, Manfredo A, Pleiss JA. 2013. Lariat sequencing in a unicellular yeast identifies regulated alternative splicing of exons that are evolutionarily conserved with humans. Proc Natl Acad Sci 110: 12762–12767. - PMC - PubMed
    1. Bergkessel M, Whitworth GB, Guthrie C. 2011. Diverse environmental stresses elicit distinct responses at the level of pre-mRNA processing in yeast. RNA 17: 1461–1478. - PMC - PubMed

MeSH terms