. 2017 Apr 1;31(7):702-717.
doi: 10.1101/gad.295188.116.

The histone variant H2A.Z promotes efficient cotranscriptional splicing in S. cerevisiae

Affiliations

The histone variant H2A.Z promotes efficient cotranscriptional splicing in S. cerevisiae

Lauren T Neves et al. Genes Dev. .

Abstract

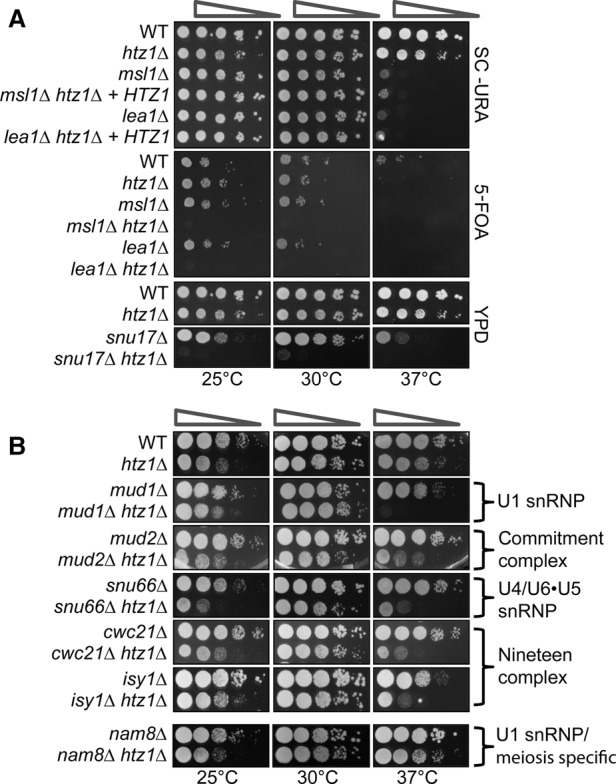
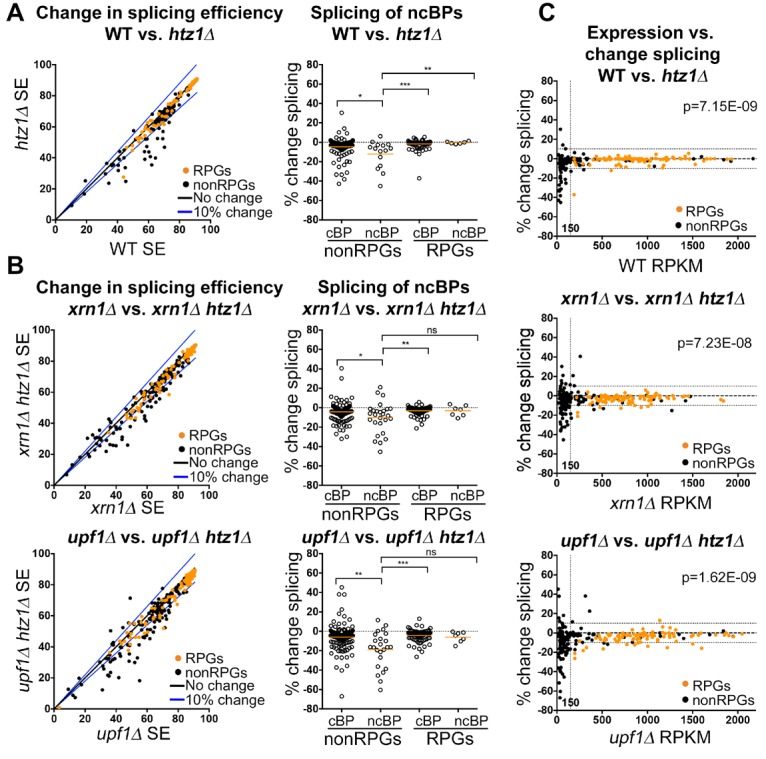
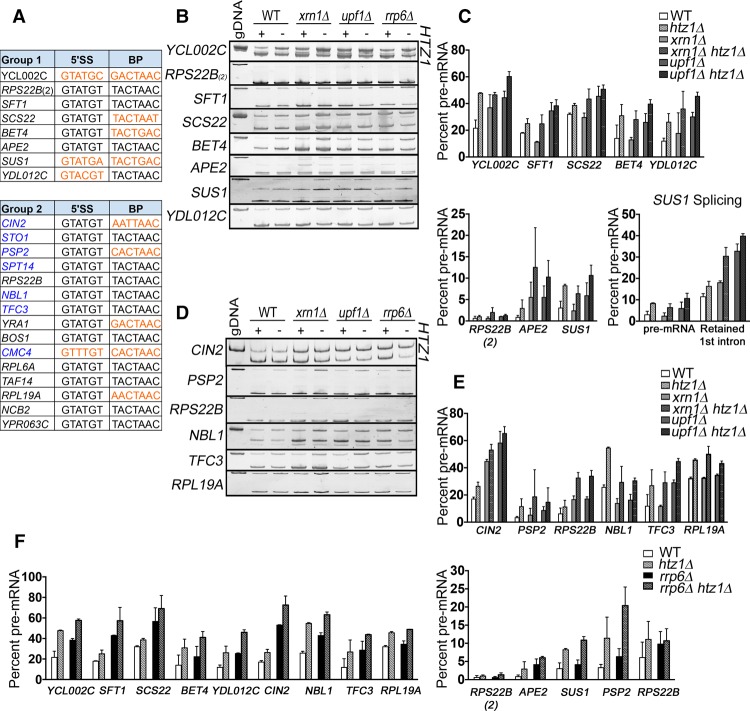
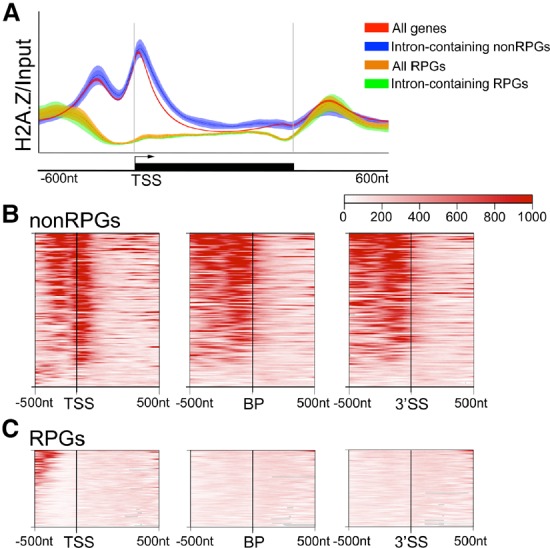
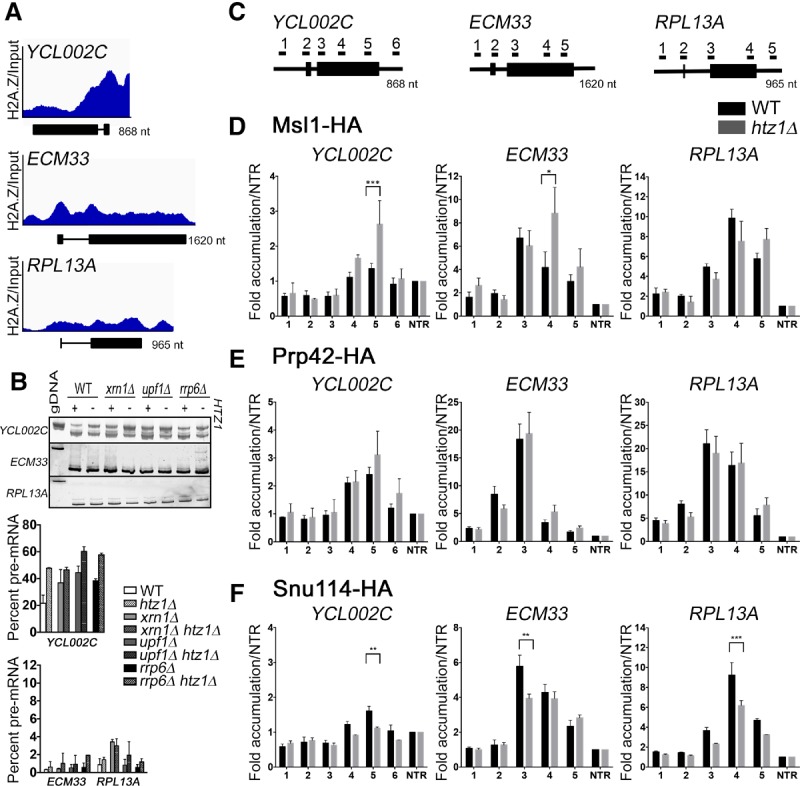
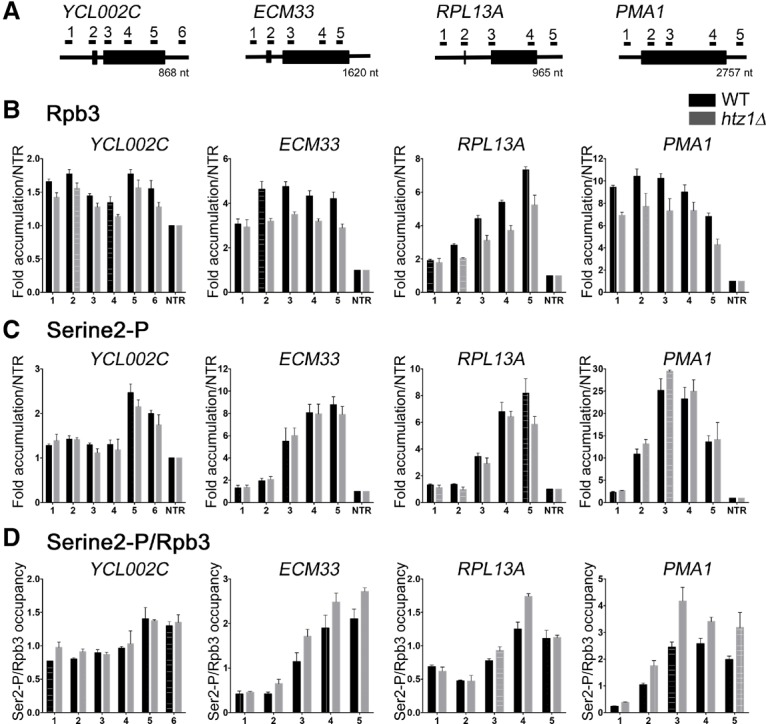
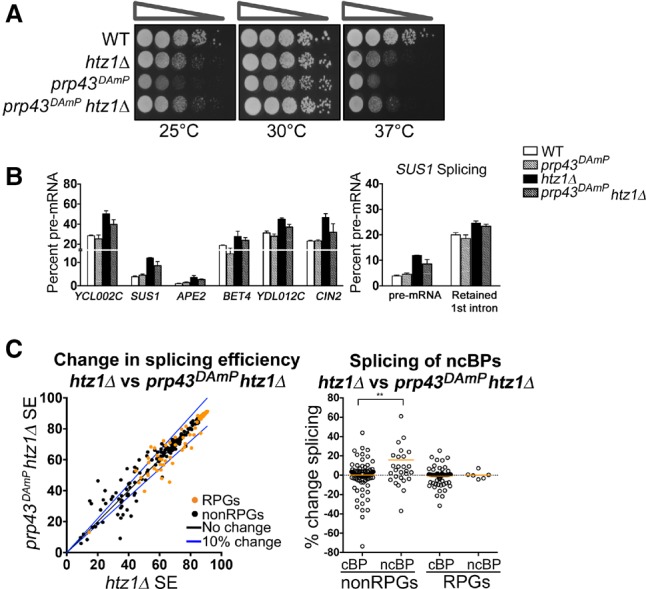
In eukaryotes, a dynamic ribonucleic protein machine known as the spliceosome catalyzes the removal of introns from premessenger RNA (pre-mRNA). Recent studies show the processes of RNA synthesis and RNA processing to be spatio-temporally coordinated, indicating that RNA splicing takes place in the context of chromatin. H2A.Z is a highly conserved histone variant of the canonical histone H2A. In Saccharomyces cerevisiae, H2A.Z is deposited into chromatin by the SWR-C complex, is found near the 5' ends of protein-coding genes, and has been implicated in transcription regulation. Here we show that splicing of intron-containing genes in cells lacking H2A.Z is impaired, particularly under suboptimal splicing conditions. Cells lacking H2A.Z are especially dependent on a functional U2 snRNP (small nuclear RNA [snRNA] plus associated proteins), as H2A.Z shows extensive genetic interactions with U2 snRNP-associated proteins, and RNA sequencing (RNA-seq) reveals that introns with nonconsensus branch points are particularly sensitive to H2A.Z loss. Consistently, H2A.Z promotes efficient spliceosomal rearrangements involving the U2 snRNP, as H2A.Z loss results in persistent U2 snRNP association and decreased recruitment of downstream snRNPs to nascent RNA. H2A.Z impairs transcription elongation, suggesting that spliceosome rearrangements are tied to H2A.Z's role in elongation. Depletion of disassembly factor Prp43 suppresses H2A.Z-mediated splice defects, indicating that, in the absence of H2A.Z, stalled spliceosomes are disassembled, and unspliced RNAs are released. Together, these data demonstrate that H2A.Z is required for efficient pre-mRNA splicing and indicate a role for H2A.Z in coordinating the kinetics of transcription elongation and splicing.

Keywords: H2A.Z; HTZ1; RNA processing; Swr1; budding yeast; chromatin; pre-mRNA splicing.


Figures

Figure 1.
Figure 1.
The histone variant H2A.Z is necessary for an optimal splicing environment. (A) Serial dilution assay of U2 snRNP double mutants msl1Δ htz1Δ, lea1Δ htz1Δ, and snu17Δ htz1Δ. For the msl1Δ and lea1Δ growth assay, cells were transformed with empty pRS316 URA plasmid (wild type [WT], htz1Δ, msl1Δ, and lea1Δ) or pRS316 containing HTZ1 (msl1Δ htz1Δ and lea1Δ htz1Δ). Cells were grown at 30°C in SC−URA selective liquid medium until the desired OD600 was obtained. Cells were spotted as a 10-fold dilution onto SC−URA plates or 5-FOA plates to select for loss of the plasmid. Plates were incubated for 2 d for SC−URA plates or 4 d for 5-FOA plates at 25°C, 30°C, or 37°C. For snu17Δ, cells were grown at 30°C in YPD liquid medium until the desired OD600 was obtained. Cells were spotted as a 10-fold dilution onto YPD plates and incubated for 2 d at 25°C, 30°C, or 37°C. (B) Serial dilution assay of double mutants, mud1Δ htz1Δ, mud2Δ htz1Δ, snu17Δ htz1Δ, snu66Δ htz1Δ, cwc21Δ htz1Δ, isy1Δ htz1Δ, and nam8Δ htz1Δ. Cells were grown at 30°C in YPD liquid medium until the desired OD600 was obtained. Cells were spotted as a 10-fold dilution onto YPD plates and incubated for 2 d at 25°C, 30°C, or 37°C.
Figure 2.
Figure 2.
H2A.Z is required for optimal splicing of a subset of ICGs. (A, left) Distribution in splicing efficiencies of all ICGs upon deletion of HTZ1, represented as an X–Y plot. RPGs are denoted in orange. (Right) Distribution of changes in splicing in groups of ICGs characterized by RPGs or non-RPGs and consensus or nonconsensus BPs. (B, left) Distribution in splicing efficiencies of all ICGs upon deletion of HTZ1 in either xrn1Δ (top) or upf1Δ (bottom) cells, represented as an X–Y plot. RPGs are denoted in orange. (Right) Distribution of changes in splicing in groups of ICGs characterized by RPGs or non-RPGs and consensus or nonconsensus BPs. P-values were determined by Mann-Whitney. (C) Distribution of changes in splicing efficiency upon deletion of HTZ1 compared with reads per kilobase per million mapped reads (RPKM) in wild-type (top), xrn1Δ (middle), and upf1Δ (bottom) cells. The vertical dotted line represents RPKM of 150. The horizontal lines represent 10% change in splicing efficiency. Genes with an RPKM ≤150 are enriched in genes with ≥10% splicing defect (χ2 test; P-values are indicated). (cBP) Consensus BP; (ncBP) nonconsensus BP; (ns) not significant; (*) P-value < 0.05; (**) P-value < 0.01; (***) P-value < 0.001.
Figure 3.
Figure 3.
RT–PCR analysis confirms that genes with nonconsensus splice sites are particularly sensitive to loss of H2A.Z. (A) Group 1 consists of ICGs whose splicing decreases by ≥10% in the wild-type, xrn1Δ, and upf1Δ backgrounds. Group 2 consists of ICGs whose splicing decreases by ≥10% in the xrn1Δ and upf1Δ backgrounds. Genes that did not pass the minimum-read filter in the wild-type background are denoted in blue. Nonconsensus splice sites are denoted in orange. (RPS22B) 5′ untranslated region (UTR) intron; (RPS22B_2) coding region intron. (B) Analysis of group 1 genes by RT–PCR in wild-type, xrn1Δ, and upf1Δ cells ±HTZ1. Products were analyzed on 6% PAGE gels (8% for SUS1). Pre-mRNA size is indicated by genomic DNA size. (C) Quantification of group 1 RT–PCR unspliced (pre-mRNA) products. (Bottom right) Quantification of SUS1 pre-mRNA and splicing intermediate containing only the second SUS1 intron. (D) Analysis of group 2 genes by RT–PCR in wild-type, xrn1Δ, and upf1Δ cells ±HTZ1. Products were analyzed on 6% PAGE gels. Pre-mRNA size is indicated by genomic DNA size. (E) Quantification of group 2 RT–PCR unspliced products. (F) Quantification of group 1 and group 2 RT–PCR unspliced products in rrp6Δ cells ±HTZ1. Quantification graphs represent the average of two independent experiments, and error bars represent the standard deviation (SD). (gDNA) Genomic DNA.
Figure 4.
Figure 4.
H2A.Z is well positioned near splice sites in non-RPGs. (A) H2A.Z ChIP-seq occupancy over input across the transcribed region and 600 nucleotides (nt) upstream of and downstream from the TSS and transcription stop site of all genes, all ICGs, all RPGs, intron-containing RPGs, and intron-containing non-RPGs. Lines represent the average fold enrichment of two biological replicates and 95% CI. The Y-axis represents 0–1000 mapped ChIP reads normalized to input. Analysis of data from Gu et al. (2015). (B) Hierarchical clustering of H2A.Z-binding profiles of intron-containing non-RPGs around TSSs or splice sites, oriented gene-directionality. (Left) Five-hundred nucleotides upstream of and 1000 nt downstream from the TSS. The vertical line indicates the TSS. Five-hundred nucleotides upstream of and 500 nt downstream from the BP sequence (middle) or 3′SS (right). n = 147. Introns found in the 5′ UTR were excluded. (C) Hierarchical clustering of H2A.Z-binding profiles of intron-containing RPGs around TSSs or splice sites, oriented gene-directionality. (Left) Five-hundred nucleotides upstream of and 1000 nt downstream from the TSS. The vertical line indicates the TSS. Five-hundred nucleotides upstream of and 500 nt downstream from the BP sequence (middle) or 3′SS (right). n = 88. Introns found in the 5′ UTR were excluded. Analysis of data by Gu et al. (2015), including an average of two biological replicates.
Figure 5.
Figure 5.
Cotranscriptional U2 snRNP recruitment is defective in the absence of H2A.Z. (A) Integrative Genome Viewer track view of H2A.Z occupancy over input by ChIP-seq across the ORF of YCL002C (top), ECM33 (middle), and RPL13A (bottom). The Y-axis represents 0–1000 mapped ChIP reads normalized to input. A schematic of each gene is included below each occupancy profile. Analysis of data from Gu et al. (2015). (B, top) Analysis of YCL002C, ECM33, and RPL13A genes by RT–PCR in the presence and absence of HTZ1. Products were analyzed on 6% PAGE gels. Pre-mRNA size is indicated by genomic DNA size. (Bottom) Quantification of RT–PCR products. Graphs represent the average of two independent experiments, and error bars represent the SD. (C) Schematic of ICGs YCL002C, ECM33, and RPL13A. Underlined numbers represent amplicons generated by each primer set used in this experiment. (D) Occupancy of Msl1 at each region of YCL002C (left), ECM33 (middle), or RPL13A (right) relative to the nontranscribed region in wild type or htz1Δ. Graphs represent the average of six (wild type) or three (htz1Δ) independent experiments, and error bars represent the standard error of the means (SEM). P-values for each primer set were determined by Student's t-test. Significant values are indicated. (E) Occupancy of Prp42 at each region candidate gene relative to the nontranscribed region in wild type or htz1Δ. Graphs represent the average of four independent experiments, and error bars represent the SEM. P-values for each primer set were determined by Student's t-test. No significant values were found. (F) Occupancy of Snu114 at each region of candidate genes relative to the nontranscribed region in wild type or htz1Δ. Graphs represent the average of three independent experiments, and error bars represent the SEM. P-values for each primer set were determined by Student's t-test. Significant values are indicated. (gDNA) Genomic DNA. (*) P-value < 0.01; (**) P-value < 0.001; (***) P-value < 0.0001.
Figure 6.
Figure 6.
RNAPII elongation kinetics are altered in the absence of H2A.Z. (A) Schematic of ICGs YCL002C, ECM33, and RPL13A and intronless gene PMA1. (B) Occupancy of Rpb3 at each region of YCL002C (left), ECM33 (middle left), RPL13A (middle right), or PMA1 (right) relative to the nontranscribed region in wild type or htz1Δ. Graphs represent the average of three independent experiments, and error bars represent the SEM. (C) Ser2 phosphorylation state of the RNAPII C-terminal domain at each region of candidate genes relative to the nontranscribed region in wild type or htz1Δ. Graphs represent the average of three independent experiments, and error bars represent the SEM. (D) Ser2 phosphorylation state (from C) normalized to Rpb3 (from B) occupancy at each region of candidate genes.
Figure 7.
Figure 7.
Decreased spliceosome disassembly can suppress H2A.Z-mediated splice defects. (A) Serial dilution assay of double mutant prp43DAmP htz1Δ. Cells were grown at 30°C in YPD + G418 liquid medium until the desired OD600 was obtained. Cells were spotted as a 10-fold dilution onto YPD + G418 plates and incubated for 2 d at 25°C, 30°C, or 37°C. (B, left) Quantification of pre-mRNA of candidate genes by RT–PCR in wild-type and prp43DAmP cells ±HTZ1. (Right) Quantification of SUS1 RT–PCR pre-mRNA and splicing intermediate containing only the second SUS1 intron. Quantification graphs represent the average of two to three independent experiments, and error bars represent the SD. (C, left) Distribution in splicing efficiencies of all ICGs upon deletion of HTZ1 in prp43DAmP cells, represented as an X–Y plot. RPGs are denoted in orange. (Right) Distribution of changes in splicing in groups of ICGs characterized by RPGs or non-RPGs and consensus or nonconsensus BPs. (cBP) Consensus BP; (ncBP) nonconsensus BP. (**) P-value < 0.01.

Similar articles

Cited by

References

    1. Albulescu LO, Sabet N, Gudipati M, Stepankiw N, Bergman ZJ, Huffaker TC, Pleiss JA. 2012. A quantitative, high-throughput reverse genetic screen reveals novel connections between Pre-mRNA splicing and 5′ and 3′ end transcript determinants. PLoS Genet 8: e1002530. - PMC - PubMed
    1. Alexander RD, Innocente SA, Barrass JD, Beggs JD. 2010. Splicing-dependent RNA polymerase pausing in yeast. Mol Cell 40: 582–593. - PMC - PubMed
    1. Allepuz-Fuster P, Martinez-Fernandez V, Garrido-Godino AI, Alonso-Aguado S, Hanes SD, Navarro F, Calvo O. 2014. Rpb4/7 facilitates RNA polymerase II CTD dephosphorylation. Nucleic Acids Res 42: 13674–13688. - PMC - PubMed
    1. Amberg DC, Burke D, Strathern J. 2005. Methods in yeast genetics: a Cold Spring Harbor Laboratory course manual. Cold Spring Harbor Laboratory Press, Cold Spring Harbor, NY.
    1. Amit M, Donyo M, Hollander D, Goren A, Kim E, Gelfman S, Lev-Maor G, Burstein D, Schwartz S, Postolsky B, et al. 2012. Differential GC content between exons and introns establishes distinct strategies of splice-site recognition. Cell Rep 1: 543–556. - PubMed

MeSH terms