. 2017 May 9;114(19):E3839-E3848.
doi: 10.1073/pnas.1608769114. Epub 2017 Apr 26.

Early immune responses are independent of RGC dysfunction in glaucoma with complement component C3 being protective

Affiliations

Early immune responses are independent of RGC dysfunction in glaucoma with complement component C3 being protective

Jeffrey M Harder et al. Proc Natl Acad Sci U S A. .

Abstract

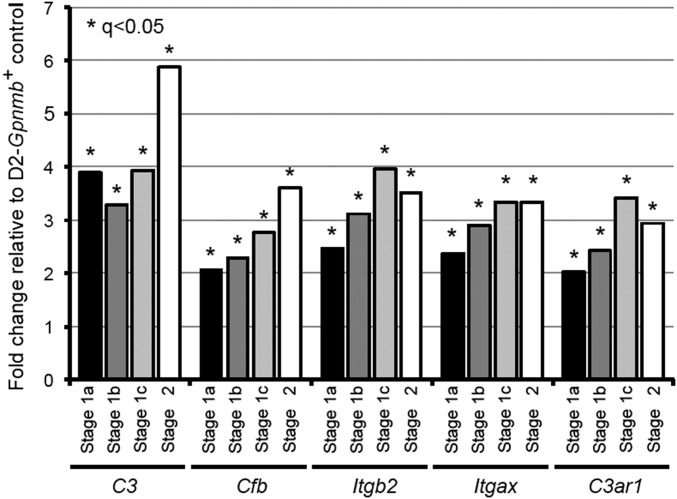
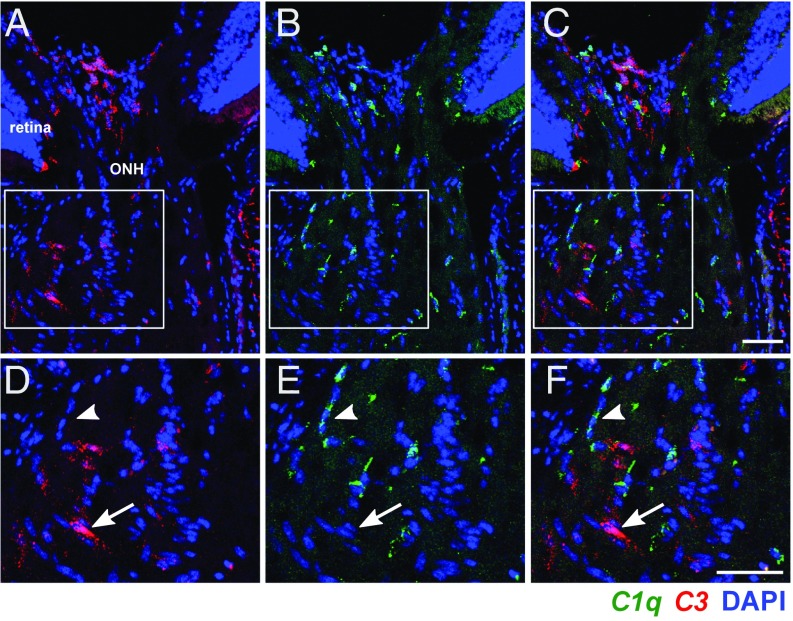
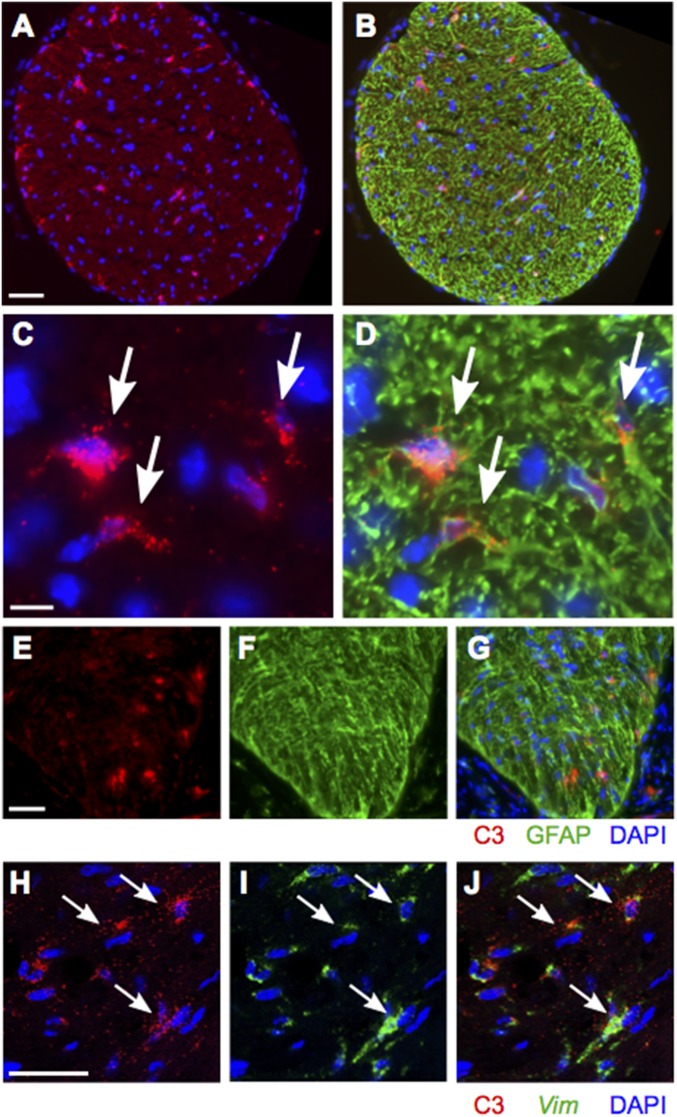
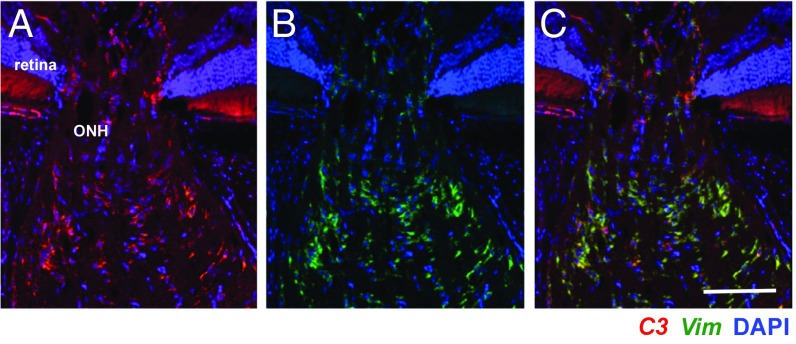
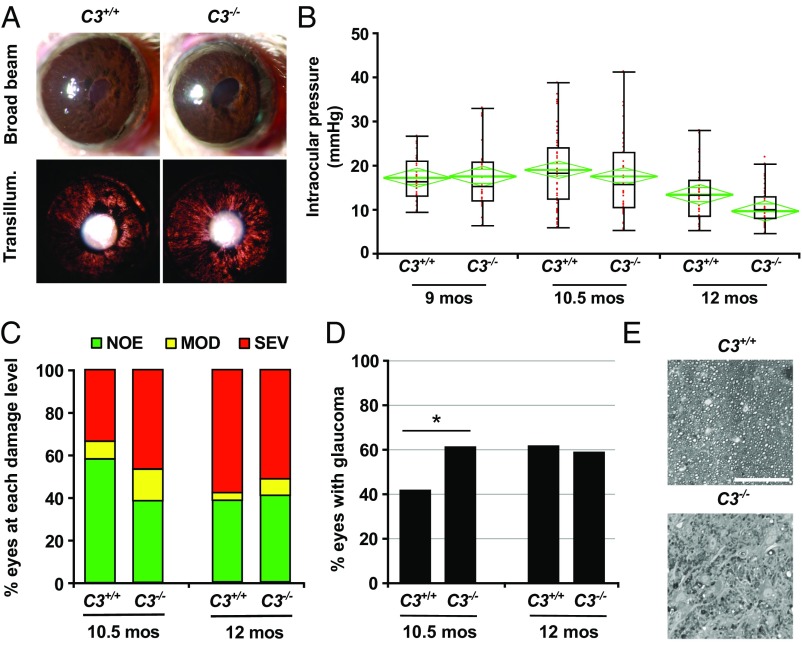
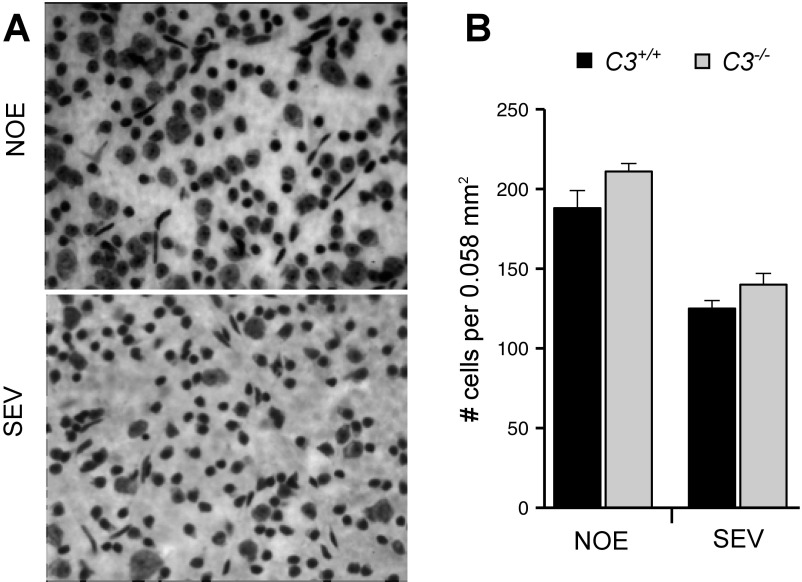
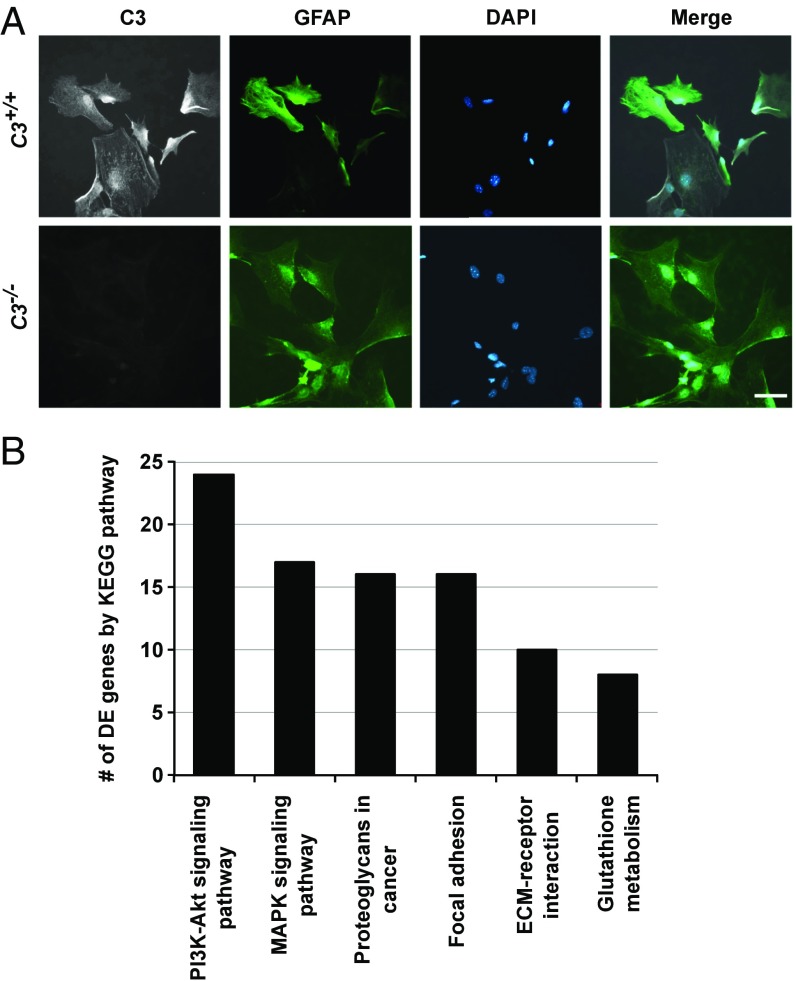
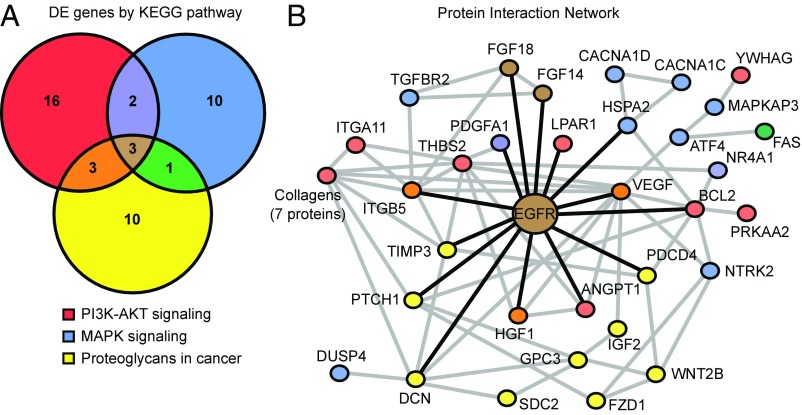
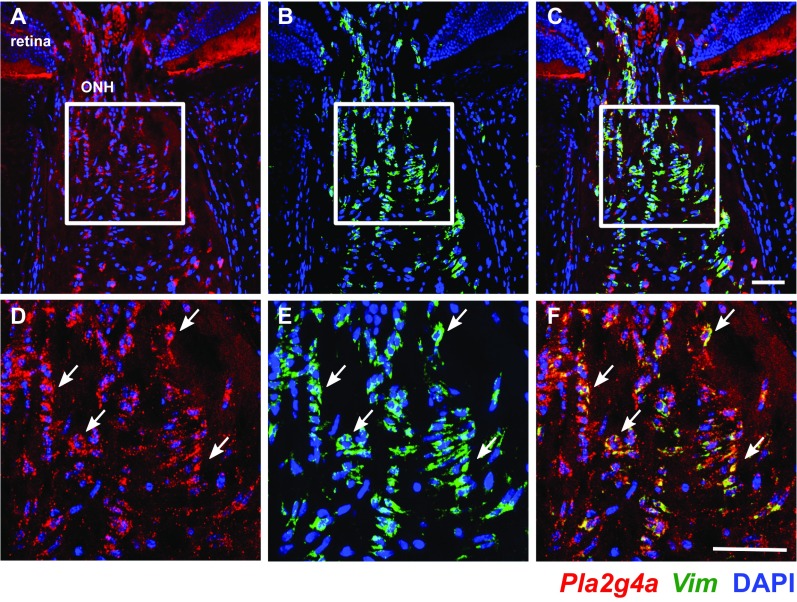
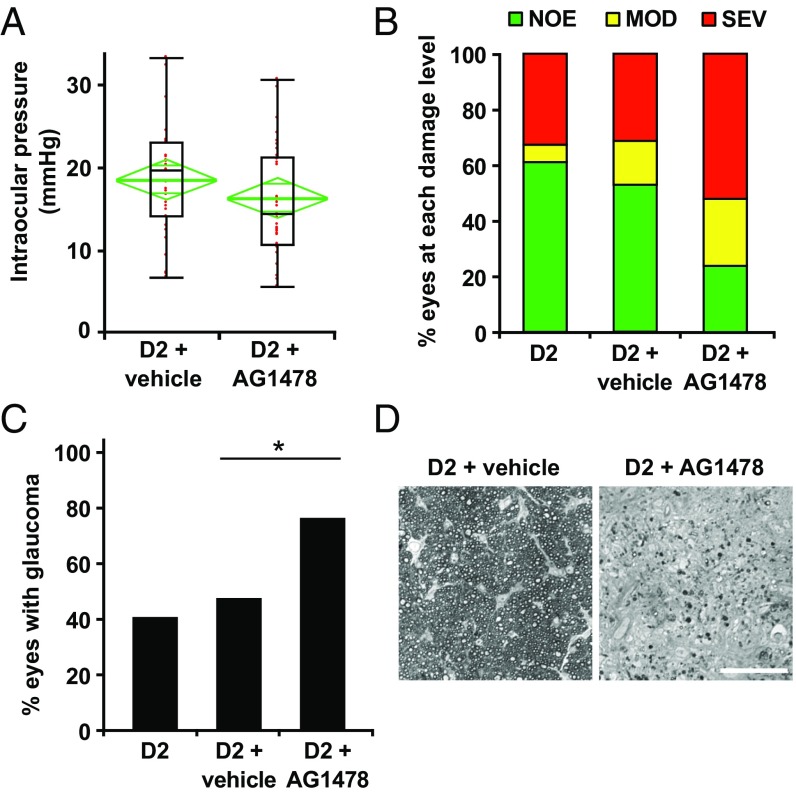
Various immune response pathways are altered during early, predegenerative stages of glaucoma; however, whether the early immune responses occur secondarily to or independently of neuronal dysfunction is unclear. To investigate this relationship, we used the Wlds allele, which protects from axon dysfunction. We demonstrate that DBA/2J.Wlds mice develop high intraocular pressure (IOP) but are protected from retinal ganglion cell (RGC) dysfunction and neuroglial changes that otherwise occur early in DBA/2J glaucoma. Despite this, immune pathways are still altered in DBA/2J.Wlds mice. This suggests that immune changes are not secondary to RGC dysfunction or altered neuroglial interactions, but may be directly induced by the increased strain imposed by high IOP. One early immune response following IOP elevation is up-regulation of complement C3 in astrocytes of DBA/2J and DBA/2J.Wlds mice. Unexpectedly, because the disruption of other complement components, such as C1Q, is protective in glaucoma, C3 deficiency significantly increased the number of DBA/2J eyes with nerve damage and RGC loss at an early time point after IOP elevation. Transcriptional profiling of C3-deficient cultured astrocytes implicated EGFR signaling as a hub in C3-dependent responses. Treatment with AG1478, an EGFR inhibitor, also significantly increased the number of DBA/2J eyes with glaucoma at the same early time point. These findings suggest that C3 protects from early glaucomatous damage, a process that may involve EGFR signaling and other immune responses in the optic nerve head. Therefore, therapies that target specific components of the complement cascade, rather than global inhibition, may be more applicable for treating human glaucoma.

Keywords: EGFR; WLDS; astrocytes; complement; glaucoma.


Conflict of interest statement

The authors declare no conflict of interest.

Figures

Fig. 1.
Fig. 1.
Wlds homozygosity is no more protective than Wlds heterozygosity. (A) The Wlds allele protected from glaucomatous optic nerve damage at age 12 mo [P < 0.003, χ2 test of independence comparing heterozygous (het) or homozygous (homo) mice with standard D2 littermates], but increasing gene dosage was not significantly more protective. Bars represent the distribution of optic nerve damage by genotype: no or early (NOE; healthy clear axons with PPD stain), moderate (MOD; darkly stained axons, with PPD stain indicating damage, but with the majority of axons healthy), or severe (SEV; majority of axons damaged/lost). D2 and het data were reported previously (20). (B) Examples of PPD-stained cross sections of retro-orbital optic nerves showing similar staining in D2-Gpnmb+ no-glaucoma control compared with D2 (NOE) and D2.Wlds homo (NOE). (C) No differences were detected in the transport of anterograde tracer Alexa Fluor 594-cholera toxin subunit B (red) to the superior colliculus (SC) among NOE eyes from D2 mice (Middle), D2.Wlds (Lower), and no-glaucoma D2-Gpnmb+ control eyes (Upper). Axon transport was assessed at age 12 mo. (D) ONH axon integrity was assessed in D2 and D2.Wlds eyes using cyan fluorescent protein expression driven from a Thy1 promoter (Materials and Methods). In 9-mo D2 eyes (Upper Left), local axonal swellings (LAS; Upper Right, arrows) and dystrophic neurites (DN; Upper Right, arrowhead) were observed, as reported previously (20); however, the number of local axonal swellings was greatly reduced in D2.Wlds eyes (Lower Right; P < 0.01). (Scale bars: 50 μm in C; 500 μm in D.)
Fig. 2.
Fig. 2.
RGCs from D2.Wlds eyes do not show dendrite remodeling. (A) At 9 mo, retinal cells were filled and RGCs identified based on axons projecting to the ONH and dendrites traced (Materials and Methods). (B and C) There was no statistical difference in the mean dendritic field area (B) or the number of intersections from a Sholl analyses (C) between RGCs from D2.Wlds and D2.Gpnmb+ controls.
Fig. 3.
Fig. 3.
Inflammatory pathways are up-regulated in D2.Wlds eyes. (A) The number of differentially expressed genes in retinas from D2 and D2.Wlds mice compared with D2.Gpnmb+ controls. (B) The top-15 enriched KEGG pathways (by gene number) comparing differentially expressed genes from D2 vs. D2.Gpnmb+ samples (details in Dataset S3). (C) Gene expression profiles of ONH tissue were compared between D2.Wlds and D2-Gpnmb+ mice. DE genes fell into eight significantly enriched KEGG pathways (P ≤ 0.02 for each). Antigen proc., antigen processing and presentation; cell adhesion, cell adhesion molecules; complement, complement and coagulation pathways; cytosolic DNA, cytosolic DNA-sensing pathway; TLR signaling, Toll-like receptor signaling pathway; RIG signaling, RIG-I–like receptor signaling pathway. (D) By IPA, DE genes identified in the D2.Wlds ONH dataset are related to inflammatory responses and immune cell infiltration. (E) Infiltration of peripheral immune cells (fluorescently labeled by CFDA injection into the spleen, green; Materials and Methods) was observed in the ONHs of all D2 and D2.Wlds mice, but not in those of D2.Gpnmb+ mice (n = 10 eyes per sample group). (Scale bar: 50 μm.)
Fig. S1.
Fig. S1.
Components of the phagosome pathway are significantly up-regulated (in red) in the ONH during predegenerative stages 1a and 1b of glaucoma. These are among the earliest transcriptional changes occurring in the ONH after exposure to chronic ocular hypertension in DBA/2J glaucoma. The figure is a modified version of the KEGG pathway diagram (KEGG ID: 4145).
Fig. S2.
Fig. S2.
Complement C3 and mediators of C3′s effects are up-regulated in the ONH during very early stages of glaucoma. Genes up-regulated include C3 itself, the C3 convertase Cfb, and receptors for C3 fragments C3a (C3ar1) and C3b (Itgb2 and Itgax).
Fig. 4.
Fig. 4.
C3 and C1q are not expressed in the same ONH cells. Expression patterns of C3 (red) and C1qa (green) were determined using two-color RNA in situ hybridization (Materials and Methods). (A–C) Examples of ONHs from a 10-mo-old D2 mouse with NOE glaucoma showing that C3 did not colocalize with C1qa. (D–F) Magnified images from boxed regions in A–C showing specific cells expressing either C3 (arrow) or C1qa (arrowhead). Cell nuclei are labeled with DAPI (blue). (Scale bars: 50 μm.)
Fig. 5.
Fig. 5.
C3 colocalizes with GFAP and vimentin (Vim) in the ONHs of D2 mice. (A and B) FISH (red) combined with immunofluorescence (green) in a cross-section of ONH tissue showing coexpression of C3 (red) and GFAP (green; astrocyte marker). (C and D) Magnified images showing coexpression of C3 and GFAP in the same cells. (E and F) FISH for C3 in longitudinal sections of the ONH showing C3 expression directly behind the eye. (H and J) Two-color RNA in situ hybridization-stained ONH longitudinal sections showing colocalization of vimentin (Vim, a specific marker of ONH astrocytes) and C3 (arrows). (Scale bars: 50 μm in A and B; 10 μm in C and D; 50 μm in E–G; 50 μm in H–J.)
Fig. 6.
Fig. 6.
C3 colocalizes with vimentin (Vim) in ONHs of D2.Wlds mice. Representative FISH images with probes for C3 (red) and Vim (green) showing colocalization in an ONH from a 10-mo-old D2.Wlds mouse. Cell nuclei are labeled with DAPI (blue). Magnified images show cells with overlapping expression of C3 and Vim. (Scale bar: 50 μm.)
Fig. 7.
Fig. 7.
C3 is protective in early D2 glaucoma. (A) D2.C3−/− mice developed iris disease without difference to standard D2 mice. Depigmentation of the iris was observed both by broad-beam illumination (Upper) and transillumination (Lower). (B) Age-dependent elevation of IOP was observed in both C3-sufficient D2 (C3+/+) and C3-deficient D2 (C3−/−) mice, present in a subset of eyes at age 9 mo. There were no significant differences between genotypes at each age assessed (8.5–9.0 mo, P = 0.88; 10–10.5 mo, P = 0.92; 12–12.5 mo, P = 0.94). Boxplots were generated using JMP version 7.0. The boxes define the 75th and 25th percentiles, and the black line in the middle of each box represents the median value. The whiskers depict the full range of the data points. The green diamonds indicate the mean value and the 95% CI. (C and D) Optic nerve damage was significantly increased in C3−/− mice compared with C3+/+ mice at age 10.5 mo. Bars represent the distribution of optic nerve damage by genotype and age. At age 10.5 mo, C3−/− mice exhibited significantly increased nerve damage (P = 0.01). (E) Examples of the most common damage level for C3+/+ (NOE) and C3−/− (SEV) at age 10.5 mo. (Scale bar: 50 μm.)
Fig. S3.
Fig. S3.
Soma degeneration is coupled to axon degeneration in glaucoma in D2.C3−/− mice. (A) Representative images of Nissl staining in flat-mounted retinas in eyes with NOE axon damage and severe (SEV) axon damage. No differences in morphology or cell count were observed based on C3 genotype. (B) SEV eyes have significantly fewer cells in the RGC layer compared with NOE eyes (P < 0.05).
Fig. 8.
Fig. 8.
C3 deficiency perturbs multiple cell signaling pathways in cultured cortical astrocytes. (A) Cultured GFAP+ cortical astrocytes from D2 (C3+/+) mice express C3 (Upper), but those from C3-deficient (C3−/−) D2 mice do not (Lower). (B) Bar chart showing the number of DE genes in enriched KEGG pathways between cultured astrocytes (GFAPhi, selected by FACs) from C3-sufficient (C3+/+) and C3-deficient (C3−/−) mice.
Fig. 9.
Fig. 9.
Network analyses identified EGFR as a hub in the astrocytic network of genes perturbed by C3 deficiency. (A) Venn diagram displaying the number of genes that are unique and overlap in three cell signaling pathways altered by C3 deficiency in cultured astrocytes (shown in Fig. 6C). Only three DE genes are common among the three pathways: Egfr, Fgf14, and Fgf18. (B) Network interaction diagram (created using STRING) depicting known and predicted protein interactions of genes in the MAPK signaling, PI3K-AKT signaling, and proteoglycans in cancer pathways. Node colors correspond to the Venn diagram colors in A, with additional colors representing genes in multiple pathways. Purple indicates genes shared by PI3K-AKT and MAPK signaling, orange indicates genes shared by the PI3K-AKT and proteoglycan pathways, green indicates genes shared by the MAPK and proteoglycan pathways, and brown indicates genes shared by all of the pathways. Gray lines indicate protein interactions, and black lines indicate protein interactions with EGFR. Among the three genes common to the three pathways, Egfr encodes the protein that interacts with the largest number of proteins in the network.
Fig. S4.
Fig. S4.
Pla2g4a, a downstream effector of EGFR signaling, is expressed by ONH astrocytes. Expression patterns of Pla2g4a (red) and vimentin (Vim; green) were determined using two-color RNA in situ hybridization. Vim is a specific marker of astrocytes in the ONH. (A–C) Examples of ONH cells from a 10-mo-old D2 mouse with NOE glaucoma showing Pla2g4a colocalized with Vim. (D–F) magnified images from the boxed regions in A–C showing specific Vim+ astrocytes expressing Pla2g4a (arrows). Cell nuclei are labeled with DAPI (blue). (Scale bars: 50 μ.)
Fig. 10.
Fig. 10.
Continuous administration of EGFR inhibitor AG1478 increases neurodegeneration in DBA/2J mice. AG1478 or vehicle was administered to D2 mice from age 7 mo to 10.5 mo using an mini osmotic pump (Materials and Methods), and IOP and glaucoma were assessed. (A) Age-dependent elevation of IOP was found in both vehicle-treated and AG1478-treated D2 mice at age 10.5 mo. No significant differences were observed based on treatment (P = 0.08). Boxplot parameters are described in the Fig. 7 legend. (B and C) Optic nerve damage distributions for three cohorts of mice: untreated (D2), DMSO-treated (D2 + vehicle), and AG1478-treated (D2 + AG1478). By age 10.5 mo, a significant increase in optic nerve damage was observed in the AG1478-treated mice compared with either the D2 mice or vehicle-treated mice (3 × 3 Fisher exact test, P = 0.004; Fisher exact test comparing AG1478 with vehicle, P = 0.01). (D) Examples of the most common damage levels for vehicle-treated (NOE; Left) and AG1478-treated (SEV; Right) mice. (Scale bar: 50 μm.)

Similar articles

Cited by

References

    1. Burgoyne CF. A biomechanical paradigm for axonal insult within the optic nerve head in aging and glaucoma. Exp Eye Res. 2011;93:120–132. - PMC - PubMed
    1. Nickells RW, Howell GR, Soto I, John SW. Under pressure: Cellular and molecular responses during glaucoma, a common neurodegeneration with axonopathy. Annu Rev Neurosci. 2012;35:153–179. - PubMed
    1. Quigley HA. Number of people with glaucoma worldwide. Br J Ophthalmol. 1996;80:389–393. - PMC - PubMed
    1. Leske MC, Wu SY, Hennis A, Honkanen R, Nemesure B. BESs Study Group Risk factors for incident open-angle glaucoma: The Barbados Eye Studies. Ophthalmology. 2008;115:85–93. - PubMed
    1. Howell GR, et al. Radiation treatment inhibits monocyte entry into the optic nerve head and prevents neuronal damage in a mouse model of glaucoma. J Clin Invest. 2012;122:1246–1261. - PMC - PubMed

Publication types

MeSH terms