. 2017 Jul;16(7):1257-1268.
doi: 10.1158/1535-7163.MCT-17-0115. Epub 2017 Apr 26.

Cotargeting mTORC and EGFR Signaling as a Therapeutic Strategy in HNSCC

Affiliations

Cotargeting mTORC and EGFR Signaling as a Therapeutic Strategy in HNSCC

Adam D Swick et al. Mol Cancer Ther. 2017 Jul.

Abstract

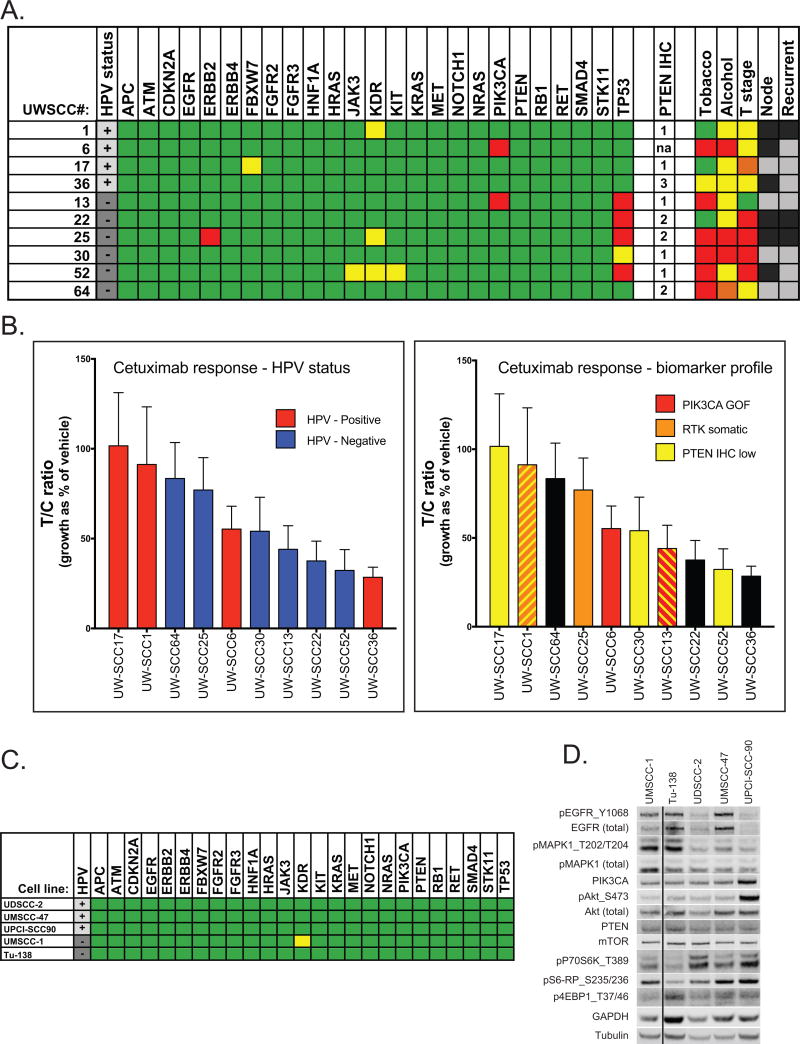
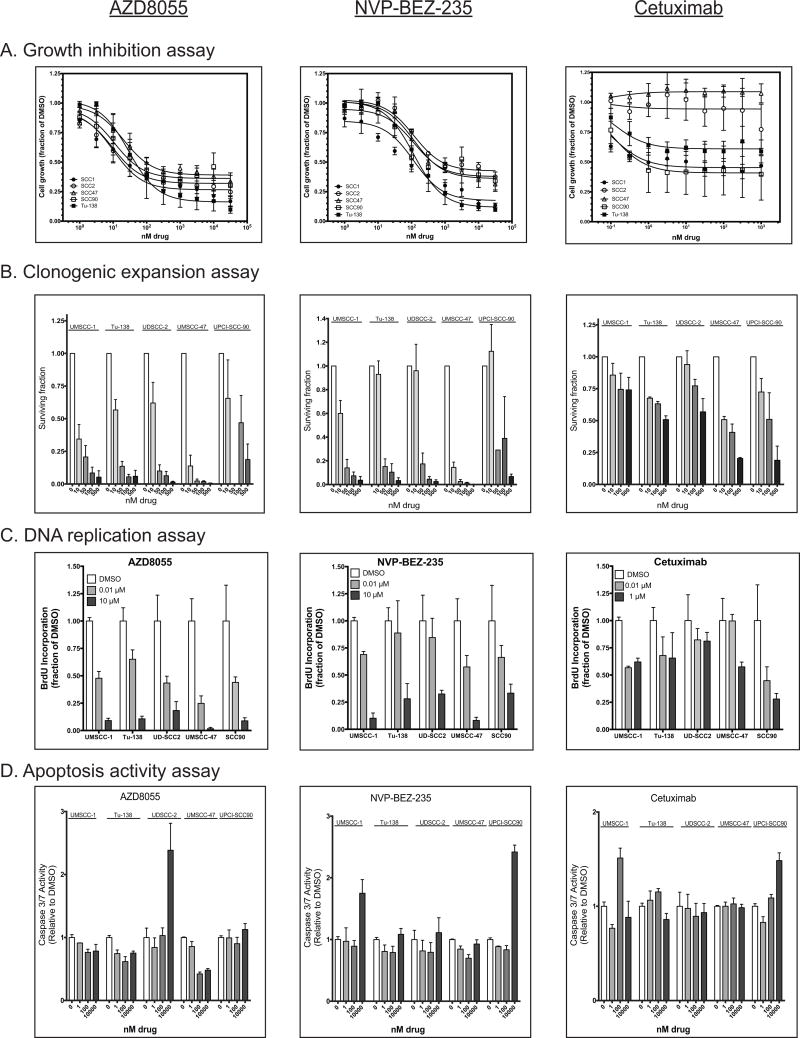
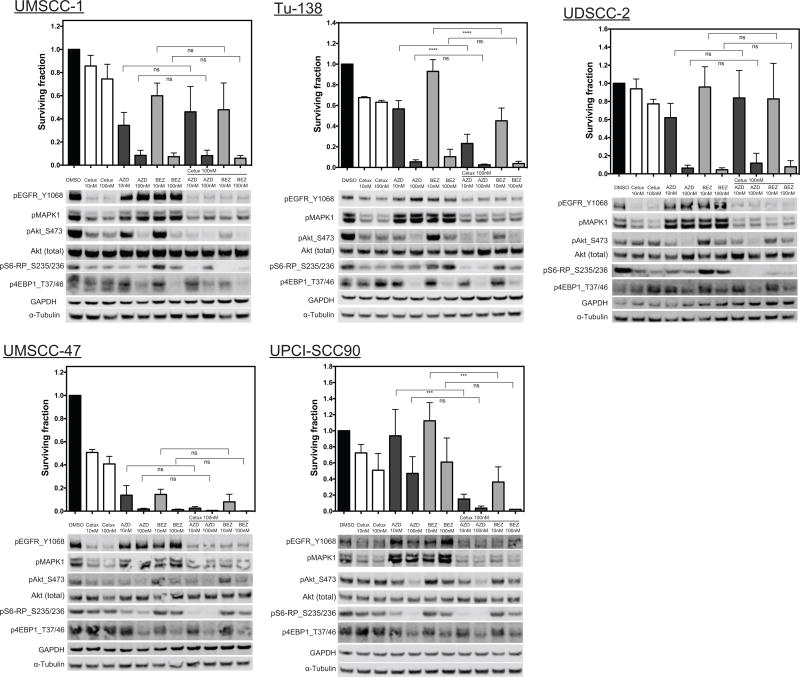
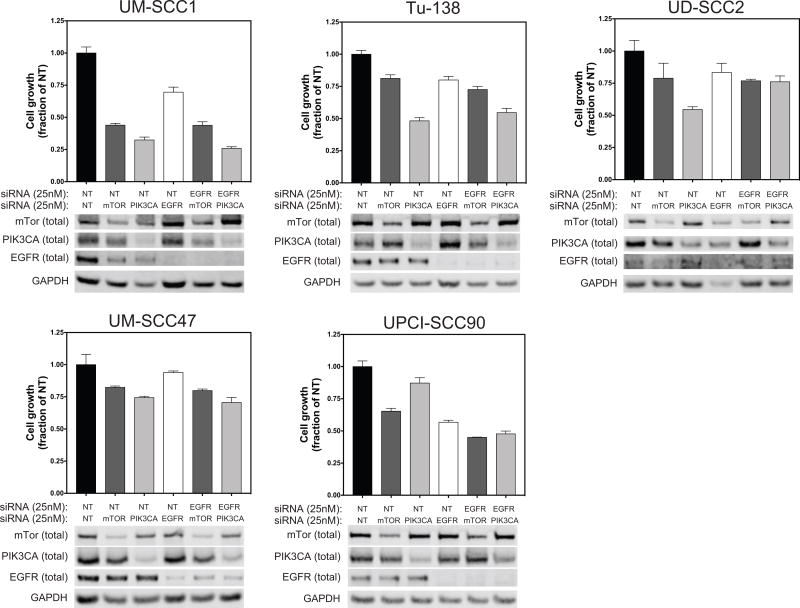
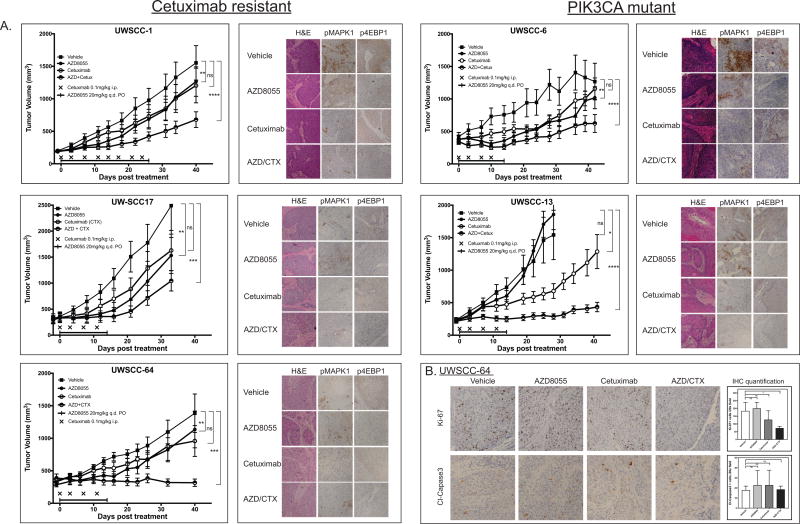
Head and neck squamous cell carcinomas (HNSCC) are frequently altered along the PI3K/AKT/mTORC signaling axis. Despite excellent preclinical data, the use of compounds targeting this pathway as monotherapy has been underwhelming in initial clinical trials, and identification of predictive biomarkers remains challenging. To investigate mTORC-specific inhibition, we tested catalytic mTORC (AZD8055) and PI3K/mTORC (NVP-BEZ-235) inhibitors ± cetuximab in a panel of HNSCC cell lines and patient-derived xenografts (PDX). Cell lines were assayed for response to all agents and siRNA knockdown of targets by multiple approaches. All cell lines showed similar response to both drug and siRNA inhibition of both PI3K and mTORC pathways, with anti-EGFR combination producing modest additive effect. Five PDX models that presented PIK3CA mutation or intrinsic cetuximab resistance were treated with a combination of cetuximab and AZD8055. In vivo single-agent mTORC inhibition inhibited growth of one PIK3CA-mutant cancer, but had little effect on any PIK3CAWT or a second PIK3CA-mutant model. In all models, the combination therapy showed greater growth delay than monotherapy. The uniform ability of PI3K and mTORC inhibition to suppress the growth of HNSCC cells highlights the pathway's role in driving proliferation. Although single-agent therapy was largely ineffective in vivo, improved response of combination treatment in an array of PDXs suggests the potential for adding a catalytic mTORC inhibitor to cetuximab therapy. Overall, these results add to a growing body of evidence, suggesting that approaches that attempt to match biomarkers to the optimal therapy in HNSCC remain complex and challenging. Mol Cancer Ther; 16(7); 1257-68. ©2017 AACR.


Conflict of interest statement

Conflicts of interest: None

Figures

Figure 1
Figure 1. Characterization of HNSCC in vivo and in vitro models
A. HNSCC PDX cohort. HPV status: positive (+), negative (−). Genes assessed by mutational analysis. Green–no oncogenic mutation identified, yellow-previously reported oncogenic mutation in non-HNSCC cancer type, red-previously reported oncogenic mutation in HNSCC/major loss of function lesion detected. PTEN IHC: 1-low, 2-medium, 3-high, na-not evaluable. Tobacco use: green-never smoker, yellow-<20 pack years, red->20 pack years. Alcohol use: yellow-occasional, orange-moderate, red-heavy. T-stage: green-1, yellow-2, orange-3, red-4. Nodal involvement: black-positive, grey-negative. Recurrent: black-recurrent, grey-primary. B. PDX cohort response to cetuximab treatment by T/C ratio. Tumors were highlighted by both HPV and mutational status. C. HNSCC cell lines. A. HPV: black-HPV+, grey-HPV−. Genes assessed by mutational analysis. Green–no oncogenic mutation identified, yellow-previously reported oncogenic mutation in non-HNSCC cancer type, red-previously reported oncogenic mutation in HNSCC/major loss of function lesion detected. D. Immunoblot of EGFR/AKT/PIK3CA/mTORC pathway proteins of HNSCC cells. WCL were harvested from cells grown in normal growth media. Lane 2 of this blot has been cropped and replaced by a solid line as it illustrates an unrelated cell line. The complete, unedited blot is shown in Figure S5.
Figure 2
Figure 2. Effect of mTORC inhibitors and cetuximab on panel of HNSCC cell lines
A. Proliferation assay of AZD8055, BEZ-235, and cetuximab normalized to DMSO only control. HPV+ cell lines have open symbols; HPV− cell lines have closed symbols. Mean of three biological replicates with SEM error bars presented. B. Clonogenic expansion assay of panel of HNSCC cell lines with surviving fraction relative to DMSO for a given biological replicate. Mean surviving fraction of three biological replicates of quadruplicate wells shown. Error bar are SEM. C. DNA replication was measured by BrdU incorporation assay in the panel of HNSCC cells. Signal was normalized to DMSO controls, bars represent mean of quadruplicate wells, error bars are SD. D. Apoptosis was measured via Caspase 3/7 activity in a luciferase based assay. Data represent mean values of triplicate wells, error bars are SD.
Figure 3
Figure 3. Immunoblotting of drug molecular targets with paired clonogenic expansion data
Panel of HNSCC cell lines was assayed for molecular targets of mTORC inhibitors and cetuximab by western blot after 2hrs of drug exposure. Paired clonogenic expansion data is shown above each immunoblot array, single drug treatments shown in Figure 2B are repeated here for ease of viewing adjacent to immunoblots and combination treatments. Bars present mean surviving fraction of three biological replicates of quadruplicate wells shown, error bar are SEM. Statistical comparison made with one-way AVOVA with Tukey’s multiple comparison test; p-values: *<0.05, **<0.001, ***<0.0001, ****<0.00001, ns-not-significant.
Figure 4
Figure 4. SiRNA knock-down of mTORC, PIK3CA, and EGFR in HNSCC cell lines
Bar plots- growth inhibition assay to assess growth impact of siRNA KD. NT – non-targeting siRNA. 72hrs post transfection, counts normalized to NT. Bars represent mean of triplicate wells, error bars are SD. Immunoblot of total protein of targeted genes a 72 hrs after siRNA transfection at 25nM.
Figure 5
Figure 5. Combination mTORC/EGFR therapy of selected PDX models
A. Growth curves of five selected PDXs. Data points represent mean tumor volume (n=10–16 tumors/arm), error bars are SEM. Growth curves were compared over all days shown by repeated measures Friedman’s test with Dunn’s test for multiple comparison. P-values for Dunn’s test results for vehicle to each treatment arm: *<0.05, **<0.001, ***<0.0001, ****<0.00001, ns-not-significant. Adjacent IHC panel present FFPE tissues harvested 2 hrs post initial treatment of indicated therapeutics. Images shown are representative 20X field of overall staining. B. Proliferation and apoptosis markers for UWSCC-64 at conclusion of 14 days of treatment. Top row- Ki-67 IHC staining. Bottom row cleaved caspase 3. Images shown are 20X representative fields of overall staining. Ki-67 or cleaved caspase 3 positive cells were manually counted by a blinded individual in 2 high powered fields for two independent tumors. Columns present mean positive cells/field with SD error bars. One-way ANOVA with Tukey’s multiple comparison test was used to compare the different treatment arms (p-values: *<0.05, ns-not-significant).

References

    1. Cancer Facts and Figures 2016. Atlanta: American Cancer Society; 2016.
    1. Fakhry C, Zhang Q, Nguyen-Tan PF, Rosenthal D, El-Naggar A, Garden AS, et al. Human papillomavirus and overall survival after progression of oropharyngeal squamous cell carcinoma. J Clin Oncol. 2014;32(30):3365–73. - PMC - PubMed
    1. Ang KK, Harris J, Wheeler R, Weber R, Rosenthal DI, Nguyen-Tân PF, et al. Human papillomavirus and survival of patients with oropharyngeal cancer. N Engl J Med. 2010;363(1):24–35. - PMC - PubMed
    1. Chaturvedi AK, Engels EA, Anderson WF, Gillison ML. Incidence trends for human papillomavirus-related and -unrelated oral squamous cell carcinomas in the United States. J Clin Oncol. 2008;26(4):612–9. - PubMed
    1. Stein AP, Saha S, Yu M, Kimple RJ, Lambert PF. Prevalence of human papillomavirus in oropharyngeal squamous cell carcinoma in the United States across time. Chem Res Toxicol. 2014;27(4):462–9. - PMC - PubMed

MeSH terms

Substances