. 2017 Apr 27:23:2017-2028.
doi: 10.12659/msm.901542.

Mammalian Target of Rapamycin (mTOR) Regulates Transforming Growth Factor-β1 (TGF-β1)-Induced Epithelial-Mesenchymal Transition via Decreased Pyruvate Kinase M2 (PKM2) Expression in Cervical Cancer Cells

Affiliations

Mammalian Target of Rapamycin (mTOR) Regulates Transforming Growth Factor-β1 (TGF-β1)-Induced Epithelial-Mesenchymal Transition via Decreased Pyruvate Kinase M2 (PKM2) Expression in Cervical Cancer Cells

Ke-Yan Cheng et al. Med Sci Monit. .

Abstract

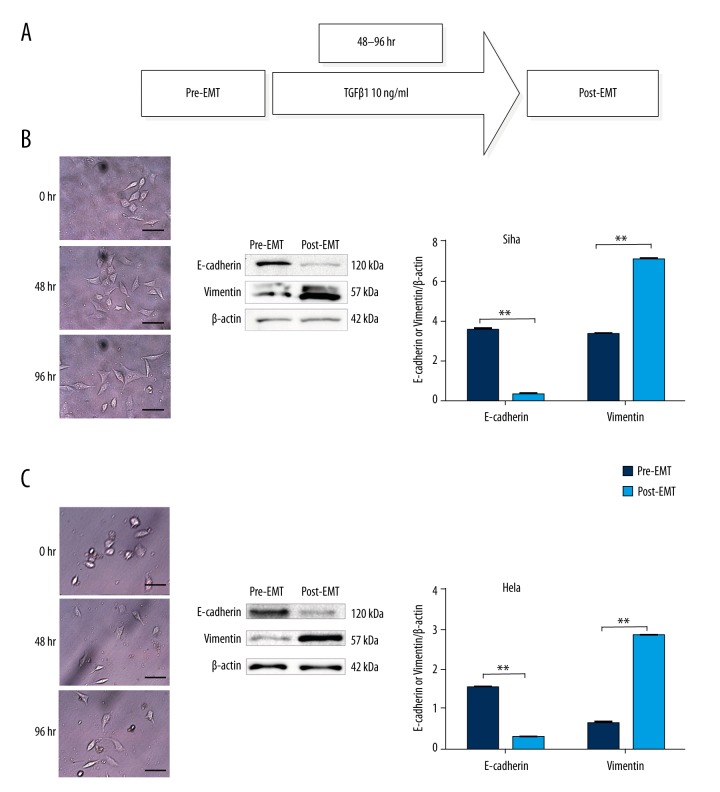
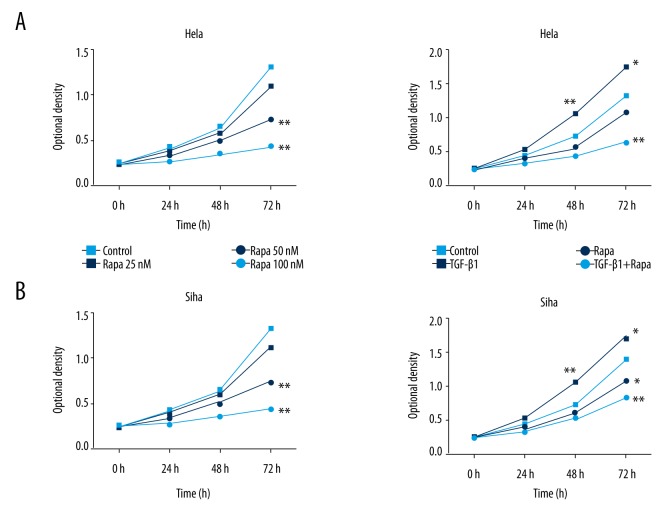
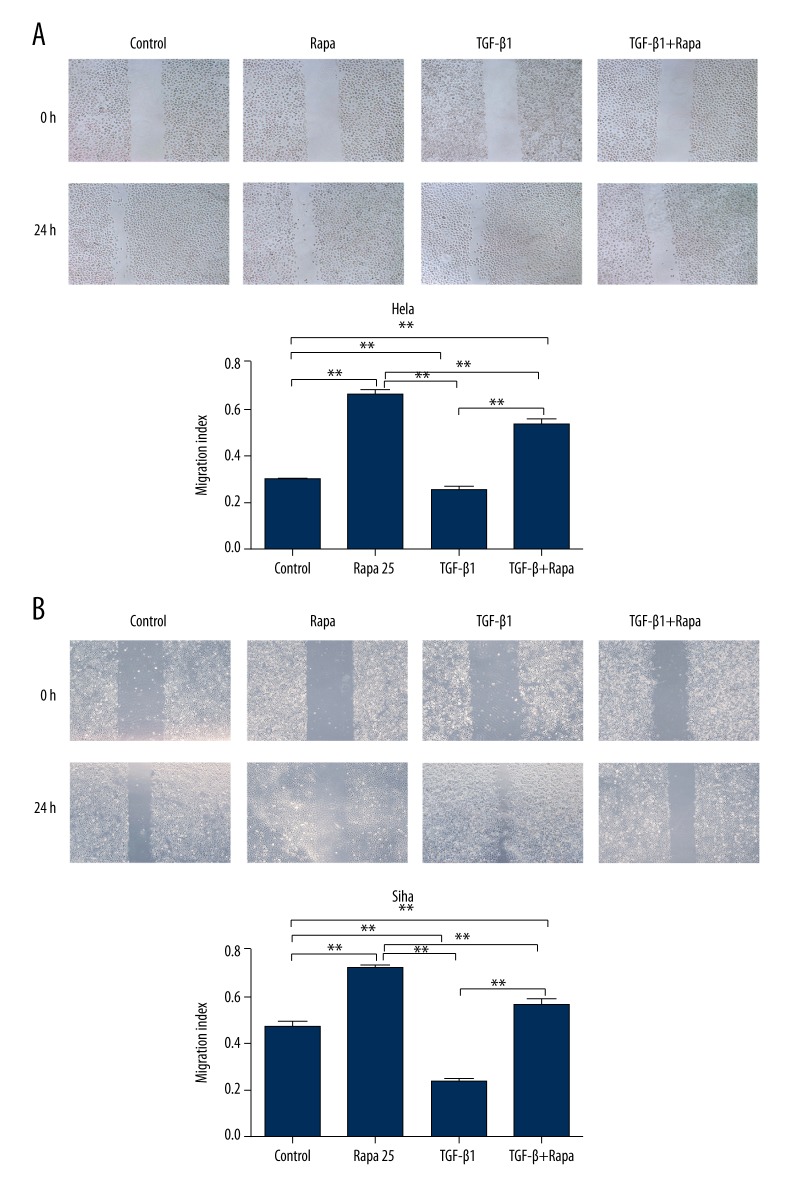
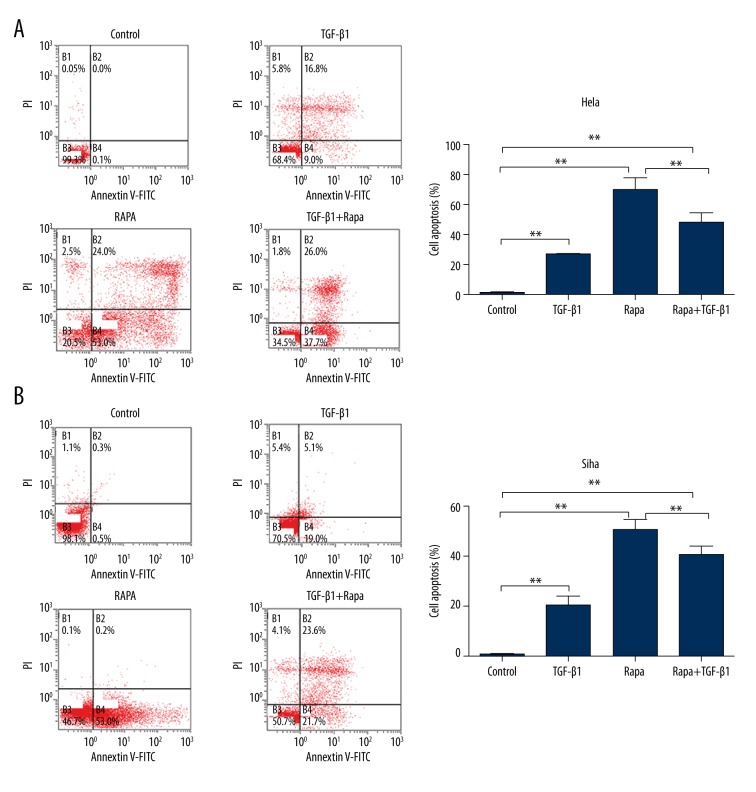
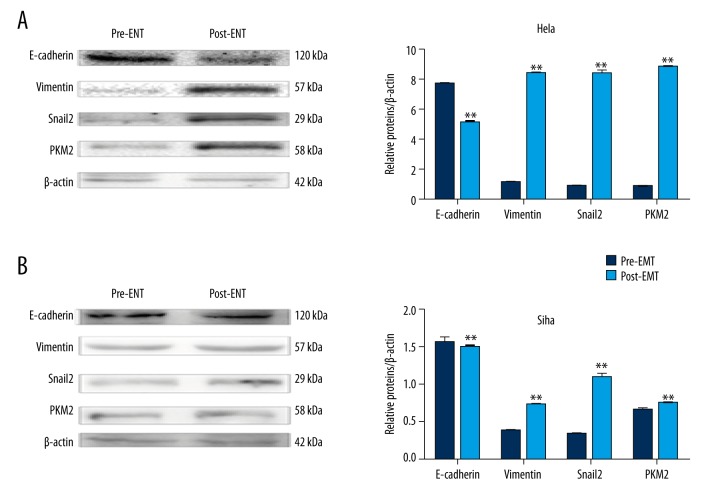
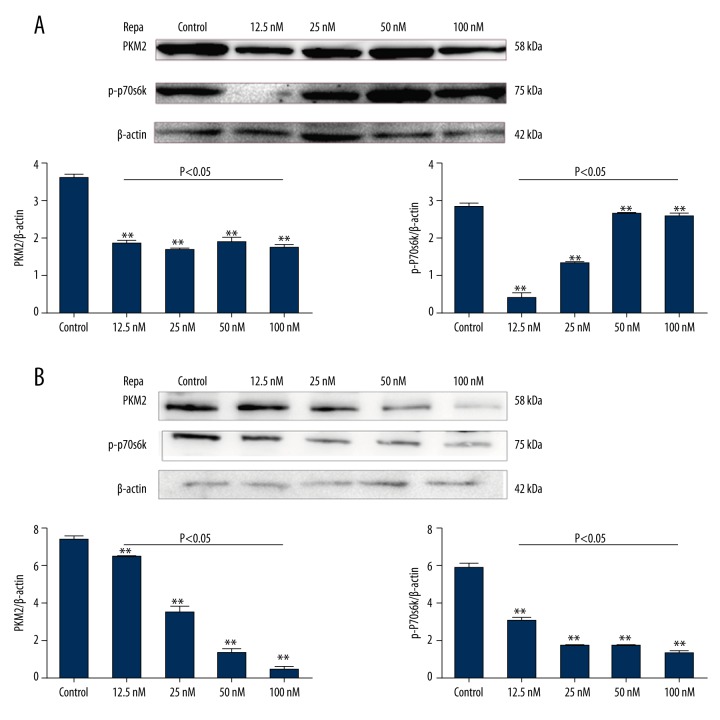
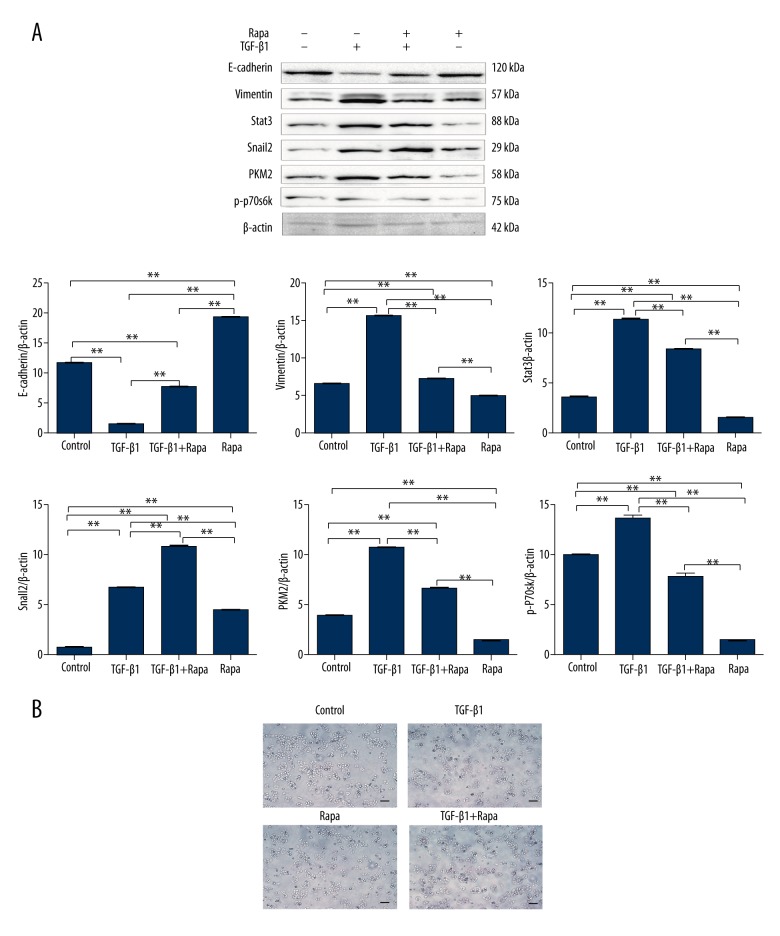
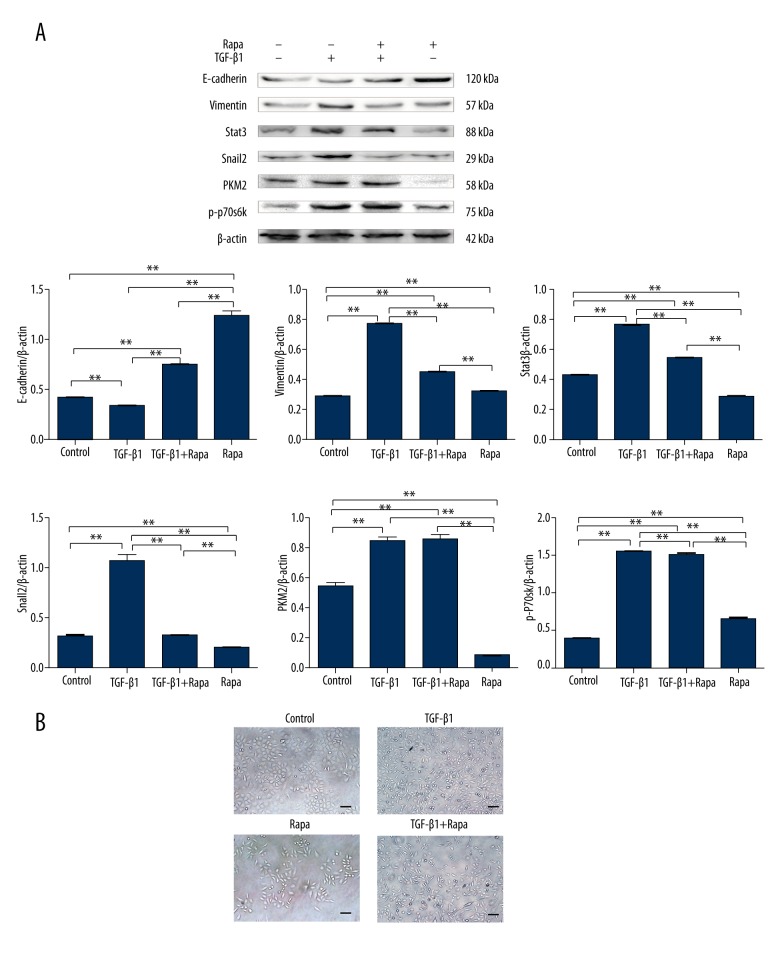
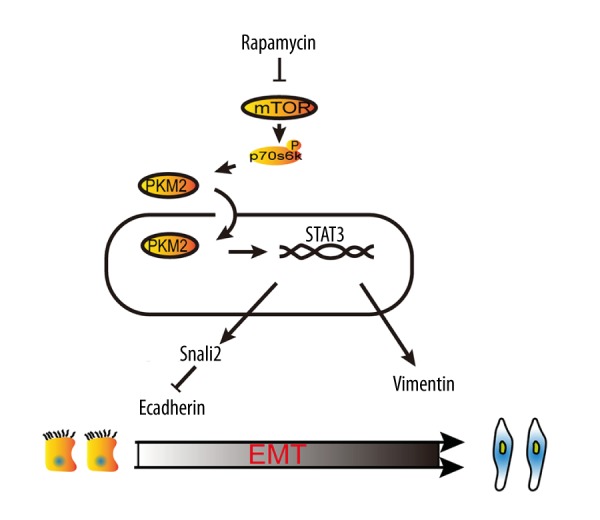
BACKGROUND Epithelial-mesenchymal transition (EMT) plays an important role in cancer tumorigenesis. Transforming growth factor β1 (TGF-β1) can induced EMT, which could increase tumor migration and invasion. Moreover, recent studies have been proven that mammalian target of rapamycin (mTOR) is a critical regulator of EMT. We investigated the mechanisms of mTOR in transforming growth factor β1 (TGF-β1)-induced EMT in cervical cancer cells. MATERIAL AND METHODS HeLa and SiHa cells were treated with 10 ng/ml TGF-β1 to induce EMT. Then, they were treated with or without rapamycin. CCK8 assay was performed to determine cell proliferation. Cell migration was detected by wound-healing assay; apoptosis was analyzed by flow cytometry; mTOR inhibitors inhibited mTOR pathway to assess the expression of E-cadherin, Vimentin STAT3, Snail2, p-p70s6k, and PKM2 expression. RESULTS TGF-β1 promoted proliferation and migration, and attenuated apoptosis in cervical carcinoma cells. Rapamycin abolished TGF-β1-induced EMT cell proliferation and migration and reversed TGF-β1-induced EMT. E-cadherin were suppressed, whereas Vimentin and PKM2 were increased in HeLa and SiHa cells after stimulation with TGF-β1. Moreover, mTOR was activated in the process of TGF-β1-induced EMT. Rapamycin inhibited the phosphorylation of p70s6k. Furthermore, inhibition of the mTOR pathway decreased PKM2 expression. CONCLUSIONS Inhibition of the mTOR pathway abolished TGF-β1-induced EMT and reduced mTOR/p70s6k signaling, which downregulated PKM2 expression. Our results provide novel mechanistic insight into the anti-tumor effects of inhibition of mTOR.


Conflict of interest statement

Conflicts of interest

The authors declare no conflicts of interest.

Figures

Figure 1
Figure 1
TGF-β1 induces EMT in cervical cancer cells. (A) Schematic representation of the procedure for EMT induction. The cells incubated for 48 h after seeding are defined as pre-EMT, and the cells treated with 10 ng/mL TGF-β1 are defined as post-EMT. (B, C) cell morphology and marker proteins were change in SiHa (B) and HeLa (C) cells. (Scale bar, 50 μm.) E-cadherin, Vimentin, and β-actin are shown by Western blot between the pre-EMT and post-EMT condition.
Figure 2
Figure 2
Rapamycin inhibits cell viability. HeLa (A) and SiHa (B) cells were treated with rapamycin (0–50 nM) for 24, 48, or 72 h, with or without 10 ng/ml TGF-β1. Cell numbers were measured by CCK-8 assays at indicated times. Data are means±S.D. Rapa: rapamycin; * p<0.05, ** p<0.01 vs. untreated cells.
Figure 3
Figure 3
Wound-healing assays. Rapamycin 50 nM with or without 10 ng/ml TGF-β1 treated HeLa (A) and SiHa (B) cells for 48 h. Representative images were obtained at 40× magnification. Graphs show the relative migration distance after 24-h incubation. Data are means ±S.D. Rapa: rapamycin; * p<0.05, ** p<0.01 vs. untreated cells.
Figure 4
Figure 4
Rapamycin induces and apoptosis. Rapamycin 50 nM with or without 10 ng/ml TGF-β1 treated HeLa (A) and SiHa (B) cells for 48 h. The cells were stained with PI and FITC-labelled Annexin V and subsequently underwent flow cytometry analysis to determine the percentage of apoptotic cells. Data are presented as the mean ± SD of 3 replicates per group. Rapa: rapamycin;* p<0.05, ** p<0.01 vs. untreated cells.
Figure 5
Figure 5
PKM2 expression was increased during the EMT condition. (A) HeLa and (B) SiHa cells were assessed for PKM2, E-cadherin, Vimentin, and Snail2 expression by Western blot in the pre- and post-EMT state. Post-EMT cells were harvested at 72 h. The data are presented as the mean ± SD of 3 replicates per group. * p<0.05, ** p<0.01 vs. untreated cells.
Figure 6
Figure 6
mTOR involving the regulation of PKM2 via stimulating mTOR/p70s6k/signaling. (A) Hela and (B) Siha cells were investigated p-p70s6k and PKM2 expression by Western blot, when SiHa and HeLa cells were treated with rapamycin.
Figure 7
Figure 7
Rapamycin reverses TGF-β1-induced EMT in HeLa cells involved in mTOR/p70s6k/PKM2 signaling pathways. (A) Cells were treated with TGF-β1, rapamycin, or both agents for 48 h. The protein expression of E-cadherin, SNAIL, STAT3, Vimentin, PKM2, p-p70s6k, and β-actin were assessed by Western blot. β-actin was used as a loading control. (B) The morphology of HeLa cells treated with TGF-β1, rapamycin, or both agents for 48 h. The cells were observed using phase-contrast microscopy at 200× magnification. Scale bar: 100 μm. The data are presented as the mean ±SD of 3 replicates per group. Rapa: rapamycin. * p<0.05, ** p<0.01 vs. untreated cells.
Figure 8
Figure 8
Rapamycin reverses TGF-β1-induced EMT in SiHa cells involved in mTOR/p70s6k/PKM2 signaling pathways. (A) Cells were treated with TGF-β1, rapamycin, or both agents for 48 h. The protein expression levels of E-cadherin, SNAIL, STAT3, PKM2, p-p70s6k, Vimentin, and β-actin were assessed by Western blot. β-actin was used as a loading control. (B) The morphology of SiHa cells treated with TGF-β1, rapamycin, or both agents for 48 h. The cells were observed using phase-contrast microscopy at 200× magnification. Scale bar: 100 μm. The data are presented as the mean ±SD of 3 replicates per group. Rapa: rapamycin. *p<0.05, ** p<0.01 vs. untreated cells.
Figure 9
Figure 9
Schematic representation of roles of rapamycin in TGF-β1-induced epithelial-to-mesenchymal transition in cervical carcinoma cells.

Similar articles

Cited by

References

    1. Lamouille S, Xu J, Derynck R. Molecular mechanisms of epithelial-mesenchymal transition. Nat Rev Mol Cell Biol. 2014;15(3):178–96. - PMC - PubMed
    1. Kalluri R, Weinberg RA. The basics of epithelial-mesenchymal transition. J Clin Invest. 2009;119(6):1420–28. - PMC - PubMed
    1. Maeda M, Johnson KR, Wheelock MJ. Cadherin switching: Essential for behavioral but not morphological changes during an epithelium-to-mesenchyme transition. J Cell Sci. 2005;118(5):873–87. - PubMed
    1. Voulgari A, Pintzas A. Epithelial-mesenchymal transition in cancer metastasis: mechanisms, markers and strategies to overcome drug resistance in the clinic. Biochim Biophys Acta. 2009;1796(2):75–90. - PubMed
    1. Zeisberg M, Neilson EG. Biomarkers for epithelial-mesenchymal transitions. J Clin Invest. 2009;119(6):1429–37. - PMC - PubMed

MeSH terms