. 2017 Apr 26;7(1):1176.
doi: 10.1038/s41598-017-01377-0.

Transcriptomic response of durum wheat to nitrogen starvation

Affiliations

Transcriptomic response of durum wheat to nitrogen starvation

Pasquale L Curci et al. Sci Rep. .

Abstract

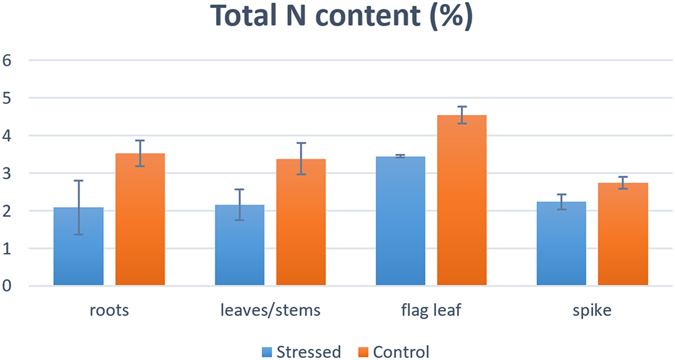
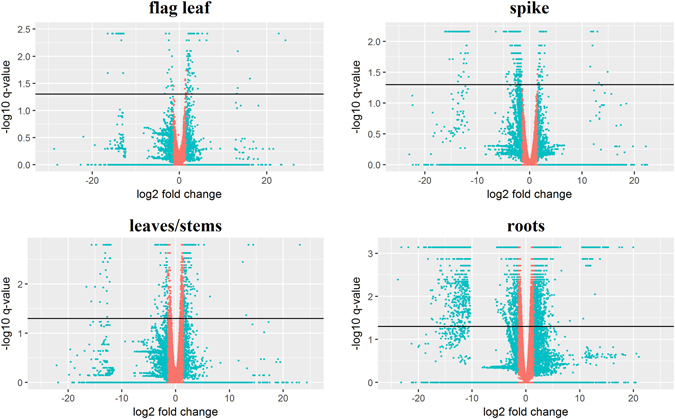
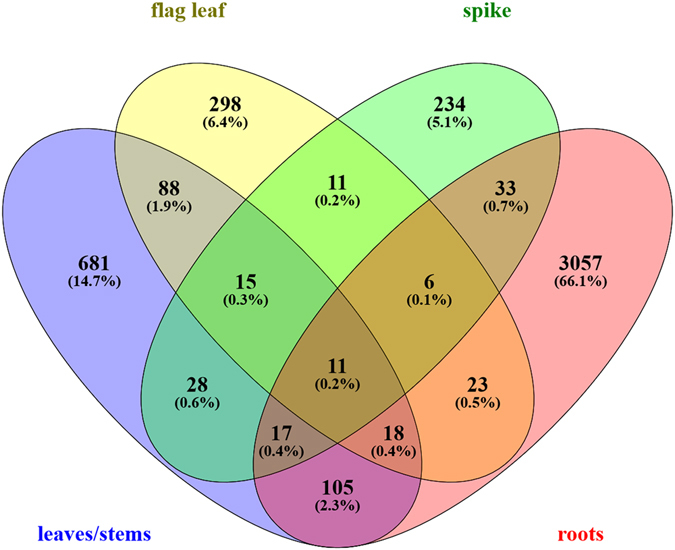
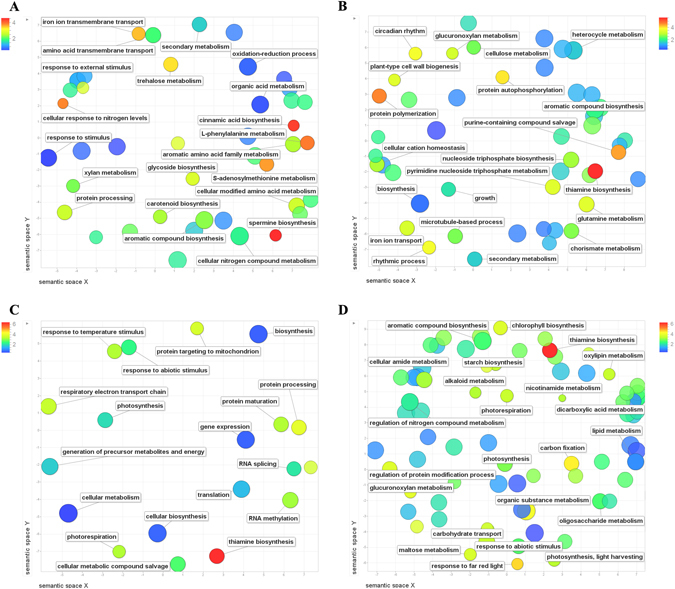
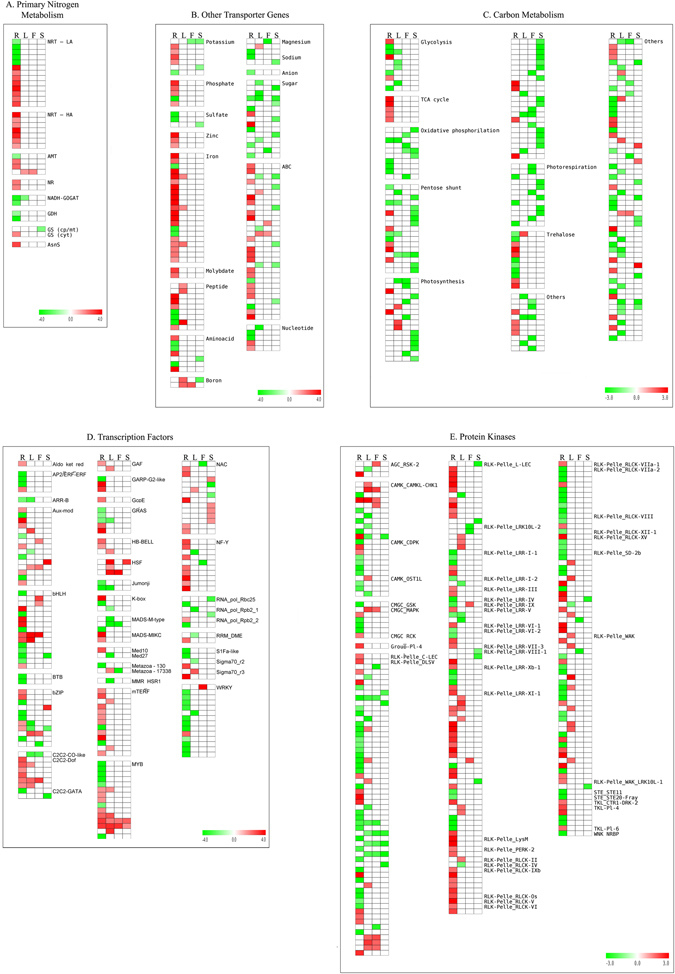
Nitrogen (N) is a key macronutrient representing a limiting factor for plant growth and development and affects productivity in wheat. In this study, durum wheat response to N chronic starvation during grain filling was investigated through a transcriptomic approach in roots, leaves/stems, flag leaf and spikes of cv. Svevo. Nitrogen stress negatively influenced plant height, tillering, flag leaf area, spike and seed traits, and total N content. RNA-seq data revealed 4,626 differentially expressed genes (DEGs). Most transcriptomic changes were observed in roots, with 3,270 DEGs, while 963 were found in leaves/stems, 470 in flag leaf, and 355 in spike tissues. A total of 799 gene ontology (GO) terms were identified, 180 and 619 among the upregulated and downregulated genes, respectively. Among the most addressed GO categories, N compound metabolism, carbon metabolism, and photosynthesis were mostly represented. Interesting DEGs, such as N transporters, genes involved in N assimilation, along with transcription factors, protein kinases and other genes related to stress were highlighted. These results provide valuable information about the transcriptomic response to chronic N stress in durum wheat, which could be useful for future improvement of N use efficiency.


Conflict of interest statement

The authors declare that they have no competing interests.

Figures

Figure 1
Figure 1
Total nitrogen (N) content detected in four tissues from durum wheat plants grown under standard (control) or N starvation (stressed) conditions. Values represent the N percentage relative to dry matter.
Figure 2
Figure 2
Volcano plot of the differentially expressed genes (DEGs) for each tissue investigated in this work. The y-axis corresponds to the mean expression value of -log10 (q-value), and the x- axis displays the log2 fold change value. The light blue dots represent up and downregulated DEGs, the pink dots denote not DEGs. The black bar indicates the q-value filtering.
Figure 3
Figure 3
Venn diagram showing overlap of differentially expressed genes between or among tissues. Root, leaves/stems, flag leaf and spike RNA libraries were obtained from durum wheat, Svevo cultivar, grown in nitrogen starvation (0 mM nitrogen), or in standard (2 mM nitrogen) conditions.
Figure 4
Figure 4
REVIGO semantic diagram summarizing enriched GO terms for roots (A), leaves/stems (B), flag leaf (C), and spike (D). Similar GO terms are placed close together in the plot. Bubble color indicates the log2 of the enrichment value for each category; circle size indicates the frequency of the GO term in GO database.
Figure 5
Figure 5
Heatmaps showing the expression patterns of genes involved in nitrogen stress response in durum wheat. Genes are grouped in five categories (A to E). Colours indicate the differential gene expression in nitrogen stressed tissues compared to non-treated plant tissues; green: downregulated, red: upregulated, white: not differentially expressed. R: roots, L: leaves/stems, F: flag leaf, S: spike.

References

    1. Masclaux-Daubresse C, et al. Nitrogen uptake, assimilation and remobilization in plants: challenges for sustainable and productive agriculture. Ann. Bot. 2010;105:1141–1157. doi: 10.1093/aob/mcq028. - DOI - PMC - PubMed
    1. Prinsi B, Negri AS, Pesaresi P, Cocucci M, Espen L. Evaluation of protein pattern changes in roots and leaves of Zea mays plants in response to nitrate availability by two-dimensional gel electrophoresis analysis. BMC Plant Biol. 2009;9:113. doi: 10.1186/1471-2229-9-113. - DOI - PMC - PubMed
    1. Hakeem KR, Ahmad A, Iqbal M, Gucel S, Ozturk M. Nitrogen-efficient rice cultivars can reduce nitrate pollution. Environ. Sci. Pollut. Res. 2011;18:1184–1193. doi: 10.1007/s11356-010-0434-8. - DOI - PubMed
    1. Gutierrez RA. Systems biology for enhanced plant nitrogen nutrition. Science. 2012;336:1673–1675. doi: 10.1126/science.1217620. - DOI - PubMed
    1. EPA. Methane and Nitrous Oxide Emissions from Natural Sources. U.S. Environmental Protection Agency. Washington, DC: EPA. 430R10001, https://nepis.epa.gov (2010).

Publication types

LinkOut - more resources