. 2017 Apr 26;7(1):1178.
doi: 10.1038/s41598-017-01348-5.

Three-dimensional modeling of single stranded DNA hairpins for aptamer-based biosensors

Affiliations

Three-dimensional modeling of single stranded DNA hairpins for aptamer-based biosensors

Iman Jeddi et al. Sci Rep. .

Abstract

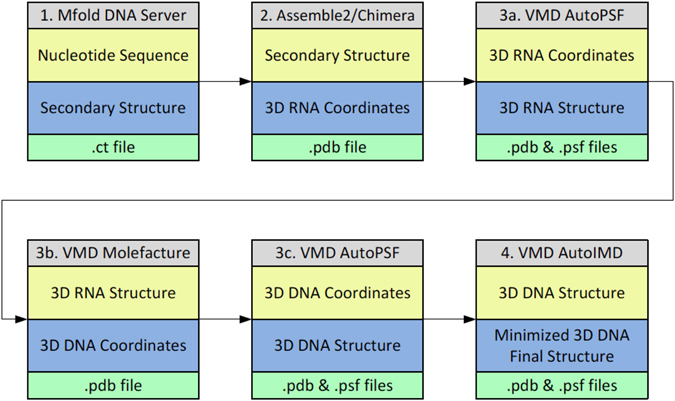
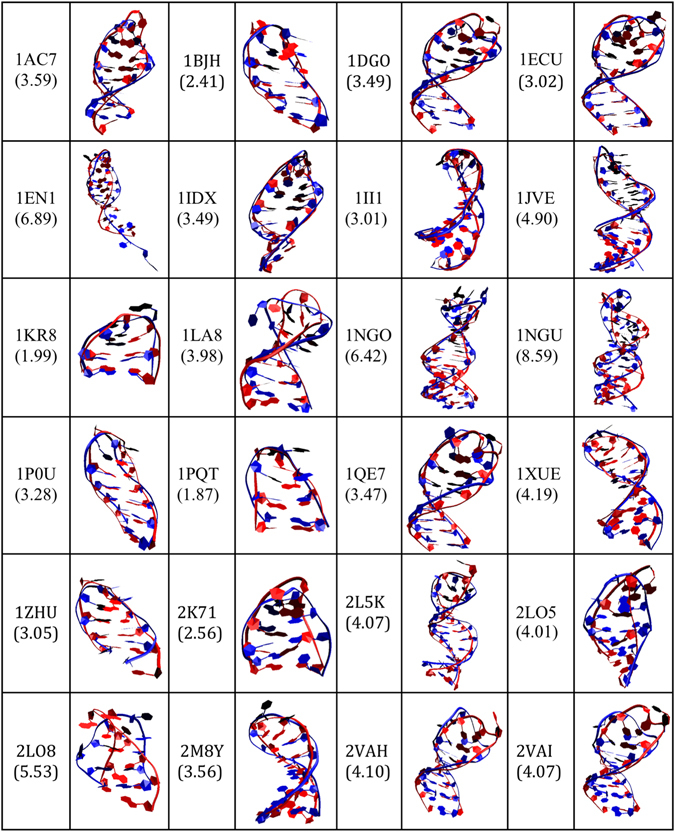
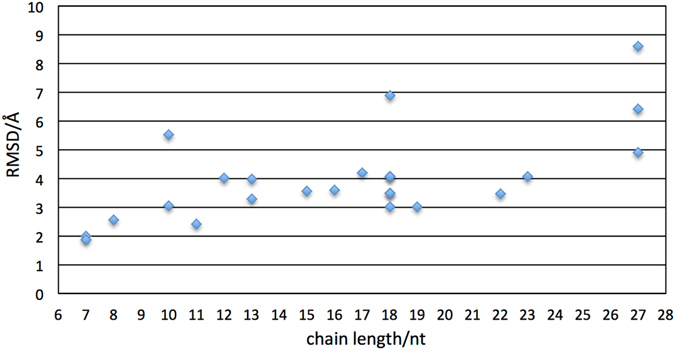
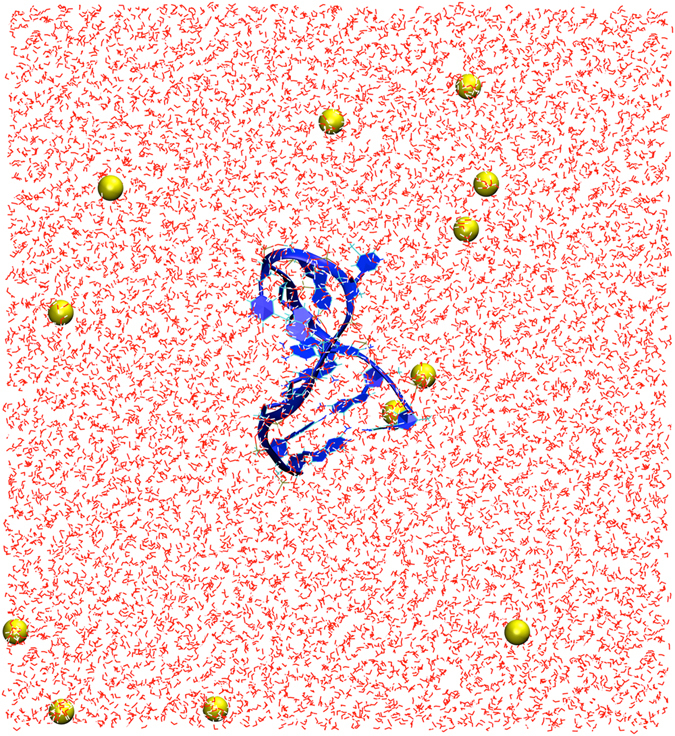
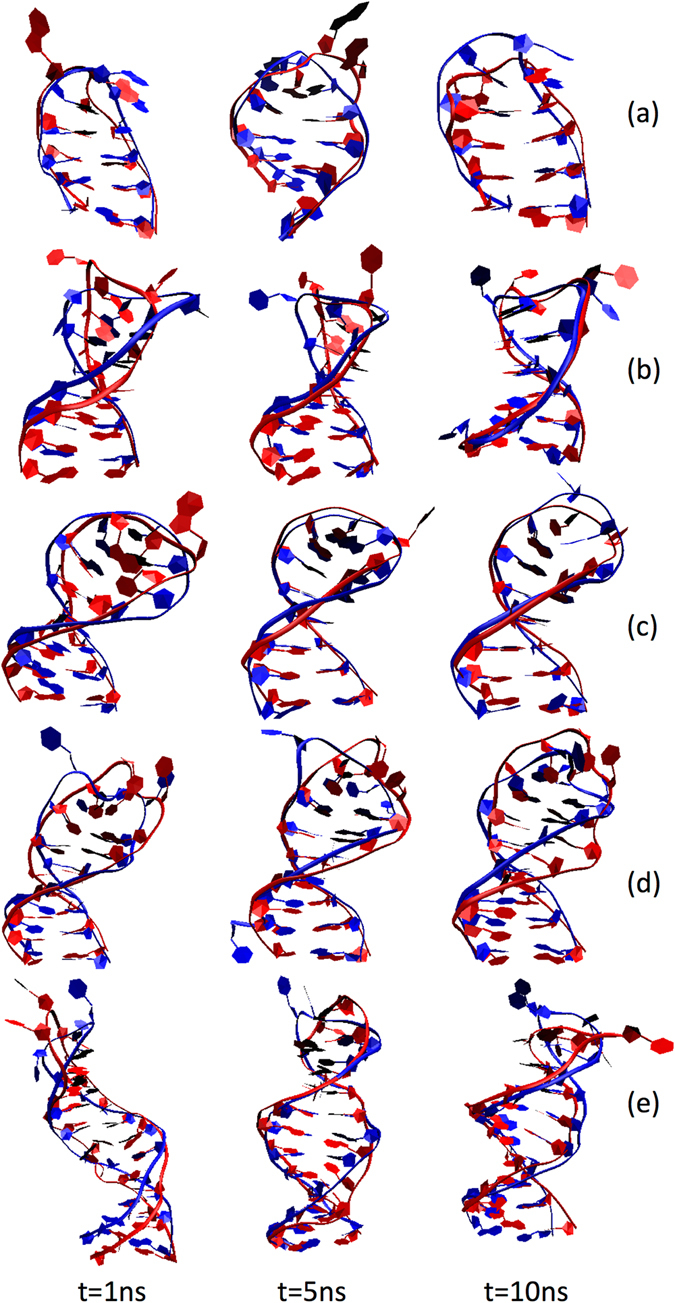
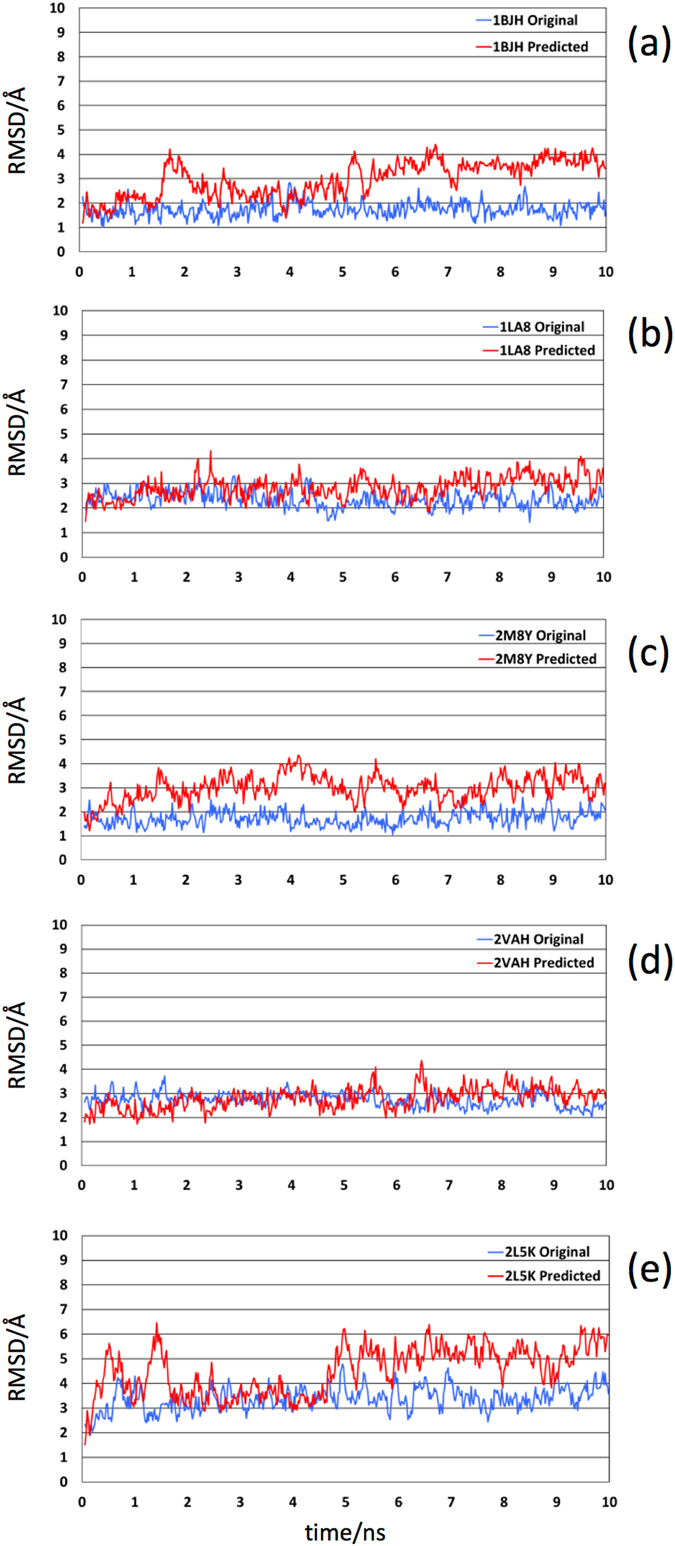
Aptamers consist of short oligonucleotides that bind specific targets. They provide advantages over antibodies, including robustness, low cost, and reusability. Their chemical structure allows the insertion of reporter molecules and surface-binding agents in specific locations, which have been recently exploited for the development of aptamer-based biosensors and direct detection strategies. Mainstream use of these devices, however, still requires significant improvements in optimization for consistency and reproducibility. DNA aptamers are more stable than their RNA counterparts for biomedical applications but have the disadvantage of lacking the wide array of computational tools for RNA structural prediction. Here, we present the first approach to predict from sequence the three-dimensional structures of single stranded (ss) DNA required for aptamer applications, focusing explicitly on ssDNA hairpins. The approach consists of a pipeline that integrates sequentially building ssDNA secondary structure from sequence, constructing equivalent 3D ssRNA models, transforming the 3D ssRNA models into ssDNA 3D structures, and refining the resulting ssDNA 3D structures. Through this pipeline, our approach faithfully predicts the representative structures available in the Nucleic Acid Database and Protein Data Bank databases. Our results, thus, open up a much-needed avenue for integrating DNA in the computational analysis and design of aptamer-based biosensors.


Conflict of interest statement

The authors declare that they have no competing interests.

Figures

Figure 1
Figure 1
Workflow used to construct the ssDNA 3D structures from the sequence. The approach consists of four main steps, involving building the ssDNA secondary structure from the sequence using Mfold (step 1), constructing refined equivalent 3D ssRNA models using Assemble2/Chimera (step 2), translating the 3D ssRNA models into ssDNA models using VMD (step 3), and refining the 3D ssDNA structures using VMD (step 4).
Figure 2
Figure 2
Overlay of the 3D predicted structures (ssDNA colored red) and the corresponding experimental structures downloaded from the PDB database (ssDNA colored blue) for the 24 ssDNA hairpin structures. Each structure is labeled by its corresponding PDB ID and the calculated RMSD values (in Angstroms) are shown in parenthesis.
Figure 3
Figure 3
Values of the RMSD for the 24 ssDNA predicted structures with respect to the experimental ones as a function of the nucleotide chain length.
Figure 4
Figure 4
Initial configuration of the MD simulation of the predicted 3D ssDNA structure for the sequence CGCGGTGTCCGCG, corresponding to 1LA8. Only the molecules within the central simulation cell are shown. The ssDNA molecule was solvated in water and the system charge neutralized with 12 sodium ions. The atoms of the water molecules are represented as white (hydrogen) and red (oxygen) lines and the sodium ions are displayed as yellow spheres with radii corresponding to its atomic van der Waals radius. The ssDNA molecule is shown in blue with the backbone and bases represented as new ribbons and the additional components represented as lines. The unit cell dimensions are L x = 72 Å, L y = 72 Å, and L z = 78 Å.
Figure 5
Figure 5
Evolution of the ssDNA molecules as a function of time. The overlays of the predicted structures taken from the MD simulations (ssDNA colored red) and the corresponding experimental structures downloaded from the PDB database (ssDNA colored blue) correspond to (a) 1BJH, (b) 1LA8, (c) 2M8Y, (d) 2VAH, and (e) 2L5K. The snapshots for the predicted ssDNA molecules correspond to (from left to right) 1 ns, 5 ns, and 10 ns. The corresponding RMSD values are summarized in Table 3. Water molecules and ions within the simulation cell are not shown.
Figure 6
Figure 6
Time evolution of the RMSDs for the sugar-phosphate backbone with respect to the structures at time 0 for the predicted (red curves) and original (blue curves) structures. The panels correspond to (a) 1BJH, (b) 1LA8, (c) 2M8Y, (d) 2VAH, and (e) 2L5K.

References

    1. Karlsson AC, et al. Comparison of the ELISPOT and cytokine flow cytometry assays for the enumeration of antigen-specific T cells. Journal of immunological methods. 2003;283:141–153. doi: 10.1016/j.jim.2003.09.001. - DOI - PubMed
    1. Cox JH, Ferrari G, Janetzki S. Measurement of cytokine release at the single cell level using the ELISPOT assay. Methods. 2006;38:274–282. doi: 10.1016/j.ymeth.2005.11.006. - DOI - PubMed
    1. Tuleuova N, et al. Development of an aptamer beacon for detection of interferon-gamma. Analytical chemistry. 2010;82:1851–1857. doi: 10.1021/ac9025237. - DOI - PubMed
    1. Jayasena SD. Aptamers: an emerging class of molecules that rival antibodies in diagnostics. Clinical chemistry. 1999;45:1628–1650. - PubMed
    1. Liu J, Cao Z, Lu Y. Functional nucleic acid sensors. Chemical reviews. 2009;109:1948–1998. doi: 10.1021/cr030183i. - DOI - PMC - PubMed

Publication types

MeSH terms