. 2017 Apr 26;7(1):1179.
doi: 10.1038/s41598-017-01325-y.

Therapeutic effects of anti-HMGB1 monoclonal antibody on pilocarpine-induced status epilepticus in mice

Affiliations

Therapeutic effects of anti-HMGB1 monoclonal antibody on pilocarpine-induced status epilepticus in mice

Li Fu et al. Sci Rep. .

Abstract

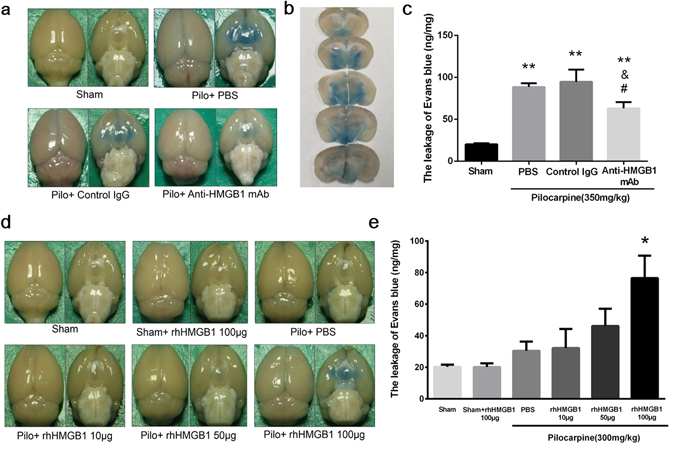
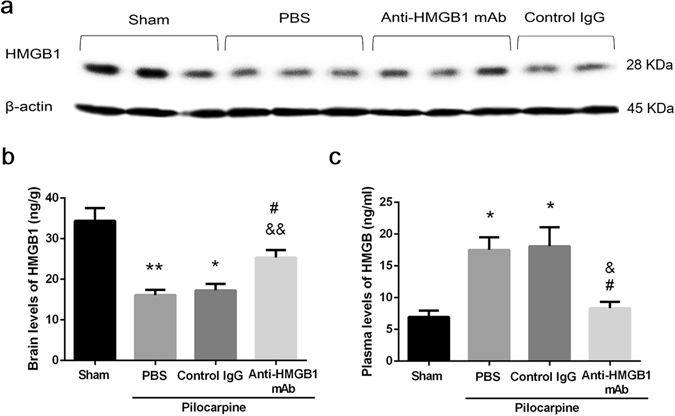
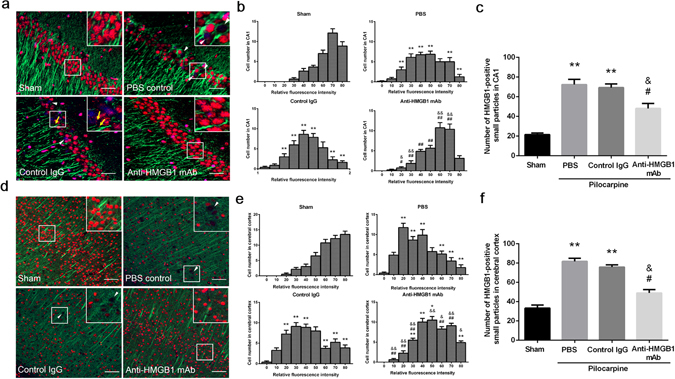
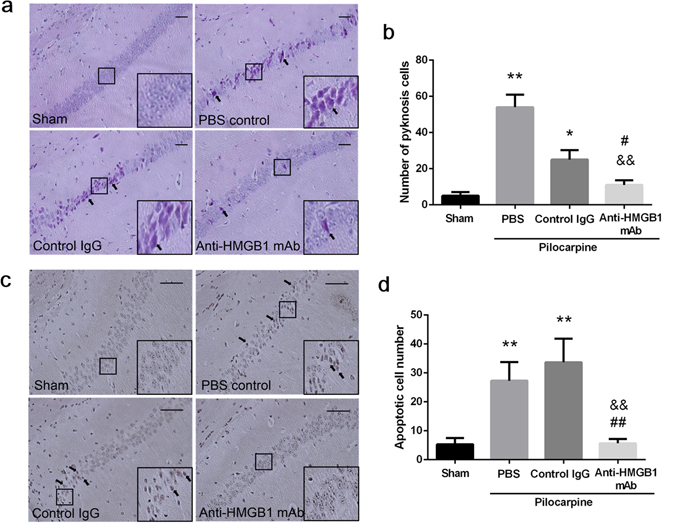
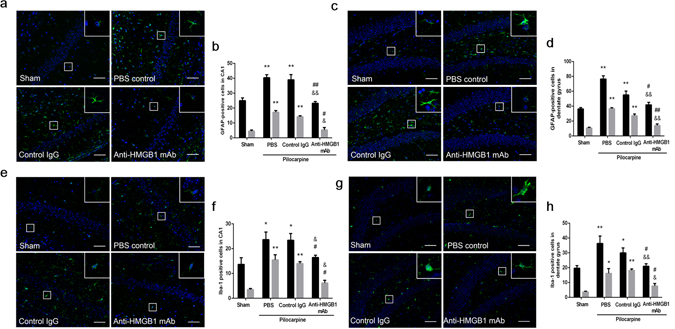
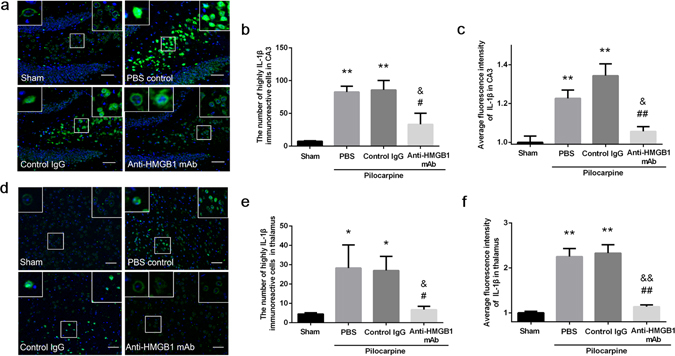
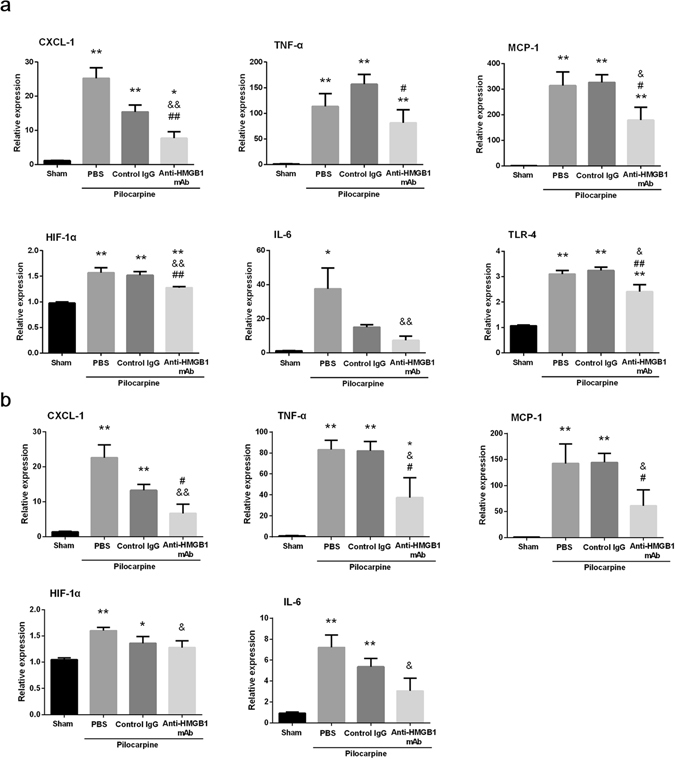
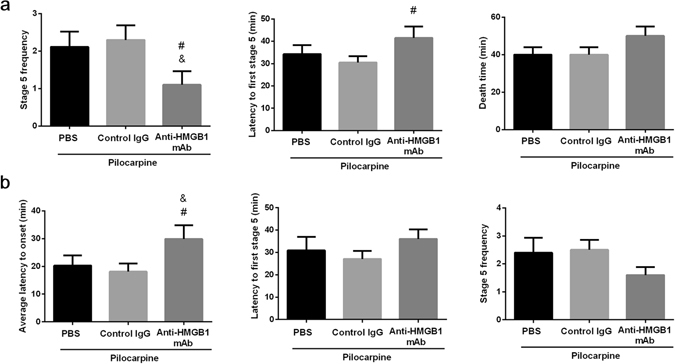
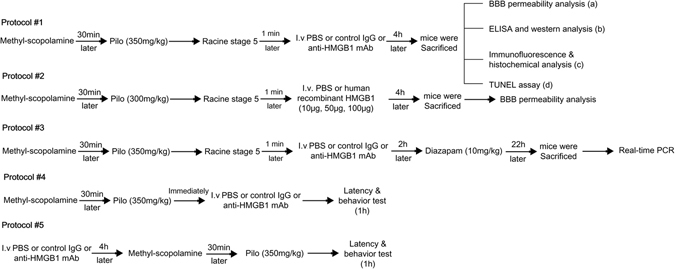
Inflammatory processes in brain tissue have been described in human epilepsy of various etiologies and in experimental models of seizures. High mobility group box-1 (HMGB1) is now recognized as representative of damage-associated molecular patterns (DAMPs). In the present study, we focused on whether anti-HMGB1 antibody treatment could relieve status epilepticus- triggered BBB breakdown and inflammation response in addition to the seizure behavior itself. Pilocarpine and methyl-scopolamine were used to establish the acute seizure model. Anti-HMGB1 mAb showed inhibitory effects on leakage of the BBB, and on the HMGB1 translocation induced by pilocarpine. The expression of inflammation-related factors, such as MCP-1, CXCL-1, TLR-4, and IL-6 in hippocampus and cerebral cortex were down-regulated by anti-HMGB1 mAb associated with the number of activated astrocytes, microglial cells as well as the expression of IL-1β. Both hematoxylin & eosin and TUNEL staining showed that the apoptotic cells could be reduced after anti-HMGB1 mAb treatment. The onset and latency of Racine stage five were significantly prolonged in the anti-HMGB1 mAb group. These results suggested that anti-HMGB1 mAb prevented the BBB permeability, reduced HMGB1 translocation while inhibiting the expression of inflammation-related factors, protected against neural cell apoptosis and prolonged Racine stage 5 seizure onset and latency.


Conflict of interest statement

The authors declare that they have no competing interests.

Figures

Figure 1
Figure 1
Effect of anti-HMGB1 mAb on BBB permeability in pilocarpine-induced acute status epilepticus. The permeability of brain capillary vessels was examined by intravenously injecting Evans blue (100 mg/kg, i.v.). Anti-HMGB1 mAb (1 mg/kg), control IgG, PBS was administered intravenously to mice which reached Racine stage 5 after onset of epilepsy (a). The distribution of Evans blue in brain were significantly shown in thalamus and hypothalamus region (b). The leakage of Evans blue into the brain parenchyma was quantified at 4 h after anti-HMGB1, control IgG or PBS injection, and the results are expressed as the means ± SEM of 5 mice. **p < 0.01, &p < 0.05 and #p < 0.05 vs. Sham, PBS and Control IgG, respectively (c). The effects of intravenous administration of different concentrations of exogenous rhHMGB1 on BBB permeability after pilocarpine treatment are shown (d). The results were expressed as the means ± SEM of 7 mice. *p < 0.05 compared with Pilo + HMGB1 100 μg (e).
Figure 2
Figure 2
Dynamic changes of HMGB1 content in brain and plasma in pilocarpine-induced acute status epilepticus. The content of HMGB1 in the cerebrum was measured by Western blotting 4 h after anti-HMGB1, control IgG or PBS injection. The β-actin was used as a reference protein. Representative results are shown for each group of 2–3 mice (a). The brain levels of HMGB1 are shown as the means ± SEM of 9 mice. *p < 0.05, **P < 0.01 compared with the sham control, &&p < 0.01 compared with the PBS control, #p < 0.05 compared with the control IgG group (b). Plasma levels of HMGB1 were determined by ELISA at 4 h after onset of seizure . The results are shown as the means ± SEM of 9 mice. *p < 0.05 compared with the sham control, &p < 0.05 compared with the PBS control, #p < 0.05 compared with the control IgG group (c).
Figure 3
Figure 3
The translocation and release of HMGB1 in neurons in pilocarpine-induced acute status epilepticus. Anti-HMGB1 mAb, control IgG or PBS was administered to stage 5 epileptic mice, and the brains were fixed 4 h later. The CA1 hippocampal region (a) and cerebral cortex (b) were double-stained with anti-HMGB1 and anti-MAP2 antibodies, followed by Alexa Fluor 555-labeled and Alexa Fluor 488-labeled secondary antibodies, respectively. Scale bars equal 30 μm (a) and 50 μm (d), respectively. Arrowheads (white) indicate the neurons with marked decrease in HMGB1 fluorescence intensity in nuclei. Arrows (yellow) indicate the HMGB1-positive small particles released from nuclei (a). The fluorescent intensity of HMGB1 in nuclei was graded into 9 levels and the cell numbers with the indicated fluorescent levels were counted (b,e). The total number of HMGB1-positive small particles were also counted in each group (c,f). The results are shown as the means ± SEM of 8 mice. **p < 0.01 compared with the corresponding sham control. &p < 0.05, &&p < 0.01 compared with PBS control. #p < 0.05, ##p < 0.01 compared with the control IgG group (b,c,e,f).
Figure 4
Figure 4
Histological analysis of neuron degeneration and apoptosis in the CA1 hippocampal region in acute status epilepticus mice. The brains were fixed with formalin at 4 h after anti-HMGB1, control IgG or PBS administration, and paraffin-embedded sections were stained with hematoxylin-eosin. Arrows indicate typical pyknotic cells. Scale bars equal 50 μm. *p < 0.05, **p < 0.01 compared with the sham. &&P < 0.01 compared with the PBS control. #p < 0.05 compared with the control IgG group (a). The number of pyknotic cells was counted in each mouse and the results are shown as the means ± SEM of 8 mice (b). Apoptotic cells were detected by TUNEL staining. The arrows indicate the apoptotic cells (c). The number of apoptotic cells in the CA1 region was counted in each mouse and the results are shown as the means ± SEM of 8 mice. **p < 0.01 compared with the sham control. &&p < 0.01 compared with the PBS control. ##p < 0.01 compared with the control IgG group (d).
Figure 5
Figure 5
Morphological changes of astrocytes and microglia cells in the hippocampus and dentate gyrus of mice under acute status epilepticus. Anti-HMGB1 mAb, control IgG or PBS was immediately administered to mice reached Racine stage 5 and sacrificed 4 h later. The brain sections were stained with anti-GFAP (green) and DAPI (blue). The total number and activated astrocytes in the CA1 (a) and dentate gyrus (c) were counted in each group and the results are shown as the means ± SEM of 8 mice. Black bar showed the total number of astrocytes and the gray bar showed the number of activated astrocytes. **p < 0.01 compared with the sham control. &p < 0.05, &&p < 0.01 compared with the PBS control. #p < 0.05, ##p < 0.01 compared with the control IgG group (b). **p < 0.01 compared with the sham control. &&p < 0.01 compared with the PBS control. #p < 0.05, ##p < 0.01 compared with the control IgG group (d). The brain sections were stained with anti-Iba1 (green) and DAPI (blue). The total number and active/amoeboid Iba1-positive cells were counted in the hippocampus (e) and dentate gyrus (g) in each group and the results are shown as the means ± SEM of 8 mice. *p < 0.05, **p < 0.01 compared with the sham control. &p < 0.05 compared with the PBS control. #p < 0.05 compared with the control IgG group (f). **p < 0.01, **p < 0.05 compared with the sham control. &p < 0.05, &&p < 0.01 compared with the PBS control. #p < 0.05 compared with the control IgG group (h). Scale bars equal 50 μm.
Figure 6
Figure 6
Expression of IL-1β in the CA3 hippocampal region and the thalamus of mice under acute status epilepticus. Anti-HMGB1 mAb, control IgG or PBS was administered intravenously when mice reach Racine stage 5 by pilocarpine administration and sacrificed 4 h later. The brains were fixed by formalin and paraffin-embedded sections were stained with anti-IL-1β antibody. The hippocampal CA3 (a) and thalamus region (d) were under observation. The number of highly IL-1β immunoreactive cells (b) and the fluorescence intensity (c) were analyzed in hippocampus CA3. **p < 0.01 compared with the sham group. &p < 0.05 compared with the PBS group. ##p < 0.01, #p < 0.05 compared with the control IgG group. The results are shown as the means ± SEM of 8 mice. The number of highly IL-1β immunoreactive cells (e) and the fluorescence intensity (f) were analyzed in thalamus. The results are shown as the means ± SEM of 8 mice. **p < 0.01, *p < 0.05 compared with sham group. &&p < 0.01, &p < 0.05 compared with the PBS group. ##p < 0.01, #p < 0.05 compared with the control IgG group (d). Scale bars equal 50 μm.
Figure 7
Figure 7
Determination of the expression of inflammation-related molecules by quantitative real-time PCR in the hippocampus (a) and cerebral cortex (b) in mice with pilocarpine-induced acute status epilepticus. Anti-HMGB1, control IgG or PBS was administered intravenously when mice reached Racine stage 5 after pilocarpine. Brain samples were collected 24 h after antibody administration. The results were normalized to the expression of GAPDH and are expressed as the means ± SEM of 11 mice. *p < 0.05, **p < 0.01 compared with the sham group. &p < 0.05, &&P < 0.01 compared with the PBS control. #p < 0.05, ##p < 0.01 compared with the control IgG group (a,b).
Figure 8
Figure 8
The pre-treatment and post-treatment of anti-HMGB1 mAb on acute seizure behavior. Pre-treatment: Anti-HMGB1 mAb, control IgG or PBS was administered intravenously 4 h before pilocarpine (350 mg/kg, i.v.) injection. All data were collected in 60 min after pilocarpine treatment. The frequency of seizure stage 5, latency to stage 5 and the time to death were determined on each mouse. The results are shown as the means ± SEM of 9 mice. &p < 0.05, compared with the PBS control. #p < 0.05, compared with the control IgG group (a). Post-treatment: anti-HMGB1 mAb, control IgG or PBS were immediately injected after pilocarpine injection, and behavior test were observed under 60 min observation. The latency to onset and stage 5 and the frequency of stage 5 were determined on each mouse. The results are shown as the means ± SEM of 11 mice. &p < 0.05, compared with the PBS control. #p < 0.05, compared with the control IgG group (b).
Figure 9
Figure 9
A schematic of the experimental design, drug doses and subsequent processes. Protocol #1: Racine stage 5 seizures were induced by pilocarpine which were then treated with PBS, control IgG or anti-HMGB1 mAb for 4 h, then sacrificed, and examined for the BBB permeability, the translocation of HMGB1 (a,b,c), and the apoptosis cells under acute status epilepticus (d). Protocol #2: Mice were administered 10, 50, or 100 μg of human recombinant HMGB1 for 4 h under status epilepticus condition, then BBB permeability was determinated by Evans blue again. Protocol #3: Epileptic mice were treated with PBS or control IgG or anti-HMGB1 mAb for 24 h, then subjected to RT-PCR analyses. Protocol #4: Mice were injected with pilocarpine and either PBS, control IgG or anti-HMGB1 mAb, then immediately subjected to a seizure latency test, followed by a behavior test under 1 h post-treatment. Protocol #5: Mice were pretreated with PBS, control IgG or anti-HMGB1 mAb for 4 h before pilocarpine induction followed by behavior and latency test in 1 hour.

References

    1. Jacobs MP, et al. Curing epilepsy: progress and future directions. Epilepsy Behav. 2009;14:438–445. doi: 10.1016/j.yebeh.2009.02.036. - DOI - PMC - PubMed
    1. Hesdorffer DC, et al. Research implications of the Institute of Medicine Report, Epilepsy Across the Spectrum: Promoting Health and Understanding. Epilepsia. 2013;54:207–216. doi: 10.1111/epi.12056. - DOI - PMC - PubMed
    1. Knake S, Hamer HM, Rosenow F. Status epilepticus: a critical review. Epilepsy Behav. 2009;15:10–14. doi: 10.1016/j.yebeh.2009.02.027. - DOI - PubMed
    1. Holmes GL. Seizure-induced neuronal injury: animal data. Neurology. 2002;59:S3–6. doi: 10.1212/WNL.59.9_suppl_5.S3. - DOI - PubMed
    1. Duncan JS. Seizure-induced neuronal injury: human data. Neurology. 2002;59:S15–20. doi: 10.1212/WNL.59.9_suppl_5.S15. - DOI - PubMed

Publication types

MeSH terms