. 2017 Apr 26;7(1):1181.
doi: 10.1038/s41598-017-01277-3.

Imaging of underground cavities with cosmic-ray muons from observations at Mt. Echia (Naples)

Affiliations

Imaging of underground cavities with cosmic-ray muons from observations at Mt. Echia (Naples)

G Saracino et al. Sci Rep. .

Abstract

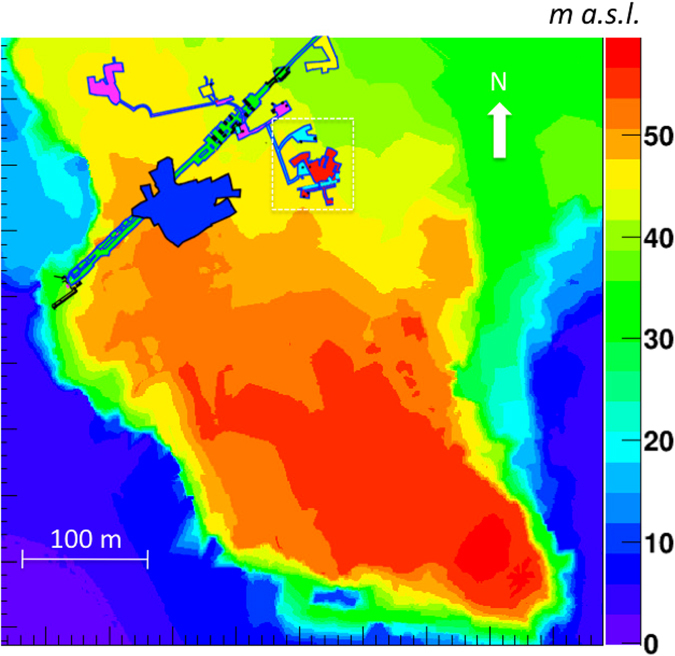
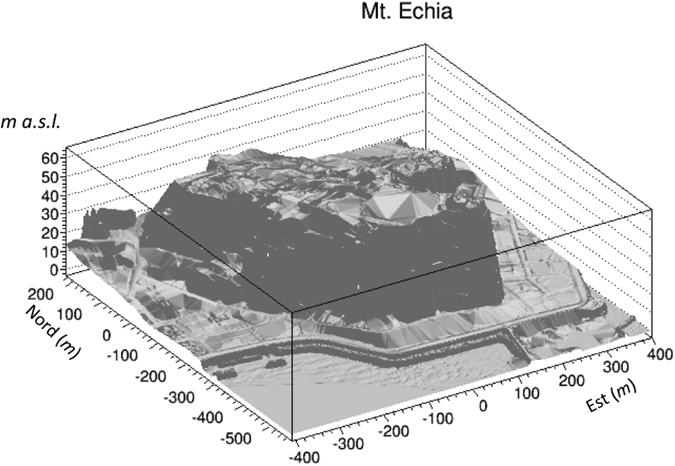
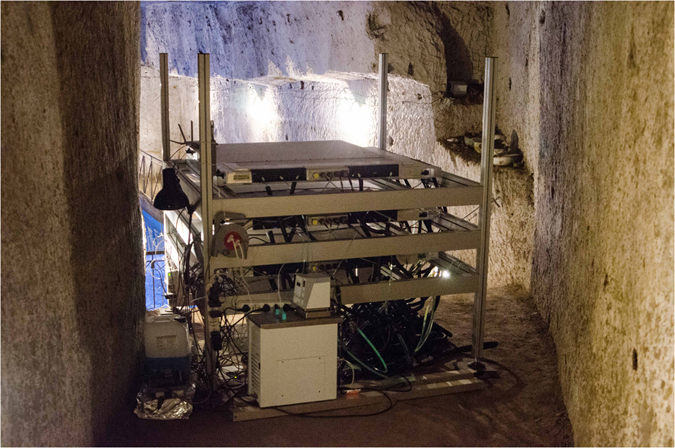
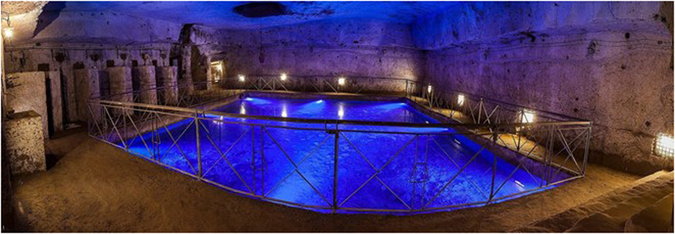
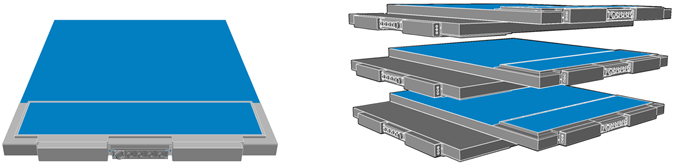
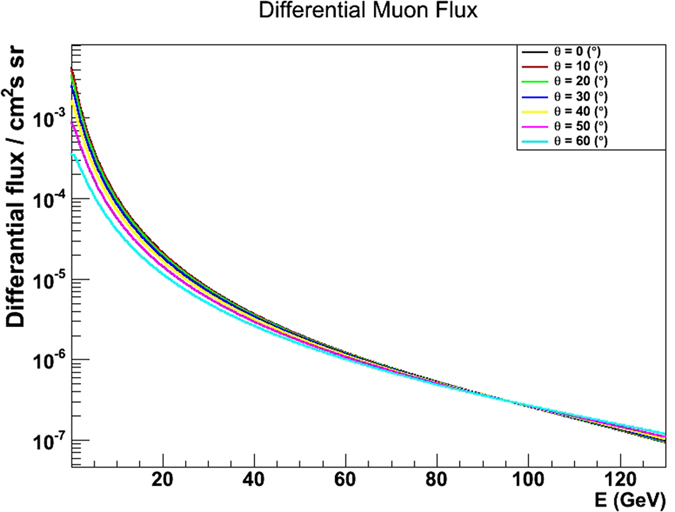
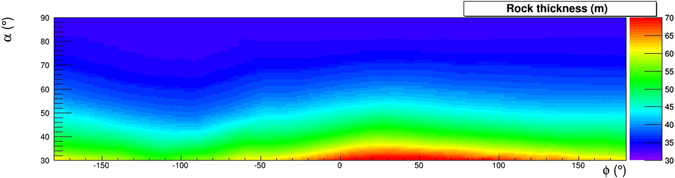
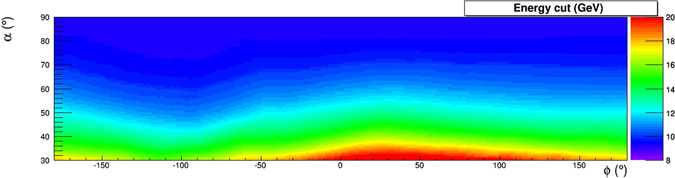
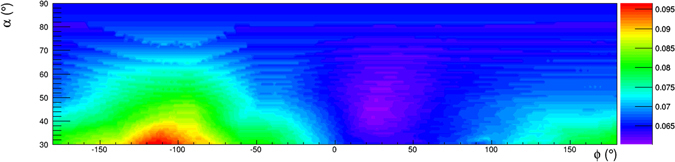
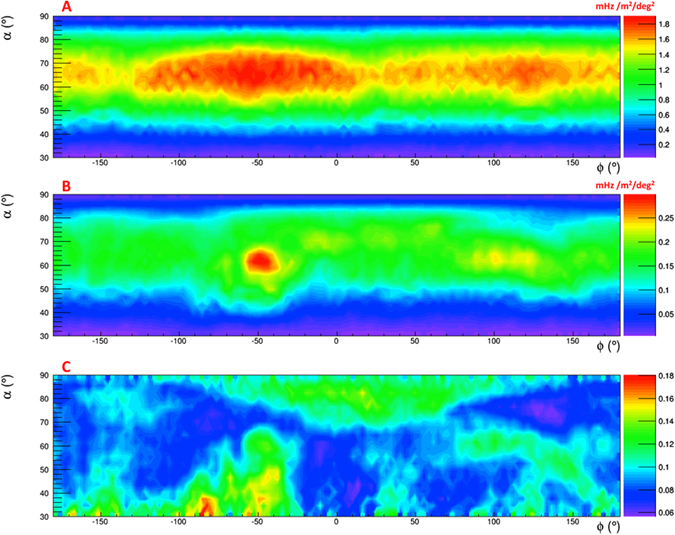
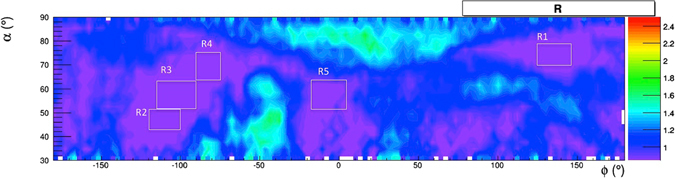
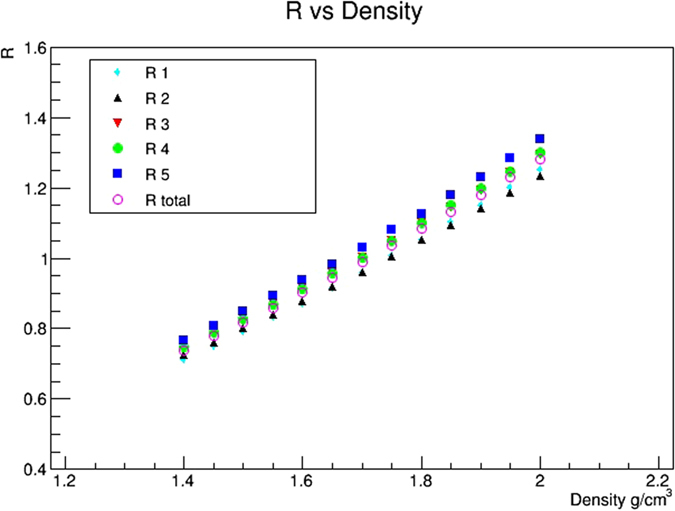
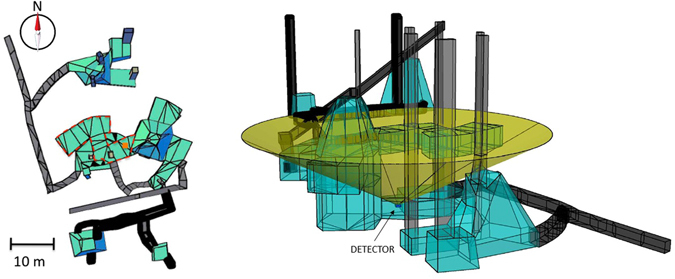
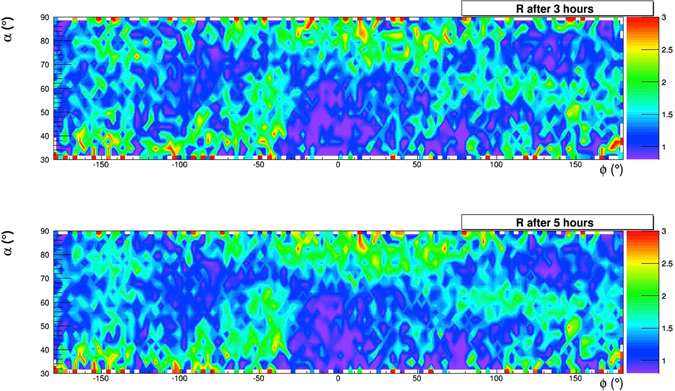
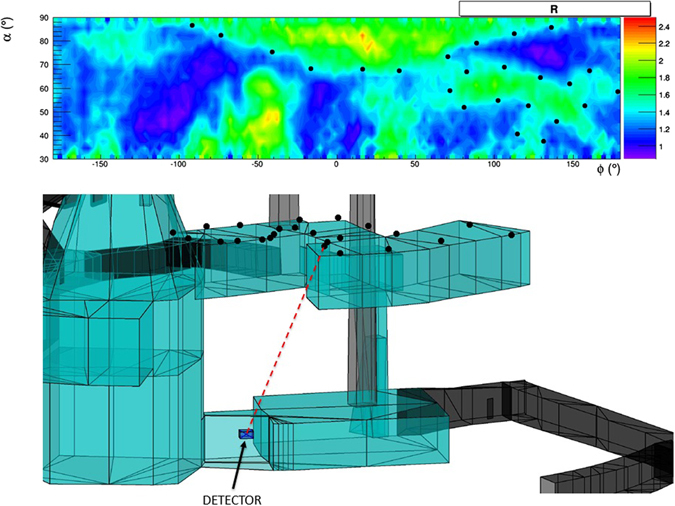
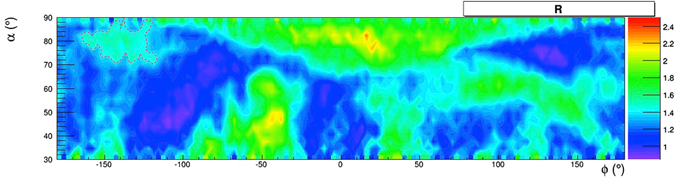
Muography is an imaging technique based on the measurement of absorption profiles for muons as they pass through rocks and earth. Muons are produced in the interactions of high-energy cosmic rays in the Earth's atmosphere. The technique is conceptually similar to usual X-ray radiography, but with extended capabilities of investigating over much larger thicknesses of matter thanks to the penetrating power of high-energy muons. Over the centuries a complex system of cavities has been excavated in the yellow tuff of Mt. Echia, the site of the earliest settlement of the city of Naples in the 8th century BC. A new generation muon detector designed by us, was installed under a total rock overburden of about 40 metres. A 26 days pilot run provided about 14 millions of muon events. A comparison of the measured and expected muon fluxes improved the knowledge of the average rock density. The observation of known cavities proved the validity of the muographic technique. Hints on the existence of a so far unknown cavity was obtained. The success of the investigation reported here demonstrates the substantial progress of muography in underground imaging and is likely to open new avenues for its widespread utilisation.


Conflict of interest statement

The authors declare that they have no competing interests.

Figures

Figure 1
Figure 1
Digital Terrain Model (DTM) of Mt. Echia, with a resolution of 1 m in the horizontal x-y coordinates and 10 cm in the vertical z coordinate. The detector is located at 10 m a.s.l. within the dashed square, in the neighbourhood of the Bourbon Tunnel (straight line). The main underground structures located in the surrounding area are schematically shown. The map has been obtained by LIDAR observations elaborated by the following softwares: Terrasolid - Terrascan, LP360, RIEGL Riscan Pro, Golden Software - Surfer 12 and root.
Figure 2
Figure 2
Three dimensional representation of the Digital Terrain Model (DTM) of Mt. Echia. The image was obtained using LIDAR observations elaborated by the following softwares: Terrasolid - Terrascan, LP360, RIEGL Riscan Pro, Golden Software - Surfer 12 and root.
Figure 3
Figure 3
The detector in a recess of the cavity facing the water cistern.
Figure 4
Figure 4
The water cistern, as seen from the detector location.
Figure 5
Figure 5
Left: Sketch of the aluminium shell of a detection plane, consisting in 64 scintillator bars and the Front-End Electronics. Right: Sketch of the muon telescope, consisting of a vertical sequence of three modules, mounted horizontally on a support (not shown) and evenly spaced in the vertical direction (z-axis).
Figure 6
Figure 6
A half plane of 32 scintillator bars and 32 wavelength shifting fibres placed in a connector. The connector is optically coupled to 32 Silicon photomultipliers, mounted on a printed circuit board, not shown in the picture. Two half planes mounted side by side form a detection plane.
Figure 7
Figure 7
Stability of the main parameters that monitor the status of the detector during the Mt. Echia data tacking. Top: Environmental temperature, dew point temperature, chiller temperature and power, relative humidity. Bottom: Trigger rate, accidental rates, environmental temperature. The drawing was obtained using the software root.
Figure 8
Figure 8
Stability of the main parameters acquired during pedestal runs, for one random channel, during the Mt. Echia data tacking: mean and RMS value of the ADC peak (blue triangles and red squares), the ADC mean value corresponding the single photoelectron response (green triangles). The drawing was obtained using the software root.
Figure 9
Figure 9
Definition of the elevation angle α and the horizontal angle ϕ.
Figure 10
Figure 10
Differential muon flux distribution as a function of the muon energy, for different zenith angles, as given in ref. . The drawing was obtained using the software root.
Figure 11
Figure 11
Rock thickness d(α, ϕ) crossed by muons reaching the detector under the hypothesis that no cavities are present, evaluated using the Digital Terrain Model. The drawing was obtained using the software root.
Figure 12
Figure 12
Minimum energy Emin(ρ,α,φ) required for a muon to cross the rock overburden, whose thickness is shown in Fig. 11, evaluated for an uniform average rock density ρ = 1.4 g/cm3. The drawing was obtained using the software root.
Figure 13
Figure 13
The expected transmission. The drawing was obtained using the software root.
Figure 14
Figure 14
(A) Rate of free-sky muons measured in laboratory. (B) Rate of underground muons measured under Mt Echia. (C) Measured transmission. The drawing was obtained using the software root.
Figure 15
Figure 15
The relative transmission R(ρ,α,φ) evaluated with ρ = 1.4 g/cm3. Regions with values higher than 2.5 have been saturated at this value. Also shown are five regions, where minimal relative transmission values have been selected to evaluate the best estimation of the density. The drawing was obtained using the software root.
Figure 16
Figure 16
Relative transmissions in the five regions R 1R 5 (separately and in total) as functions of ρ. The drawing was obtained using the software root.
Figure 17
Figure 17
Left: top view of the known structures in the neighbourhood of the detector. The orange box shows the detector position, below the room indicated by the dashed line. Right: 3D view. The cone, with ∼120° of aperture, represents the angular acceptance of the detector. The drawings were obtained using the software Autodesk AutoCAD 2015.
Figure 18
Figure 18
Time sequence of muographies obtained in 5 hours of data taking. The drawing was obtained using the software root.
Figure 19
Figure 19
Top: Relative transmission R(ρ,θ,φ) evaluated with the best estimate of the tuff density ρ = 1.71 g/cm3; the black dots lie on the contour of one of the structures which are observed. Bottom: Projection of the black dots in the top figure at z = 25 m, corresponding to the ceiling of a known structure. The drawings were obtained using the software root and Autodesk AutoCAD 2015.
Figure 20
Figure 20
A structure evidenced by the muographic image and with contour shown by a dashed line, without any correspondence among the known structures. The drawing was obtained using the software root.

Similar articles

  • 3D Muography for the Search of Hidden Cavities.
    Cimmino L, Baccani G, Noli P, Amato L, Ambrosino F, Bonechi L, Bongi M, Ciulli V, D'Alessandro R, D'Errico M, Gonzi S, Melon B, Minin G, Saracino G, Scognamiglio L, Strolin P, Viliani L. Cimmino L, et al. Sci Rep. 2019 Feb 27;9(1):2974. doi: 10.1038/s41598-019-39682-5. Sci Rep. 2019. PMID: 30814618 Free PMC article.
  • Applications of muon absorption radiography to the fields of archaeology and civil engineering.
    Saracino G, Ambrosino F, Bonechi L, Cimmino L, D'Alessandro R, D'Errico M, Noli P, Scognamiglio L, Strolin P. Saracino G, et al. Philos Trans A Math Phys Eng Sci. 2018 Dec 10;377(2137):20180057. doi: 10.1098/rsta.2018.0057. Philos Trans A Math Phys Eng Sci. 2018. PMID: 30530534 Free PMC article.
  • Principles and Perspectives of Radiographic Imaging with Muons.
    Cimmino L. Cimmino L. J Imaging. 2021 Nov 26;7(12):253. doi: 10.3390/jimaging7120253. J Imaging. 2021. PMID: 34940720 Free PMC article. Review.
  • Muography applications developed by IFIN-HH.
    Mitrica B, Stanca D, Cautisanu B, Niculescu-Oglinzanu M, Balaceanu A, Gherghel-Lascu A, Munteanu A, Saftoiu A, Mosu T, Margineanu R, Alkotbe B. Mitrica B, et al. Philos Trans A Math Phys Eng Sci. 2018 Dec 10;377(2137):20180137. doi: 10.1098/rsta.2018.0137. Philos Trans A Math Phys Eng Sci. 2018. PMID: 30530545 Free PMC article.
  • Muon geotomography: selected case studies.
    Schouten D. Schouten D. Philos Trans A Math Phys Eng Sci. 2018 Dec 10;377(2137):20180061. doi: 10.1098/rsta.2018.0061. Philos Trans A Math Phys Eng Sci. 2018. PMID: 30530537 Review.

Cited by

References

    1. George, E. P. Cosmic rays measure of overburden of tunnel. Commonwealth Eng. 455–7 (1955).
    1. Alvarez LW, et al. Search for hidden chambers in the pyramids. Science. 1970;167:832–839. doi: 10.1126/science.167.3919.832. - DOI - PubMed
    1. Okubo S, Tanaka HKM. Imaging the density profile of a volcano interior with cosmic-ray muon radiography combined with classical gravimetry. Meas. Sci. and Technol. 2012;23:042001. doi: 10.1088/0957-0233/23/4/042001. - DOI
    1. Tanaka, H. K. M., Kusagaya, T. & Shinohara, H. Radiographic visualization of magma dynamics in an erupting volcano. Nature Communications5 (2014). - PMC - PubMed
    1. Saracino, G. & Carlôganu, C. Looking at volcanoes with cosmic-ray muons. Physics Today65, number 12, 60–61 (2012).

Publication types