

Analyzing Reaction Rates with the Distortion/Interaction-Activation Strain Model
- PMID: 28447369
- PMCID: PMC5601271
- DOI: 10.1002/anie.201701486
Analyzing Reaction Rates with the Distortion/Interaction-Activation Strain Model
Abstract
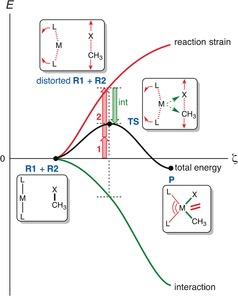
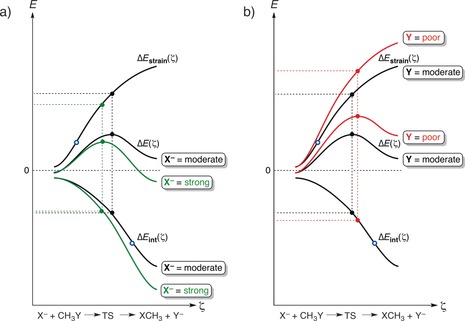
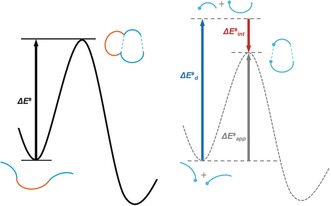
The activation strain or distortion/interaction model is a tool to analyze activation barriers that determine reaction rates. For bimolecular reactions, the activation energies are the sum of the energies to distort the reactants into geometries they have in transition states plus the interaction energies between the two distorted molecules. The energy required to distort the molecules is called the activation strain or distortion energy. This energy is the principal contributor to the activation barrier. The transition state occurs when this activation strain is overcome by the stabilizing interaction energy. Following the changes in these energies along the reaction coordinate gives insights into the factors controlling reactivity. This model has been applied to reactions of all types in both organic and inorganic chemistry, including substitutions and eliminations, cycloadditions, and several types of organometallic reactions.
Keywords: chemical reactivity; computational chemistry; quantum chemistry; reaction mechanisms; transition states.
© 2017 The Authors. Published by Wiley-VCH Verlag GmbH & Co. KGaA.
Figures

Similar articles
-
Bioorthogonal Cycloadditions: Computational Analysis with the Distortion/Interaction Model and Predictions of Reactivities.Acc Chem Res. 2017 Sep 19;50(9):2297-2308. doi: 10.1021/acs.accounts.7b00265. Epub 2017 Sep 6. Acc Chem Res. 2017. PMID: 28876890 Free PMC article.
-
Theory of 1,3-dipolar cycloadditions: distortion/interaction and frontier molecular orbital models.J Am Chem Soc. 2008 Aug 6;130(31):10187-98. doi: 10.1021/ja800009z. Epub 2008 Jul 10. J Am Chem Soc. 2008. PMID: 18613669
-
Understanding chemical reactivity using the activation strain model.Nat Protoc. 2020 Feb;15(2):649-667. doi: 10.1038/s41596-019-0265-0. Epub 2020 Jan 10. Nat Protoc. 2020. PMID: 31925400
-
Chemical reactivity from an activation strain perspective.Chem Commun (Camb). 2021 Jun 15;57(48):5880-5896. doi: 10.1039/d1cc02042k. Chem Commun (Camb). 2021. PMID: 34075969 Free PMC article. Review.
-
Computational Organic Chemistry: The Frontier for Understanding and Designing Bioorthogonal Cycloadditions.Top Curr Chem (Cham). 2024 May 10;382(2):17. doi: 10.1007/s41061-024-00461-0. Top Curr Chem (Cham). 2024. PMID: 38727989 Free PMC article. Review.
Cited by
-
Lewis Acid-Catalyzed Diels-Alder Reactions: Reactivity Trends across the Periodic Table.Chemistry. 2021 Jul 21;27(41):10610-10620. doi: 10.1002/chem.202100522. Epub 2021 May 1. Chemistry. 2021. PMID: 33780068 Free PMC article.
-
Highly Acidic Electron-Rich Brønsted Acids Accelerate Asymmetric Pictet-Spengler Reactions by Virtue of Stabilizing Cation-π Interactions.J Am Chem Soc. 2024 Oct 3;146(41):28339-49. doi: 10.1021/jacs.4c09421. Online ahead of print. J Am Chem Soc. 2024. PMID: 39361889 Free PMC article.
-
Understanding chemistry: from "heuristic (soft) explanations and reasoning by analogy" to "quantum chemistry".Chem Sci. 2022 Sep 28;13(39):11461-11486. doi: 10.1039/d2sc02535c. eCollection 2022 Oct 12. Chem Sci. 2022. PMID: 36320403 Free PMC article. Review.
-
Highly enantioselective synthesis of both enantiomers of tetrahydroquinoxaline derivatives via Ir-catalyzed asymmetric hydrogenation.Chem Sci. 2024 Aug 23;15(37):15243-54. doi: 10.1039/d4sc04222k. Online ahead of print. Chem Sci. 2024. PMID: 39246375 Free PMC article.
-
SN2 versus E2 Competition of F- and PH2- Revisited.J Org Chem. 2020 Nov 6;85(21):14087-14093. doi: 10.1021/acs.joc.0c02112. Epub 2020 Oct 20. J Org Chem. 2020. PMID: 33079542 Free PMC article.
References
-
- None
-
- Hoffmann R., Angew. Chem. Int. Ed. Engl. 1982, 21, 711–724;
- Angew. Chem. 1982, 94, 725–739;
-
- Fukui K., Angew. Chem. Int. Ed. Engl. 1982, 21, 801–809;
- Angew. Chem. 1982, 94, 852–861.
-
- See also:
-
- Fleming I., Molecular Orbitals and Organic Chemical Reactions, Wiley, Chichester, 2009;
Publication types
LinkOut - more resources
Full Text Sources
Other Literature Sources
