. 2017 Jul;10(4):858-872.
doi: 10.1111/1751-7915.12713. Epub 2017 Apr 26.

Transcriptional response of Escherichia coli to ammonia and glucose fluctuations

Collaborators, Affiliations

Transcriptional response of Escherichia coli to ammonia and glucose fluctuations

Joana Danica Simen et al. Microb Biotechnol. 2017 Jul.

Abstract

In large-scale production processes, metabolic control is typically achieved by limited supply of essential nutrients such as glucose or ammonia. With increasing bioreactor dimensions, microbial producers such as Escherichia coli are exposed to changing substrate availabilities due to limited mixing. In turn, cells sense and respond to these dynamic conditions leading to frequent activation of their regulatory programmes. Previously, we characterized short- and long-term strategies of cells to adapt to glucose fluctuations. Here, we focused on fluctuating ammonia supply while studying a continuously running two-compartment bioreactor system comprising a stirred tank reactor (STR) and a plug-flow reactor (PFR). The alarmone ppGpp rapidly accumulated in PFR, initiating considerable transcriptional responses after 70 s. About 400 genes were repeatedly switched on/off when E. coli returned to the STR. E. coli revealed highly diverging long-term transcriptional responses in ammonia compared to glucose fluctuations. In contrast, the induction of stringent regulation was a common feature of both short-term responses. Cellular ATP demands for coping with fluctuating ammonia supply were found to increase maintenance by 15%. The identification of genes contributing to the increased ATP demand together with the elucidation of regulatory mechanisms may help to create robust cells and processes for large-scale application.


Figures

Figure 1
Figure 1
Experimental design of the two‐compartment system. The two‐compartment device consists of a stirred tank reactor (STR) connected to a plug‐flow reactor (PFR). The STRPFR was designed to give a simplified representation of some of the periodic substrate variations experienced by cells in large‐scale bioreactors: the limiting substrate is fed into the well‐mixed STR (limitation zone) and residual substrate is quickly consumed when microbial cells enter the PFR, leading to the development of a starvation zone. A continuous process strategy was chosen to maintain a constant volume and average dilution rate of D = 0.2 h−1 in the system. The steady state prior to PFR onset at time zero was used as the reference state (S0). Samples were taken at eleven distinct time points over 28 h. The system is equipped with five PFR sample ports (P1‐5) at defined residence times τ (s), as well as STR sample port S. The residence times in the connecting loops from the STR outlet to P1 and P5 to the PFR outlet were 31 and 15 s respectively. This results in a total mean PFR residence time of τPFR = 125 s (for calculations see Methods S1). F = feed; H = harvest.
Figure 2
Figure 2
Short‐term accumulation of ppGpp over residence time in the PFR. Samples from two independent STRPFR cultivations were analysed at different process time points. Time profiles show the average ppGpp concentration in μmol g (DW)−1 at process times of 25 min, 120 min and 28 h (mean ± SD).
Figure 3
Figure 3
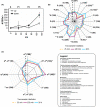
Transcriptional responses to short‐term nitrogen shortage. A. Number of DEGs whose expression was increased (grey circles) or reduced (black circles) between PFR and STR. Time courses are shown as mean ± SD calculated from samples withdrawn at 25 min, 120 min and 28 h after PFR onset. DEGs are defined as having an FDR < 0.01 and log2 fold change ≥ |0.58|. B. COG functional categories (Tatusov et al., 2000) and (C) sigma factor regulation (Salgado et al., 2013) pattern for the comparison of PFR sample port P5 vs. S, visualized as spider graphs. Because no COG or sigma factor annotation was found for 559 and 428 of 3889 genes, respectively, these genes were excluded from the statistical analysis. The t‐statistics pattern from GAGE (Luo et al., 2009) is shown for three representative time points: 25 min (gold dotted line), 120 min (magenta line) and 28 h (blue line) after the PFR was coupled to the STR. Sets including less than 10, or above 500, genes were omitted from the analysis. Functional groups that were significantly changed with an FDR < 0.05 at a minimum of one time point using either GAGE (black asterisk) or hypergeometric distribution (grey asterisk) analysis are indicated. Overlapping sigma factor sensitivities: gene regulation may occur by each of the sigma factors depicted because multiple promoters exert control.
Figure 4
Figure 4
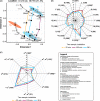
Long‐term dynamics to repeated ammonia shortage. A. Multidimensional scaling analysis of transcriptomes obtained at eleven process time points and over residence time τ in the PFR; Grey arrows follow the adaptation trajectories from the STR (squares) S0 (0 h) to S1 (28 h) and PFR P5 (circles) and P1 (28 h) respectively. Coloured arrows follow the transition between STR and PFR clusters at 25 min (gold), 120 min (magenta) and 28 h (blue). Ellipses indicate the 95% confidence interval of replicate samples taken at S0 (orange) and S1 at 25, 26 and 28 h after PFR addition (blue). The proportion of variance in the data accounted for by the MDS solution from two independent cultivations: R 2 = 0.75. Data points represent the mean of = 2. B. COG functional categories (Tatusov et al., 2000) and (C) sigma factor regulation (Salgado et al., 2013) pattern for the comparison of STR sample ports S vs. S0, visualized as spider graphs. Because no COG or sigma factor annotation was found for 559 and 428 of 3889 genes, respectively, these genes were excluded from the statistical analysis. The t‐statistics pattern from GAGE (Luo et al., 2009) is shown for three representative time points: 25 min (gold dotted line), 120 min (magenta line) and 28 h (blue line) after PFR addition. Sets including less than 10, or above 500, genes were omitted from the analysis. Functional groups that were significantly changed with an FDR < 0.05 at a minimum of one time point using GAGE (black asterisk) and hypergeometric distribution (grey asterisk) analysis are indicated. Overlapping sigma factor sensitivities: gene regulation may occur by each of the sigma factors depicted because multiple promoters exert control.
Figure 5
Figure 5
Venn diagrams representing (overlapping) sets of differentially expressed genes derived from repeated ammonia (this study) or glucose shortage (Löffler et al., 2016) STRPFR tests. Short‐term response observed for the following comparisons at PFR sample port (A) P3 vs. S (τ = 70 s) and (B) P5 vs. S (τ = 110 s) conducted after 28 h of process time. C. Long‐term response (S vs. S0) conducted after 28 h. The number of up‐ and downregulated genes in each set is indicated by regular and underlined numbers respectively. The number of overlapping genes, which were regulated in the ammonia and glucose sets with comparable strength but in opposing directions, is shown in italics. For each gene set, a hypergeometric distribution analysis was performed to identify significantly over‐represented functional categories (FDR < 0.05, grey boxes). DEGs were defined as having an FDR < 0.01 and log2 fold change ≥ |0.58| in either ammonia or glucose data sets. Complete gene lists of the Venn diagrams are available in Tables S6 ‐ S10 of the Supplementary information.

References

    1. Amanullah, A. , McFarlane, C.M. , Emery, A.N. , and Nienow, A.W. (2001) Scale‐down model to simulate spatial pH variations in large‐scale bioreactors. Biotechnol Bioeng 73: 390–399. - PubMed
    1. Anders, S. , Pyl, P.T. , and Huber, W. (2015) HTSeq‐A Python framework to work with high‐throughput sequencing data. Bioinformatics 31: 166–169. - PMC - PubMed
    1. Benjamini, Y. , and Hochberg, Y. (1995) Controlling the false discovery rate: a practical and powerful approach to multiple testing. J R Stat Soc 57: 289–300.
    1. Brown, D.R. , Barton, G. , Pan, Z. , Buck, M. , and Wigneshweraraj, S. (2014) Nitrogen stress response and stringent response are coupled in Escherichia coli . Nat Commun 5: 4115. - PMC - PubMed
    1. Buchholz, J. , Graf, M. , Freund, A. , Busche, T. , Kalinowski, J. , Blombach, B. , and Takors, R. (2014) CO2/HCO3 − perturbations of simulated large scale gradients in a scale‐down device cause fast transcriptional responses in Corynebacterium glutamicum . Appl Microbiol Biotechnol 98: 8563–8572. - PubMed

MeSH terms

Associated data