. 2017 Apr 27:8:15095.
doi: 10.1038/ncomms15095.

Spatial computation of intratumoral T cells correlates with survival of patients with pancreatic cancer

Affiliations

Spatial computation of intratumoral T cells correlates with survival of patients with pancreatic cancer

Julienne L Carstens et al. Nat Commun. .

Abstract

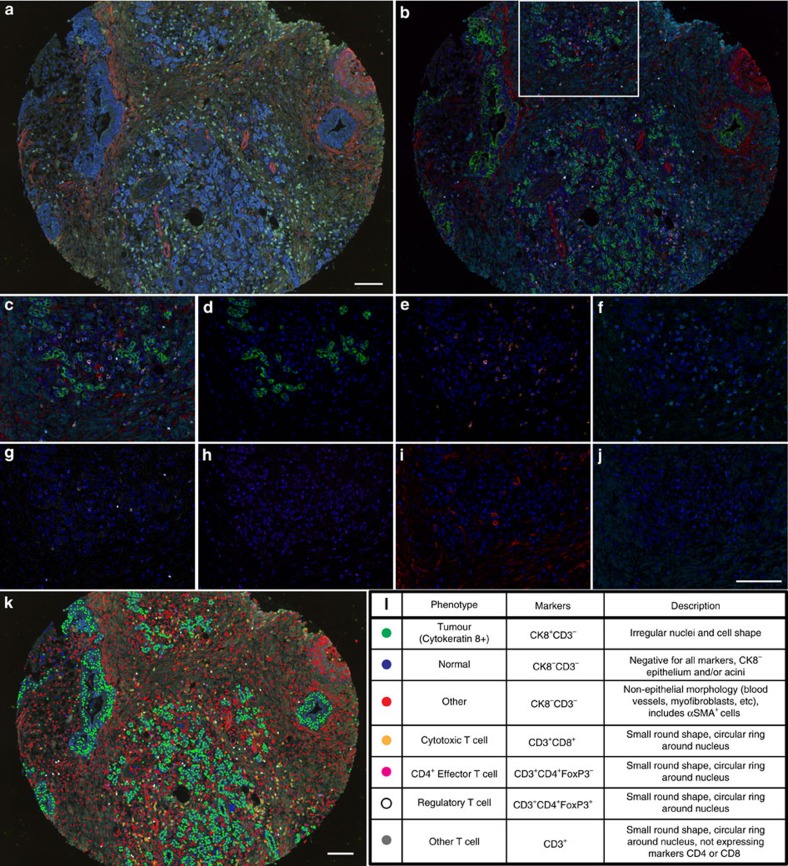
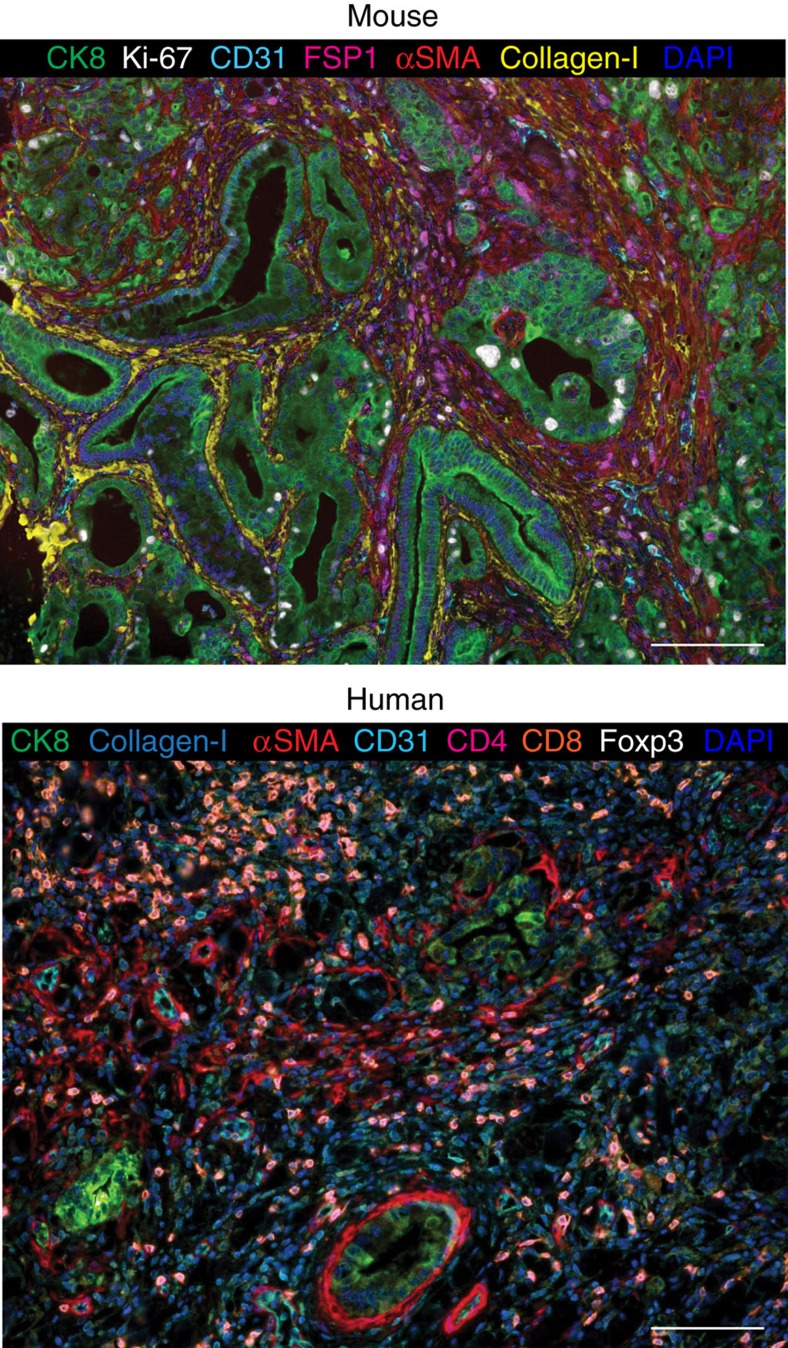
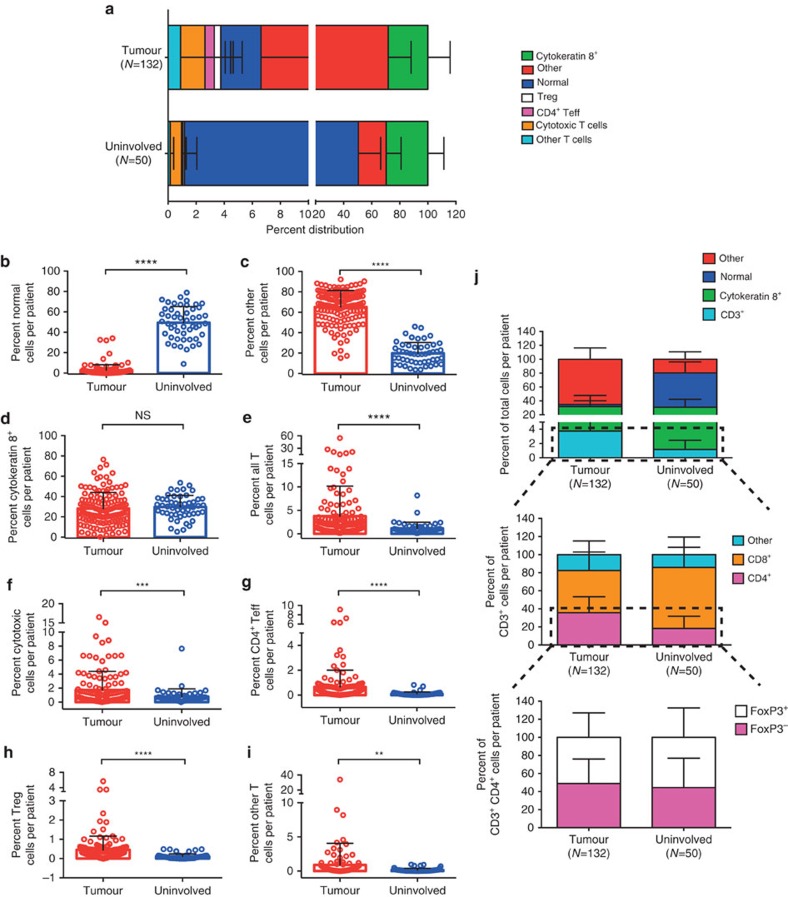
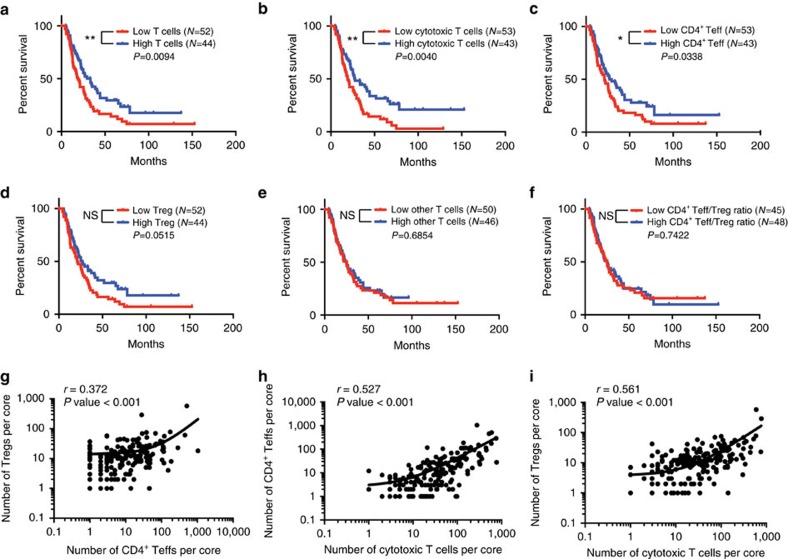
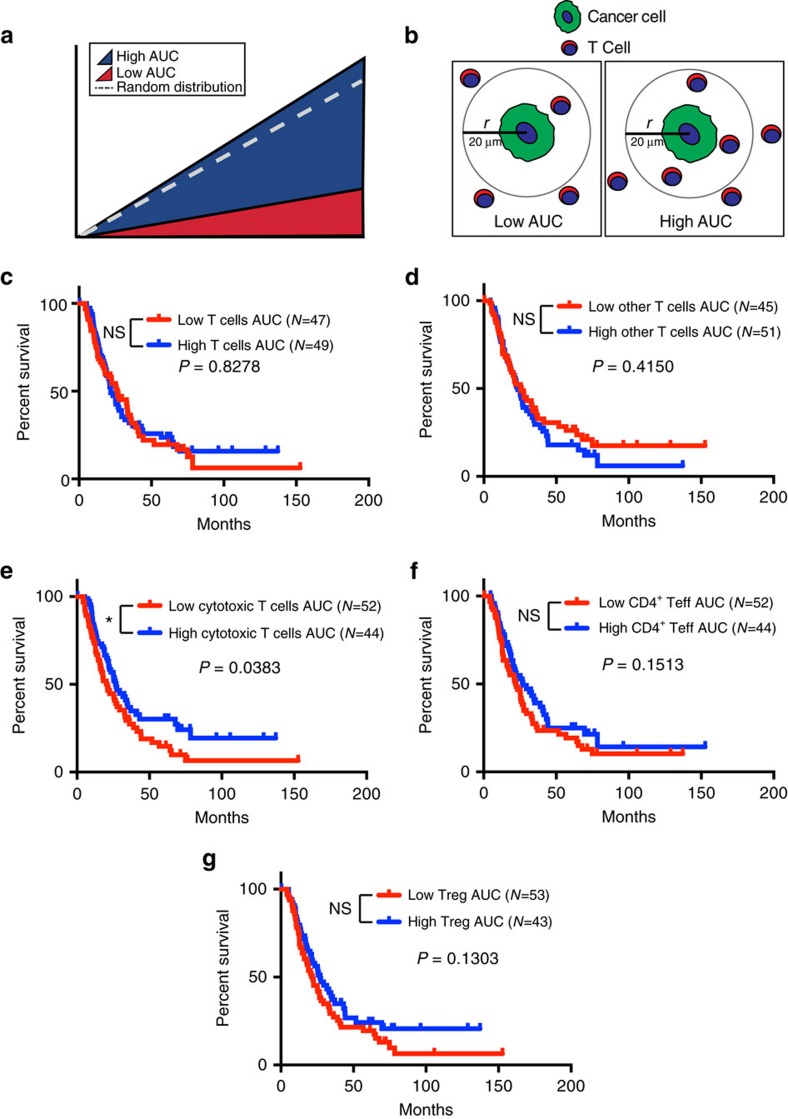
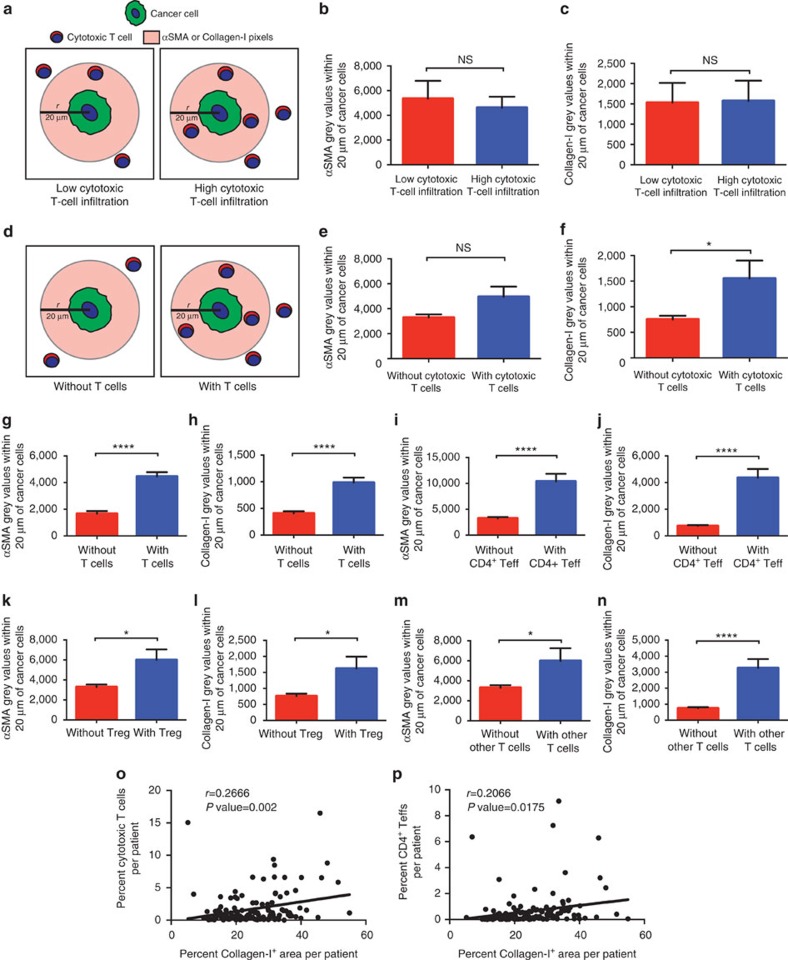
The exact nature and dynamics of pancreatic ductal adenocarcinoma (PDAC) immune composition remains largely unknown. Desmoplasia is suggested to polarize PDAC immunity. Therefore, a comprehensive evaluation of the composition and distribution of desmoplastic elements and T-cell infiltration is necessary to delineate their roles. Here we develop a novel computational imaging technology for the simultaneous evaluation of eight distinct markers, allowing for spatial analysis of distinct populations within the same section. We report a heterogeneous population of infiltrating T lymphocytes. Spatial distribution of cytotoxic T cells in proximity to cancer cells correlates with increased overall patient survival. Collagen-I and αSMA+ fibroblasts do not correlate with paucity in T-cell accumulation, suggesting that PDAC desmoplasia may not be a simple physical barrier. Further exploration of this technology may improve our understanding of how specific stromal composition could impact T-cell activity, with potential impact on the optimization of immune-modulatory therapies.


Conflict of interest statement

J.P.A. is an inventor of intellectual property owned by the University of California, Berkeley and licensed to Bristol Myers-Squibb. The remaining authors declare no competing financial interests.

Figures

Figure 1
Figure 1. Opal eight-colour multiplex analysis of human PDAC identifies unique cellular subpopulations.
(a,b) Representative images displaying the same TMA core after multispectral imaging (raw image (a)) and after spectral unmixing (composite image (b)). (cj) Enlarged subsection of the core highlighted in b, showing each of the individual markers in the composite image after spectral unmixing, together with the DAPI nuclear marker (pseudocoloured blue) and the autofluorescence signal (pseudocoloured black); (c) all markers, (d) cytokeratin 8 (cytoplasmic, labelled with FITC, pseudocoloured green), (e) CD8 (membrane, Opal10, pseudocoloured orange), (f) CD3 (membrane, Opal9, pseudocoloured cyan), (g) Foxp3 (nuclear, Cy3, pseudocoloured white), (h) CD4 (membrane, Cy5, pseudocoloured magenta), (i) αSMA (cytoplasmic, Cy5.5, pseudocoloured red) and (j) Collagen-I (extracellular, Coumarin, pseudocoloured teal blue). (k) Cell phenotype map identifying the cell populations defined by the individual markers in the multiplex stain, overlaid on the raw image. (l) Summary of each defined cell phenotype, colour code and associated markers. All scale bars equal 100 μm.
Figure 2
Figure 2. Applications of multiplex staining protocols in PDAC tissue sections.
Spectrally unmixed images obtained after multispectral imaging of a mouse PDAC tumour section from a mutant Kras and mutant p53-driven PDAC mouse model and a tumour section from a PDAC patient after multiplex staining with different marker–fluorophore combinations. Mouse: cytokeratin 8 (CK8, cytoplasmic, labelled with Cy3.5, pseudocoloured green), Ki-67 (nuclear, Cy5, pseudocoloured white), CD31 (membrane, Cy3, pseudocoloured cyan), FSP1 (membrane, 680, pseudocoloured magenta), αSMA (cytoplasmic, Coumarin, pseudocoloured red), Collagen-I (extracellular, FITC, pseudocoloured yellow), autofluorescence (pseudocoloured black) and the DAPI nuclear marker (pseudocoloured blue). Human: cytokeratin 8 (CK8, cytoplasmic, Cy3.5, pseudocoloured green), Collagen-I (extracellular, Coumarin, pseudocoloured teal blue), αSMA (cytoplasmic, FITC, pseudocoloured red), CD31 (membrane, Cy3, pseudocoloured cyan), CD4 (membrane, 680, pseudocoloured magenta), CD8 (membrane, Cy5, pseudocoloured orange), Foxp3 (nuclear, Biotin-Streptavidin 594, pseudocoloured white), autofluorescence (pseudocoloured black) and the DAPI nuclear marker (pseudocoloured blue). All scale bars equal 100 μm.
Figure 3
Figure 3. PDAC tissue samples display increased infiltration of heterogeneous T-cell subpopulations.
(a) Relative distribution of all analysed cell phenotypes in PDAC and uninvolved pancreatic tissue samples. (bi) Pairwise comparisons of the percentage of cells per patient for normal cells (b), other cells (c), cytokeratin 8+ cells (d), all T cells (e), cytotoxic T cells (f), CD4+ Teff cells (g), Treg cells (h) and other T cells (i) between tumour and uninvolved pancreatic tissue samples. Significance determined by unpaired t-test. (j) Relative distribution analysis of different T-cell phenotypes within defined groups, by separating the total cell number initially into other, normal, cytokeratin 8+ cells or total CD3+ T cells (includes all T-cell subpopulations; upper panel); then focussing only on CD3+ T cells and dividing them into CD4+ (helper T cells), CD8+ (cytotoxic T cells) and CD4CD8 (other T cells) subpopulations (middle panel); and finally focussing on CD3+CD4+ T cells and dividing them into FoxP3+ (Tregs) and FoxP3 (CD4+ Teff) subpopulations (lower panel). Data presented as the mean±s.d. **P<0.01, ***P<0.001, ****P<0.0001, NS, not significant.
Figure 4
Figure 4. T-cell infiltration significantly stratifies patient survival.
(af) Survival analysis of all 132 patients based on percentage of cell numbers per patient of all CD3+ T cells (a), CD3+CD8+ cytotoxic T cells (b), CD3+CD4+Foxp3 Teffs (c), CD3+CD4+FoxP3+ Tregs (d), CD3+CD4CD8 other T cells (e) and the ratio of CD4+ Teff/Treg per patient (f). N values correspond to uncensored patients (who reached cancer survival end point). In f, patients with no Tregs were excluded (N=3 patients excluded) as no ratio could be calculated. High and low infiltration values were divided based on the median percentage of positive cells or ratio. Significance was determined using the Log-rank Mantel–Cox test. (gi) Correlation analysis between Treg and CD4+ Teff cell counts (g), cytotoxic T cells and CD4+ Teff cell counts (h) and cytotoxic T cells and Treg cell counts (i) per core. Pearson correlation coefficient (r) and significance levels (P value) are presented for each correlation. Axis values are shown in log scale for clarity. *P<0.05, **P<0.01, NS, not significant.
Figure 5
Figure 5. Cancer cell-adjacent cytotoxic T cells significantly correlate with survival.
(a) Schematic representation of the AUC levels based on an L-function calculated for T-cell infiltration. Dashed line—random distribution, Blue area—high AUC levels/High infiltration, Red area—low AUC levels/low infiltration. (b) Schematic representing the calculation of the L-function based on the distribution of T cells within a radius of 20 μm from the nuclear centre of a cytokeratin 8+ cancer cell. (cg) Survival analysis of all 132 patients based on infiltration as determined by the AUC levels of all CD3+ T cells (c), CD3+CD4CD8 other T cells (d), CD3+CD8+ cytotoxic T cells (e), CD3+CD4+Foxp3 Teffs (f) and CD3+CD4+FoxP3+ Tregs (g) within 20 μm of cytokeratin 8+ cancer cells. N values correspond to uncensored patients (who reached cancer survival end point). High and low infiltration values were calculated using the L-function AUC values and divided based on the median infiltration values. Significance was determined using the Log-rank Mantel–Cox test. *P<0.05, NS, not significant.
Figure 6
Figure 6. Desmoplastic elements associate with T-cell infiltration.
(a) Schematic representing the parameters analysed in b,c. (b,c) The mean intensity of αSMA (b) and Collagen-I (c) (grey values) for pixels within 20 μm of cancer cells for each patient separated by low or high cytotoxic T-cell infiltration as determined by the L-function AUC; significance determined by an unpaired t-test. (d) Schematic representing the parameters analysed in en. (en) The mean intensity of αSMA (e,g,i,k,m) and Collagen-I (f,h,j,l,n) (grey values) for pixels within 20 μm of cancer cells for each patient separated by cancer cells with or without adjacent cytotoxic T cells (e,f), all T cells (g,h), CD4+ Teffs (i,j), Tregs (k,l) and other T cells (m,n); significance determined by an unpaired t-test. (o,p) Correlation analysis between area of Collagen-I deposition and the percentage of cytotoxic T cells (o) and area of Collagen-I deposition and the percentage of CD4+ Teffs (p) per patient. Pearson correlation coefficient (r) and significance levels (P value) are presented for each correlation. Data presented as the mean±s.e.m. *P<0.05, ****P<0.0001, NS, not significant.

References

    1. Vonderheide R. H. & Bayne L. J. Inflammatory networks and immune surveillance of pancreatic carcinoma. Curr. Opin. Immunol. 25, 200–205 (2013). - PMC - PubMed
    1. Schmitz-Winnenthal F. H. et al.. High frequencies of functional tumour-reactive T cells in bone marrow and blood of pancreatic cancer patients. Cancer Res. 65, 10079–10087 (2005). - PubMed
    1. Shibuya K. C. et al.. Pancreatic ductal adenocarcinoma contains an effector and regulatory immune cell infiltrate that is altered by multimodal neoadjuvant treatment. PLoS ONE 9, e96565 (2014). - PMC - PubMed
    1. Fukunaga A. et al.. CD8+ tumour-infiltrating lymphocytes together with CD4+ tumour-infiltrating lymphocytes and dendritic cells improve the prognosis of patients with pancreatic adenocarcinoma. Pancreas 28, e26-31 (2004). - PubMed
    1. Ene-Obong A. et al.. Activated pancreatic stellate cells sequester CD8+ T cells to reduce their infiltration of the juxtatumoral compartment of pancreatic ductal adenocarcinoma. Gastroenterology 145, 1121–1132 (2013). - PMC - PubMed

Publication types

MeSH terms