. 2017 May 17;139(19):6518-6521.
doi: 10.1021/jacs.7b01159. Epub 2017 May 3.

3D MAS NMR Experiment Utilizing Through-Space 15N-15N Correlations

Affiliations

3D MAS NMR Experiment Utilizing Through-Space 15N-15N Correlations

Kevin J Donovan et al. J Am Chem Soc. .

Abstract

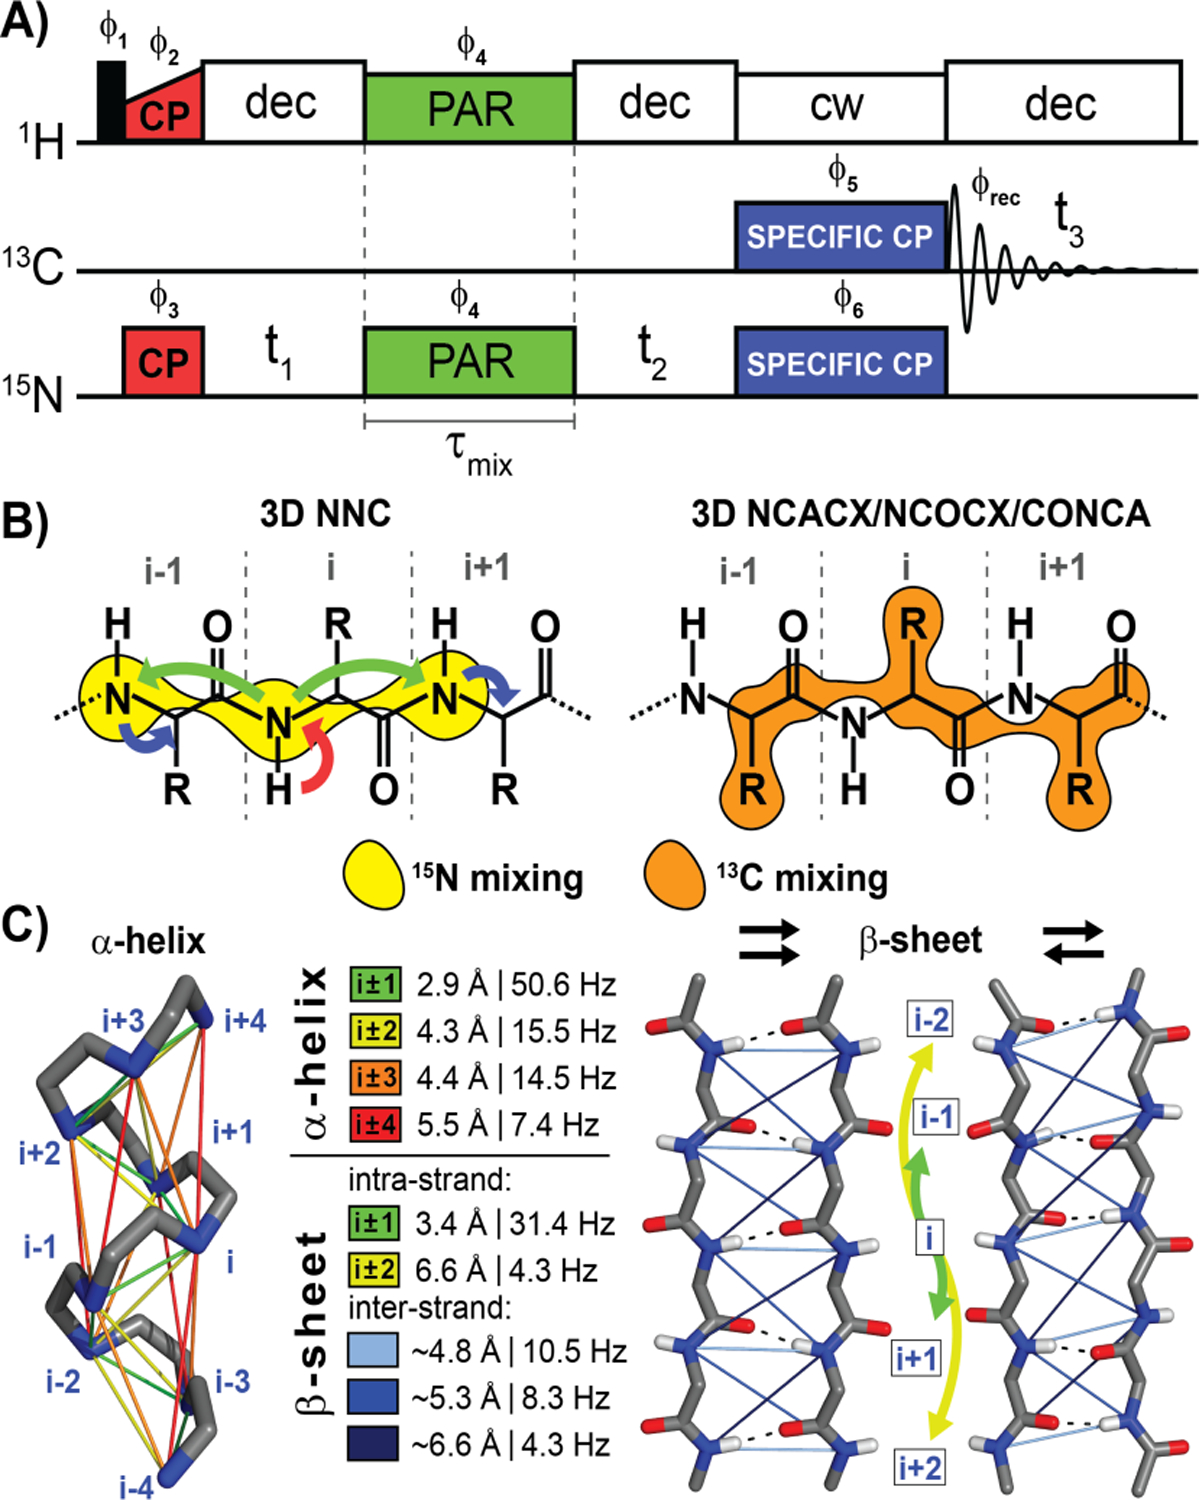
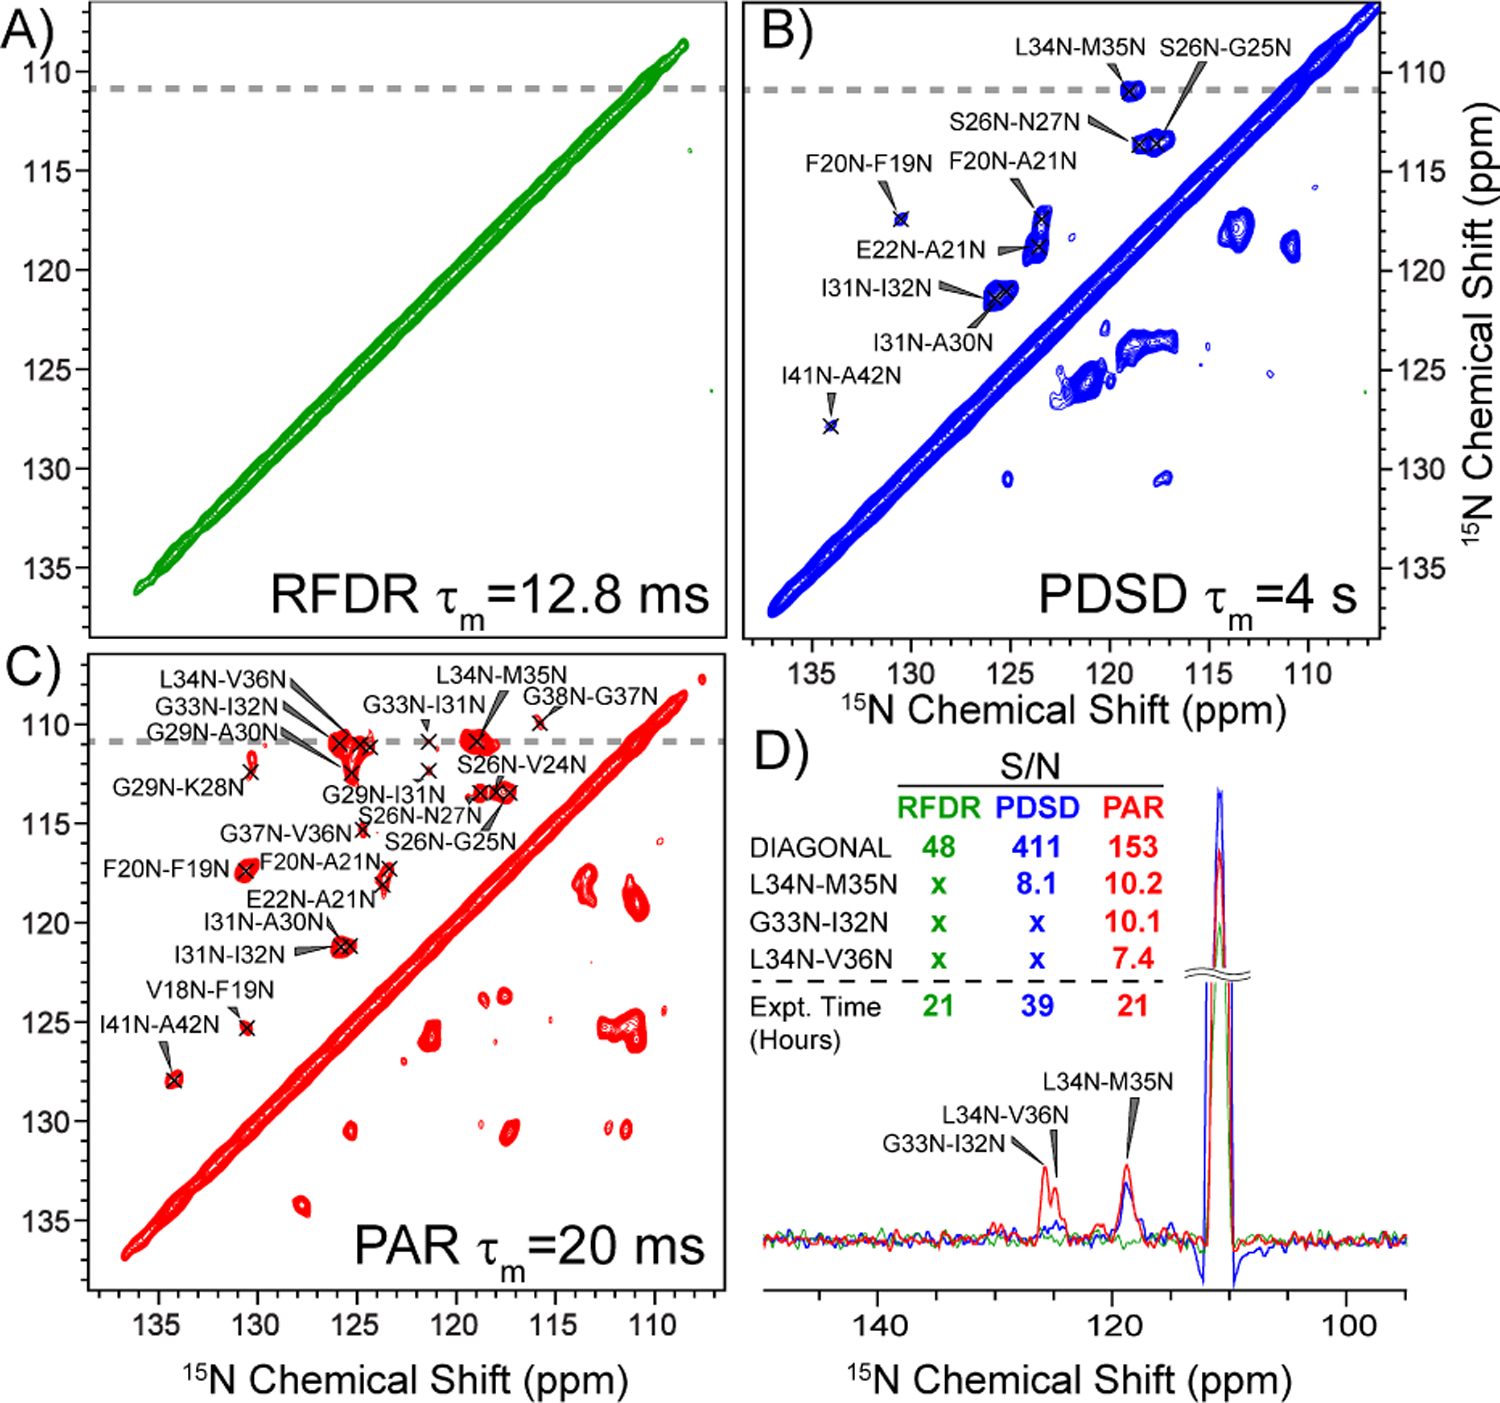
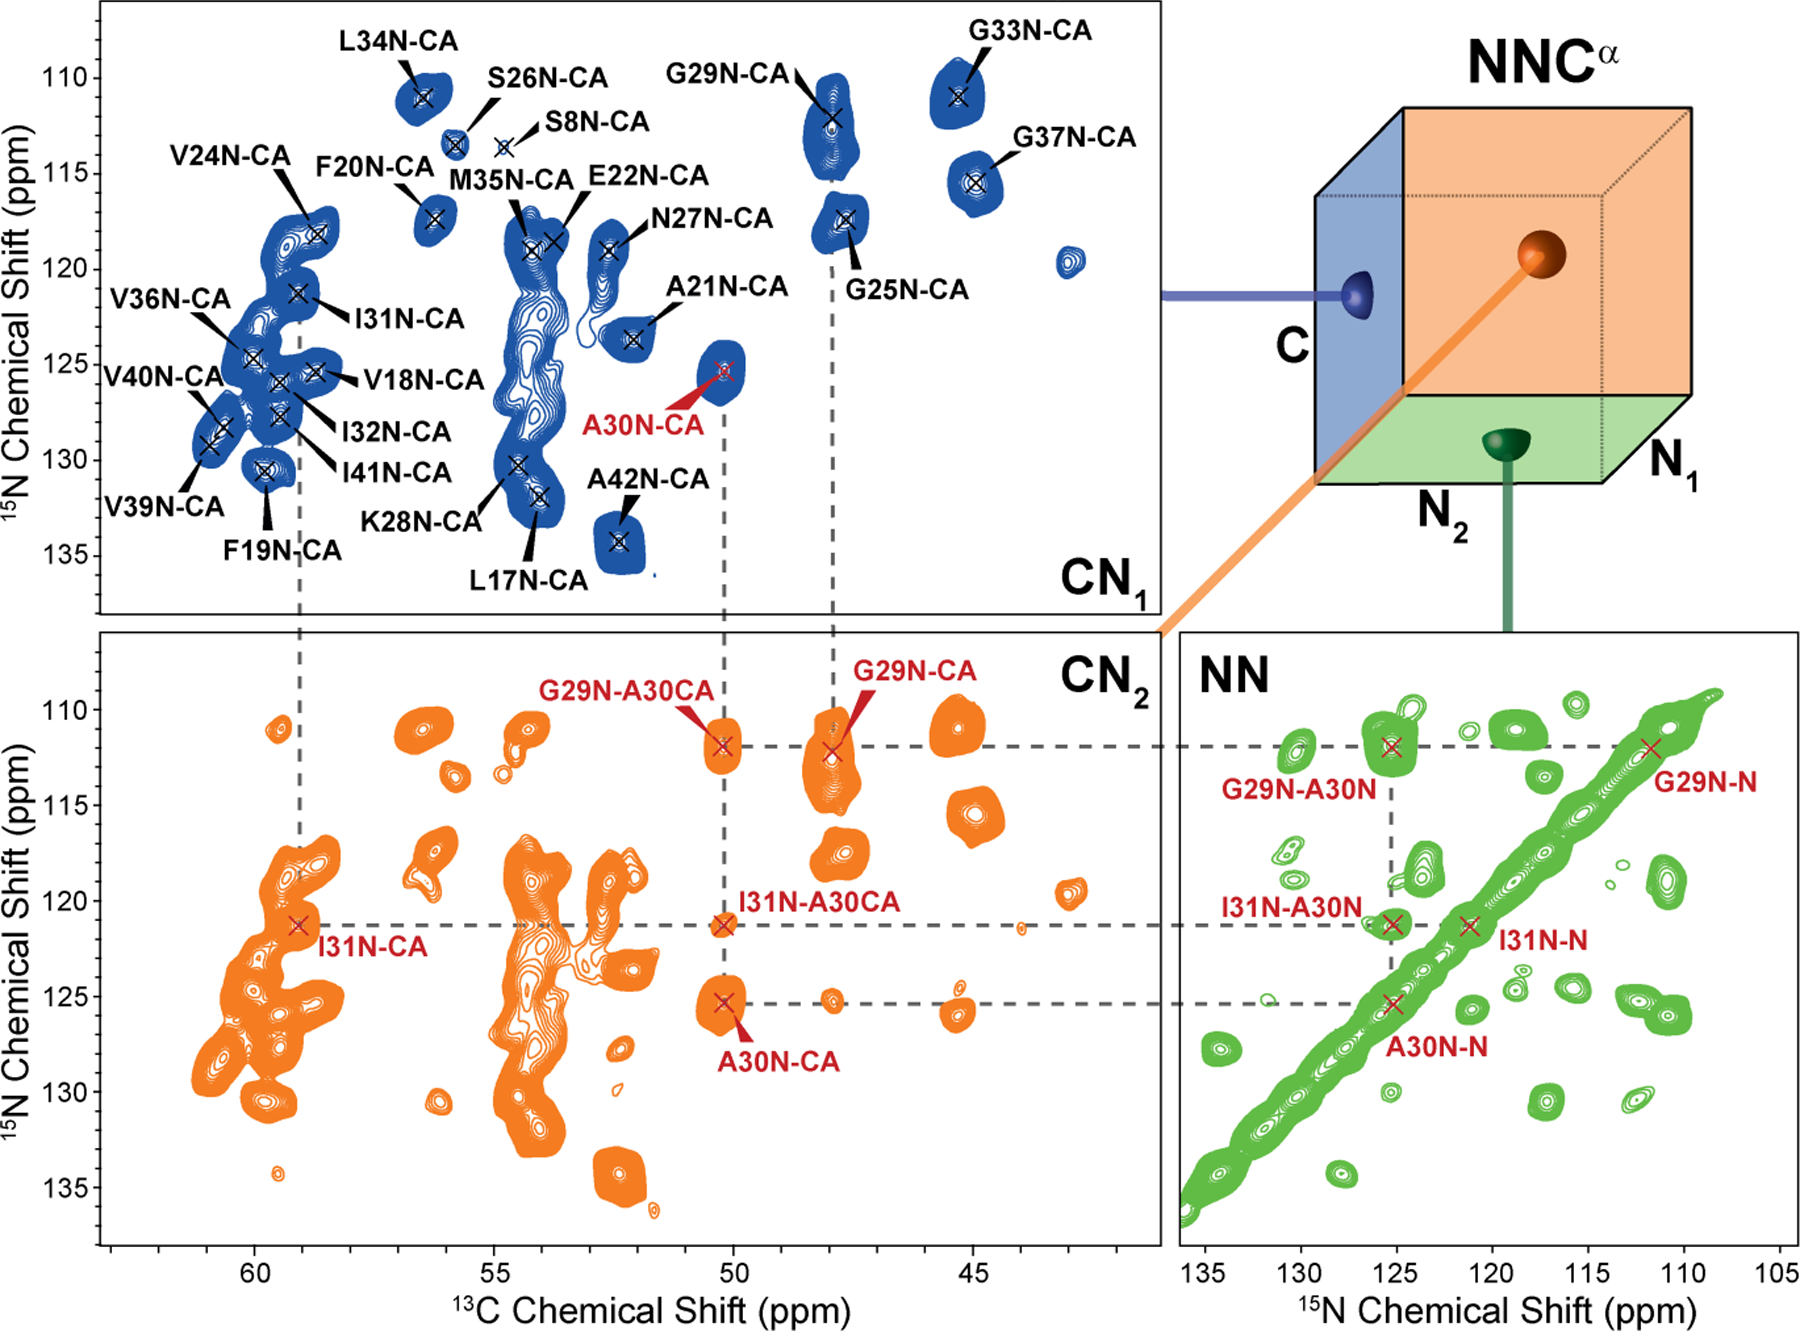
We demonstrate a novel 3D NNC magic angle spinning NMR experiment that generates 15N-15N internuclear contacts in protein systems using an optimized 15N-15N proton assisted recoupling (PAR) mixing period and a 13C dimension for improved resolution. The optimized PAR condition permits the acquisition of high signal-to-noise 3D data that enables backbone chemical shift assignments using a strategy that is complementary to current schemes. The spectra can also provide distance constraints. The utility of the experiment is demonstrated on an M01-42 fibril sample that yields high-quality data that is readily assigned and interpreted. The 3D NNC experiment therefore provides a powerful platform for solid-state protein studies and is broadly applicable to a variety of systems and experimental conditions.


Conflict of interest statement

The authors declare no competing financial interests.

Figures

Figure 1:
Figure 1:
The 3D NNC pulse sequence is shown in A) with phase cycling: ϕ1 = 02, ϕ2 = 0022, ϕ3 = 1, ϕ4 = 2002, ϕ5 = 0123, ϕ6 = 2002 0220, ϕrec = 0123 2301. The CP, PAR, and SPECIFIC-CP blocks are color coded to arrows in (B) illustrating the corresponding magnetization transfer. Additionally, B) contrasts the mode of mixing for the NNC experiment, and commonly used protocols (NCACX, NCOCX, CONCA), illustrating their complementary information due to reliance on separate contacts. C) visualizes the internuclear distances and corresponding dipole coupling values for a range of 15N-15N contacts in α-helices and parallel and anti-parallel β-sheets. The residue interval label (i.e. i ± 1, i ± 2, etc.) is color coded to the lines/arrows illustrating transfer. The 15N-15N inter-strand β-sheet distances are given as approximate averages.
Figure 2:
Figure 2:
2D 15N-15N homonuclear correlation spectra on M01–42. A) gives a comparison of 1D traces extracted from the 2D spectra in B)-D) as indicated by a gray line, with a comparison of measured signal-to-noise (S/N) and total experiment times. Panels B)-D) show a τmix = 12.8 ms 15N-15N RFDR (green), a τmix = 20 ms 15N-15N PAR (red), and a τmix = 4 s 15N-15N PDSD (blue), respectively. Cross-peak assignments are shown.
Figure 3:
Figure 3:
3D NNCα projections of M01–42. One CN projection (CN1) shows one peak per residue correlating the nitrogen and the Cα of the same amino acid i. The second CN projection (CN2) is identical to CN1 plus additional peaks due to NN-mixing. For each Cα/N pair (which forms the diagonal peak) there are peaks that correspond to nearby 15N sites, most prominently the i±1 backbone amide 15N nuclei. The third projection (NN) is identical to a 2D 15N-15N PAR spectrum showing the backbone nitrogen of residue i as diagonal and other peaks (mostly backbone nitrogen of residues i±1) as cross-peaks. The 3D spectrum was recorded on a Bruker Avance III 800 MHz spectrometer at ωr/2π = 20 kHz with temperature set to 277 K. A more detailed assignment is shown in Figure S1.
Figure 4:
Figure 4:
Strip plot of the 3D NNCα of M01–42. Each strip displays the diagonal peak of residue i (blue) and several cross-peaks (red). The most prominent cross-peaks at 20 ms PAR mixing are from residues i±1, although cross-peaks from residues i±2 can be present (*). The sequential backbone walk is indicated by dashed lines. Colors do not indicate sign and are solely used as visual aids.

References

    1. Reif B; Hohwy M; Jaroniec CP; Rienstra CM; Griffin RG, J. Magn.Res 2000, 145, 132–141. - PubMed
    1. Traaseth NJ; Gopinath T; Veglia G, J. Phys. Chem. B 2010, 114, 13872–13880. - PMC - PubMed
    1. van Rossum B-J; Castellani F; Pauli J; Rehbein K; Hollander J; de Groot HJM; Oschkinat H, J. Biomol NMR 2003, 25, 217–223. - PubMed
    1. Seidel K; Etzkorn M; Heise H; Becker S; Baldus M, ChemBioChem 2005, 6, 1638–1647. - PubMed
    1. Franks WT; Wylie BJ; Stellfox SA; Rienstra CM, J. Am. Chem. Soc 2006, 128, 3154–3155. - PubMed

Publication types

MeSH terms

LinkOut - more resources