. 2017 Apr 27:6:e24414.
doi: 10.7554/eLife.24414.

Host-selected mutations converging on a global regulator drive an adaptive leap towards symbiosis in bacteria

Affiliations

Host-selected mutations converging on a global regulator drive an adaptive leap towards symbiosis in bacteria

M Sabrina Pankey et al. Elife. .

Abstract

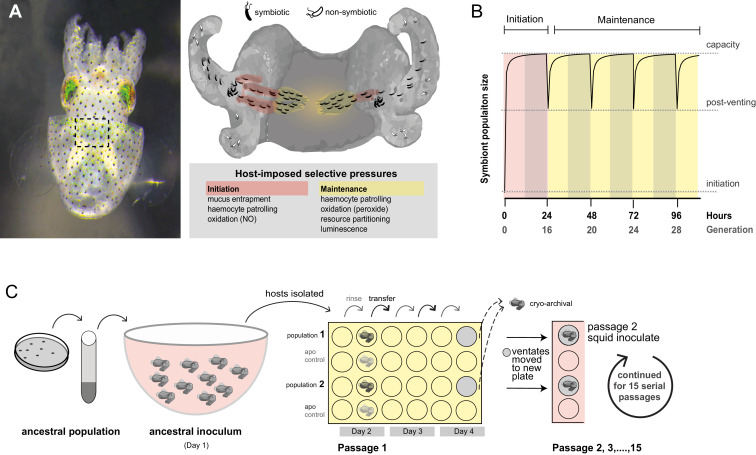
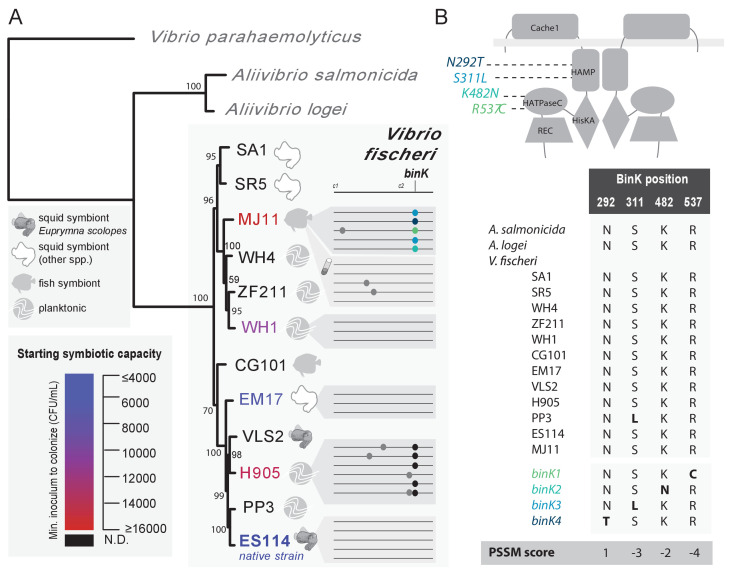
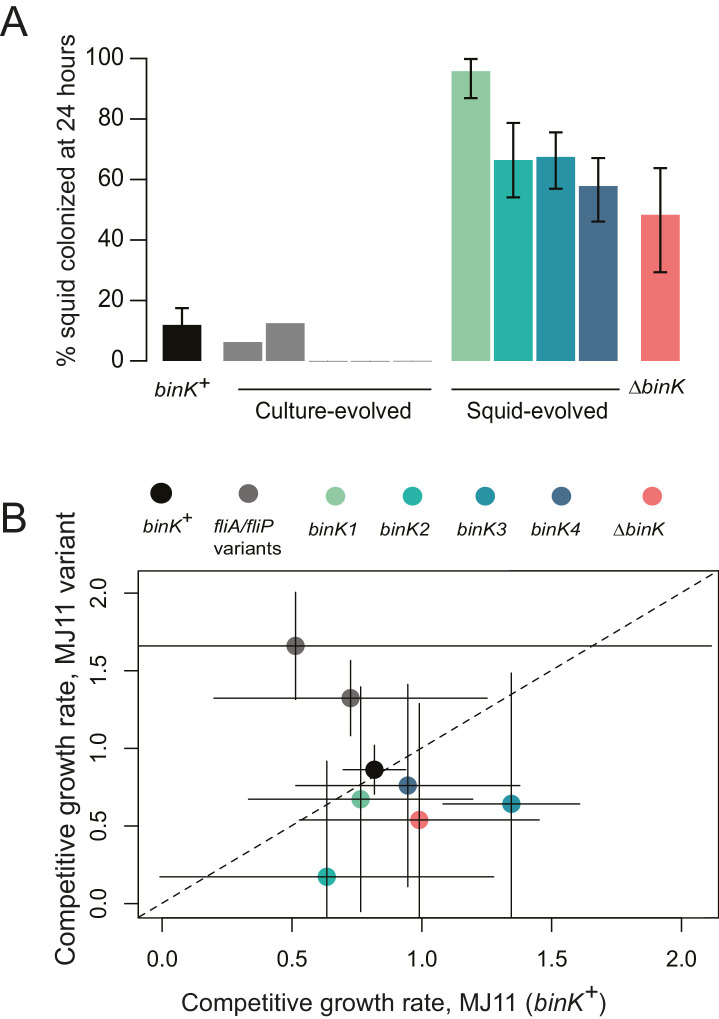
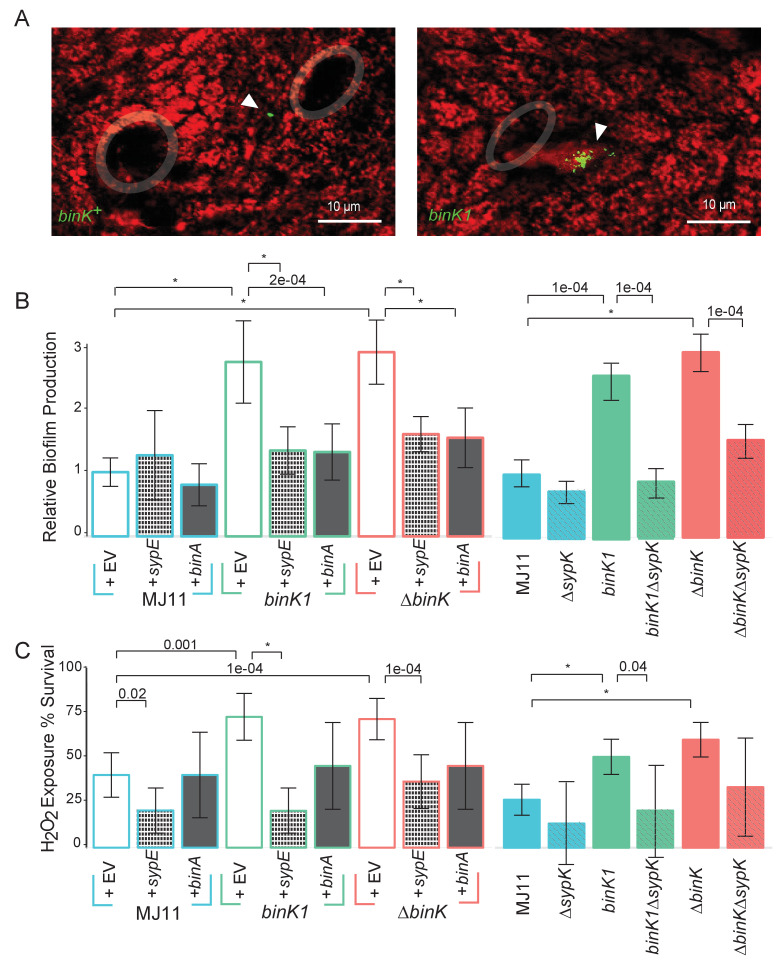
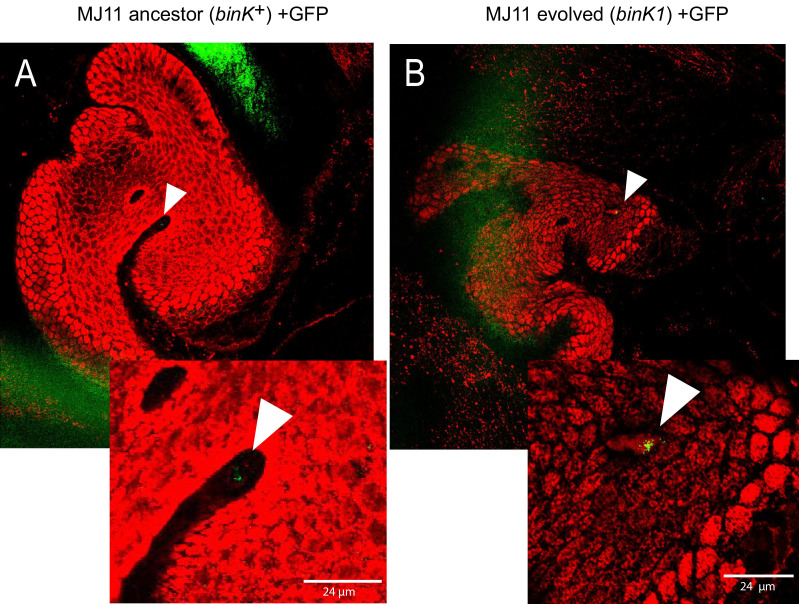
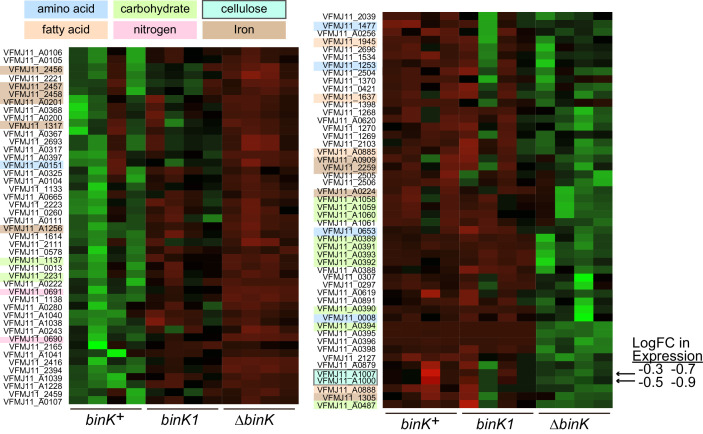
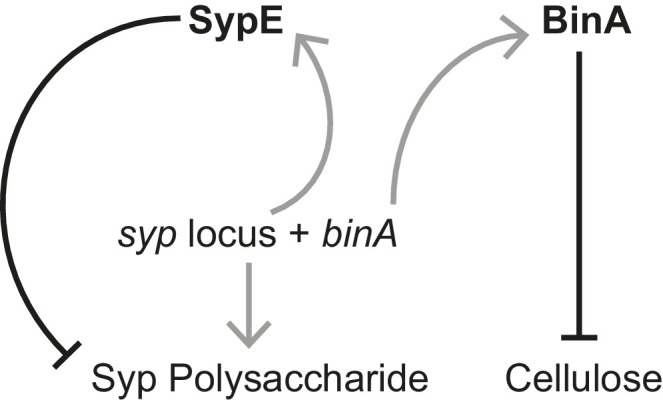
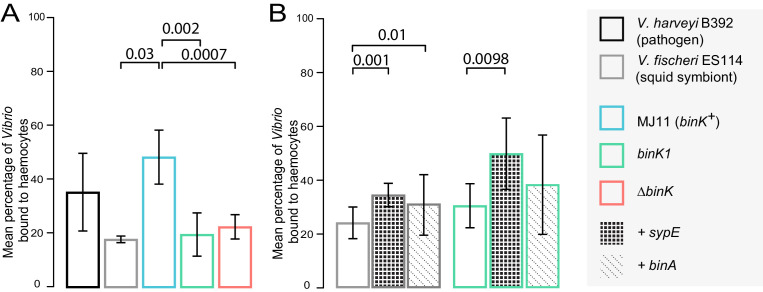
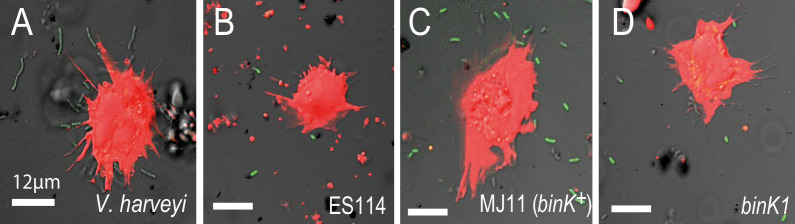
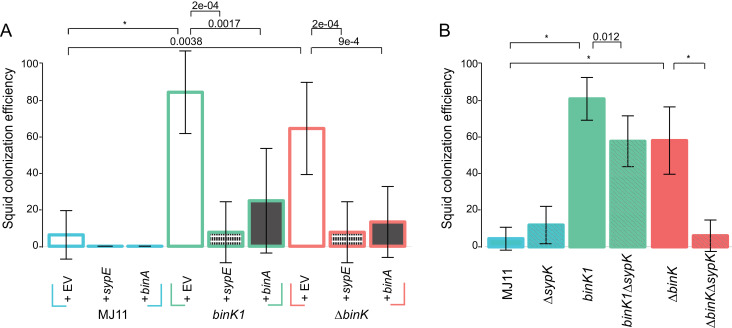
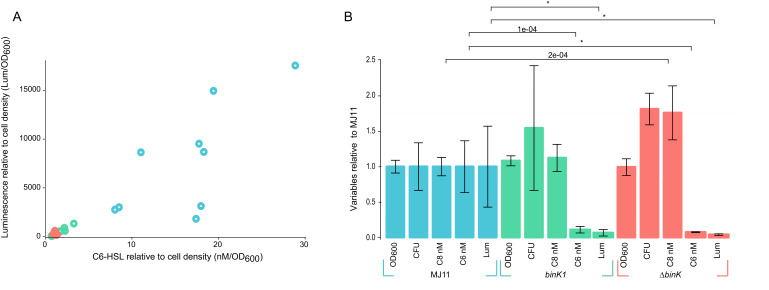
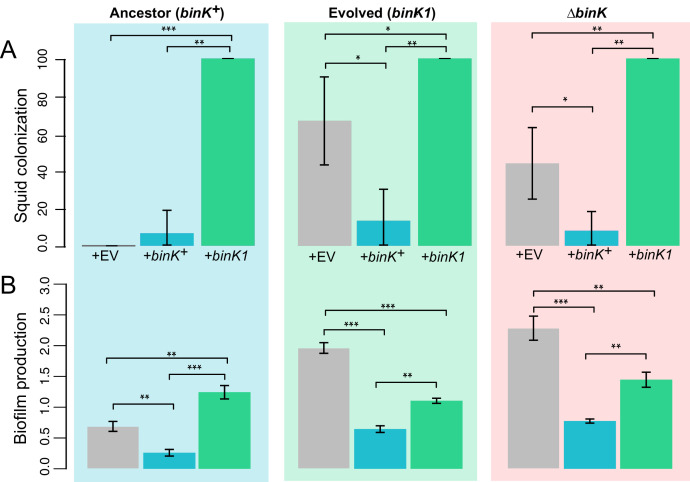
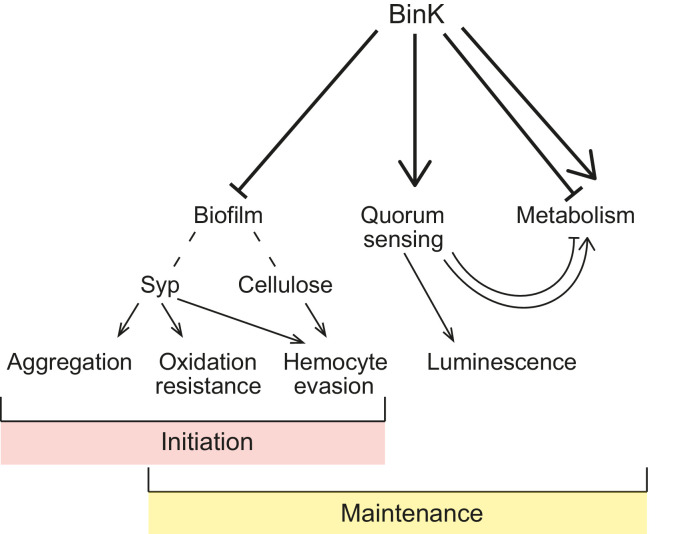
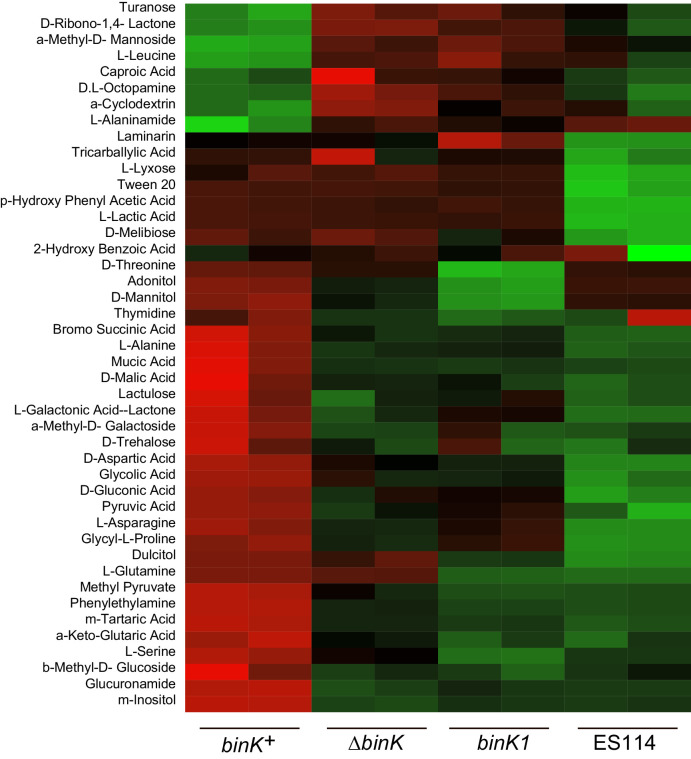
Host immune and physical barriers protect against pathogens but also impede the establishment of essential symbiotic partnerships. To reveal mechanisms by which beneficial organisms adapt to circumvent host defenses, we experimentally evolved ecologically distinct bioluminescent Vibrio fischeri by colonization and growth within the light organs of the squid Euprymna scolopes. Serial squid passaging of bacteria produced eight distinct mutations in the binK sensor kinase gene, which conferred an exceptional selective advantage that could be demonstrated through both empirical and theoretical analysis. Squid-adaptive binK alleles promoted colonization and immune evasion that were mediated by cell-associated matrices including symbiotic polysaccharide (Syp) and cellulose. binK variation also altered quorum sensing, raising the threshold for luminescence induction. Preexisting coordinated regulation of symbiosis traits by BinK presented an efficient solution where altered BinK function was the key to unlock multiple colonization barriers. These results identify a genetic basis for microbial adaptability and underscore the importance of hosts as selective agents that shape emergent symbiont populations.

Keywords: Euprymna scolopes; Vibrio fischeri; evolutionary biology; experimental evolution; genomics; infectious disease; microbiology.


Conflict of interest statement

The authors declare that no competing interests exist.

Figures

Figure 1.
Figure 1.. Host selection mechanisms that shape adaptive evolution by V. fischeri.
(A) Dorsal view of juvenile host E. scolopes (left) with box indicating the relative position of the ventrally situated symbiotic light organ. On the right, a schematic illustrating the stages at which host-imposed selection occurs during squid–V. fischeri symbiosis: host recruitment (mucus entrapment, aggregation at light organ pores), initiation of symbiosis (host defenses, including hemocyte engulfment and oxidative stress), and colonization and maintenance (nutrient provisioning, sanctioning of non-luminous cheaters, continued hemocyte patrolling, and daily purging). (B) Symbiont population growth modeled for a single passage on the basis of growth dynamics of V. fischeri ES114. Light-organ populations are initiated with as few as ~10 cells (Wollenberg and Ruby, 2009; Altura et al., 2013) or as much as 1% of the inoculum, but are reduced by 95% following venting of the light organ at dawn (every 24 hr) (Boettcher et al., 1996). Shaded areas represent night periods whereas light areas represent daylight, which induces the venting behavior. (C) Experimental evolution of V. fischeri under host selection as described in Schuster et al. (2010). Each ancestral V. fischeri population was prepared by recovering cells from five colonies, growing them to mid-log phase, and sub-culturing them into 100 mL filtered seawater at a concentration sufficient to colonize squid (≤20,000 CFU/mL). On day 1, ten un-colonized (non-luminous) juvenile squid were communally inoculated by overnight incubation, during which bacteria were subjected to the first host-selective bottleneck. Following venting of ~95% of the light organ population, the squid were separated into isolated lineages in individual wells of a 24-well polystyrene plate containing filtered sea water with intervening rows of squid from an un-inoculated control cohort, the aposymbiotc control (‘apo control’). Note that only two of the ten passage squid populations are shown. On days 2, 3, and 4, after venting, squid were rinsed and transferred into 2 mL fresh filtered seawater. Luminescence was measured at various intervals for each squid to monitor colonization and the absence of contamination in aposymbiotic control squid. On the fourth day, the squid and half of the ventate were frozen at −80°C to preserve bacteria, and the remaining 1 mL ventate was combined with 1 mL of fresh filtered seawater, and used to inoculate a new uncolonized 24-hr-old juvenile squid. The process continued for 15 squid only for those lineages in which squid were detectably luminous at 48 hr post inoculation. DOI: http://dx.doi.org/10.7554/eLife.24414.003
Figure 2.
Figure 2.. Experimental evolution of Vibrio fischeri produced multiple alleles in the sensor kinase BinK.
(A). Phylogenetic relationship, symbiotic capacity, and mutations accrued during squid experimental evolution of ecologically diverse Vibrio fischeri strains. Strain relationships were inferred under maximum likelihood using whole genomes with RealPhy (Bertels et al., 2014) and with node supports calculated from 1,000 bootstraps. Graphic symbols for ecological niches represent the source of isolation. Intrinsic squid symbiotic capacities of the five experimentally evolved strains, as determined by the minimum inoculum concentration required for successful colonization of 90% of squid with a 3 hr (ES114, EM17, and WH1) or over-night (H905 and MJ11) inoculum, are represented by color spectrum. Consensus genomes for each of the parallel V. fischeri populations evolved through E. scolopes are shown on the right, with variants indicated by circles. Mutation details are shown in Table 2. The mutations that were selected in host-passaged populations improved symbiotic capacity rather than general vigor. (B) BinK mutations arising in squid-evolved populations of MJ11 occurred in the HAMP and HATPaseC domains. A homo-dimer structural model for BinK using TMPRed and hybrid histidine kinase domain modelling (Anantharaman and Aravind, 2000; Stewart and Chen, 2010) predicts that the accessory sensory Cache1 domain localizes to the periplasm whereas the remaining four functional domains (accessory HAMP, and conserved HisKA, HATPaseC, and REC phosphorelay domains) are cytoplasmic (shown as gray band). A position-specific scoring matrix (PSSM) analysis for each of the squid-evolved BinK positions indicates whether a given amino acid is more (positive) or less (negative) likely to be functionally neutral. Scores for the substitutions incurred at these sites are shown in bold. Please refer to Figure 2—figure supplement 1 for a phylogenetic assessment of BinK orthology across Aliivibrio and V. fischeri strains. DOI: http://dx.doi.org/10.7554/eLife.24414.005
Figure 2—figure supplement 1.
Figure 2—figure supplement 1.. BinK orthology, conserved domains and squid-adapted binK alleles.
(A) Unrooted maximum-likelihood (ML) phylogeny of all of the hybrid histidine kinases identified in V. fischeri genomes. Gene families were phylogenetically annotated using Escherichia coli references where possible (not shown), otherwise using the ES114 locus tag. DOI: http://dx.doi.org/10.7554/eLife.24414.006
Figure 3.
Figure 3.. Evolved binK alleles enhanced host colonization and conferred a fitness tradeoff in non-host environments.
(A) Symbiotic colonization efficiency of MJ11 and derivatives in squid. Percentage of squid colonized by culture-evolved (c1–c5) and squid-evolved (binK1- binK4, bolded isolates in Table 2) derivatives of MJ11. Three hours after a cohort of 10–20 squid were inoculated with 3000 CFU/mL of each MJ11 strain, the squid were separated into individual vials, and colonization percentages determined by detectable luminescence at 24 hr. Bars: 95% CI. (B) Growth rates of MJ11 and evolved strains during competition in laboratory culture. Average growth rates (realized Malthusian parameters) of ΔbinK, squid-evolved binK and culture-evolved flagellar mutants (fliA and fliP variants, see Table 2) following in vitro culture competition in minimal media with ancestral binK+ MJ11, estimated using CFU yields of each competitor recovered at regular intervals. Bars: 95% CI. The diagonal line indicates 1:1 growth. Please refer to Figure 3—figure supplement 1 for data on the competitive abilities of binK1 and binK3 during colonization. Please refer to Figure 3—figure supplement 2 for symbiotic yields (CFU) of ES114 and MJ11 strains after 24 and 48 hr. DOI: http://dx.doi.org/10.7554/eLife.24414.008
Figure 3—figure supplement 1.
Figure 3—figure supplement 1.. Relative competitive ability of binK1 and binK3 variants to colonize squid.
In vivo competitions suggest no competitive advantage in squid colonization between evolved V. fischeri MJ11 variants carrying either HAMP or HATPaseC domain mutations. Relative competitive indices for binK1 and binK3 MJ11 variants (carrying HATPaseC and HAMP domain mutations, respectively) used to co-inoculate squid across a range of inoculum densities. Points above or below zero represent squid light organs that are dominated by bink3 or bink1, respectively. DOI: http://dx.doi.org/10.7554/eLife.24414.009
Figure 3—figure supplement 2.
Figure 3—figure supplement 2.. Growth of strain ES114 and strain MJ11 and its binK variants in squid light organs 24 or 48 hr after inoculation.
Yields of symbionts determined by plating serial dilutions of squid homogenate as described previously (Whistler and Ruby, 2003). Note: the Y-axis is log-scaled. Bars: 95% CI. DOI: http://dx.doi.org/10.7554/eLife.24414.010
Figure 4.
Figure 4.. Empirical and modeled estimates of selective advantage in evolving V. fischeri symbiont populations.
(A) Conceptual overview of symbiont population dynamics during growth in inoculum and following host colonization (black line), including daily host-imposed bottlenecks. (B) Comparison of the selection coefficients conferred by binK1 in strain MJ11EP2-4-1 (harboring no other mutations) relative to binK+ from co-inoculated squid light organs after 24 or 48 hr. The selective advantage (i.e., relative competitiveness) of the evolved allele increased significantly during this period from 1.1 to 1.8 (Fisher-Pitman permutation test, **p=0.0011). Each circle represents the selective advantage of each strain measured from the strain ratios recovered in an individual hatchling. Please refer to Figure 4—figure supplement 1 for the effect of starting binK1 frequencies and inoculum densities on estimates of selective advantage. (C) Modeled survival probabilities for new beneficial alleles arising in a growing symbiont population facing host-imposed bottlenecks. The gray shaded curves estimate the survival probability of new mutants following the subsequent population bottleneck, which depends on both the generation of growth in the inoculum or host in which they arise (x-axis) and the selective advantage (s) conferred by mutation (gray shading). Notably, beneficial variants that arise early in inoculum culture are likely to survive extinction at the subsequent bottleneck, and this probability of survival rapidly decreases even when conferring a large selective coefficient. On the basis of this model, for example, a mutation conferring a large selective advantage (s ~2) would have less than a 10% chance of surviving the subsequent colonization bottleneck if it arose during the tenth generation of inoculum growth (red line). DOI: http://dx.doi.org/10.7554/eLife.24414.011
Figure 4—figure supplement 1.
Figure 4—figure supplement 1.. Estimates of the selective advantage of the binK1 allele during squid colonization across a range of starting frequencies and inoculum densities.
Comparison of selection coefficients conferred by binK1 in strain MJ11EP2-4-1 (‘Evo’) (harboring no other mutations) relative to binK+ (‘Anc’) from co-inoculated squid light organs. Each point represents the selective advantage of each strain measured from the strain ratios recovered in an individual hatchling. The estimated selective advantage conferred by the evolved binK1 allele was not influenced by starting frequency (A) (R2 = 0.025, pfrequency = 0.62), but it was marginally influenced by density (B) (R2 = 0.025, pdensity = 0.03), based on a multiple regression analysis. DOI: http://dx.doi.org/10.7554/eLife.24414.012
Figure 5.
Figure 5.. Host-adapted binK1 improved initiation phenotypes through enhanced biofilm.
(A) V. fischeri MJ11 aggregate formation near light-organ ducts. Host tissue stained with CellTracker Orange. Symbionts carry GFP plasmids (pKV111) (Nyholm et al., 2000). Micrographs show representative V. fischeri aggregates following the dissection of 30 newly hatched animals incubated with each strain. Aggregates were visualized between 2 and 3hr after of inoculation using a Zeiss LSM 510 Meta laser-scanning confocal microscope. Please refer to Figure 5—figure supplement 1 for additional views of aggregate formation. (B) Biofilm production (crystal violet staining relative to MJ11) by wild-type MJ11(binK+), squid-adaptive binK1 and ∆binK variants in the presence of either empty vector (EV, pVSV105) (white fill), Syp biofilm repressor sypE (pCLD48) (hatched fill), or cellulose repressor binA (pRF2A3) (gray fill). n = 12–16 biological replicates. See Figure 5—figure supplement 2 for evidence of increased cellulose in binK variants, and Figure 5—figure supplement 3 for biofilm repressor schematic. Followed by influence of a sypK deletion on biofilm production of MJ11 and binK variants. n = 10 biological replicates. (C) Binomial mean of survival following exposure to hydrogen peroxide of wild-type MJ11(binK+), squid-adaptive binK1 and ∆binK variants in the presence of either empty vector (EV, pVSV105) (white fill), sypE (pCLD48) (hatched fill), or binA (pRF2A3) (gray fill). n = 20–50 biological replicates. Followed by influence of a sypK deletion (diagonal line overlay) on population survival of MJ11 and binK variants (color fill). n = 15–106 biological replicates. Error bars 95% CI. Significant p values (p<0.05) are indicated above each comparison. *p<2.2e-16. Although the effects of overexpression of binA and deletion of sypK on oxidative resistance in the ∆binK variant followed the same trends as these genes in binK1, the reductions were only marginally significant (p=0.051 and 0.15, respectively). Please refer to Figure 5—figure supplement 2 for transcriptomic evidence of reduced expression of two cellulose loci in the ∆binK mutant. A schematic of the impact of the BinA and SypE repressors on biofilm substrates is available as Figure 5—figure supplement 3. DOI: http://dx.doi.org/10.7554/eLife.24414.013
Figure 5—figure supplement 1.
Figure 5—figure supplement 1.. In vivo aggregation behavioral changes conferred by evolved binK1 variant.
(A–B) Aggregation of ancestral (A) and evolved (B) MJ11 on host mucosal epithelium prior to colonization. Host tissue stained with CellTracker Orange. Symbionts carry GFP plasmids (pKV111) (Nyholm et al., 2000). Micrographs show representative V. fischeri aggregates following the dissection of 30 newly hatched animals incubated with each strain. Aggregates were visualized between 2 and 3 hr after inoculation using a Zeiss LSM 510 Meta laser scanning confocal microscope. Scale bars: 24 μm. DOI: http://dx.doi.org/10.7554/eLife.24414.014
Figure 5—figure supplement 2.
Figure 5—figure supplement 2.. Transcriptional shifts associated with binK variants.
Transcriptomic differences between wild-type MJ11 (binK+), squid-adapted MJ11 binK1, and MJ11 ∆binK for the coding loci in the MJ11 genome as determined by RNA-Seq. Variants were sampled during early log growth (OD600 ~0.25) in rich media (SWTO) prior to detectable biofilm production from four biological replicates for each strain. Green indicates increased expression; red indicates reduced expression relative to mean expression per locus (i.e., read counts z-scaled relative to mean logCPM). The heat map only displays loci for which mean expression in a binK variant differed from that in MJ11 at a FDR significance threshold of 0.05 (Table 3). The colored labels refer to compounds whose metabolism, transport, or synthesis are affected by the expression of these genes. Genes involved in cellulose synthesis are indicated with arrows (VFMJ11_A1000- cellulose synthase operon C protein, and VFMJ11_A1007- cellulose synthase operon protein YhjU) and log fold change (logFC) relative to wild-type is indicated for binK1 and then ∆binK. DOI: http://dx.doi.org/10.7554/eLife.24414.015
Figure 5—figure supplement 3.
Figure 5—figure supplement 3.. Schematic of regulation by the biofilm repressors SypE and BinA.
SypE represses Syp biofilm production post transcriptionally (Morris and Visick, 2013). BinA represses cellulose, but not Syp, biofilm formation by increasing phosphodiesterase activity (Bassis and Visick, 2010). Black-capped lines indicate negative regulation. Gray arrows indicate transcription/translation. Note that because binA is expressed from a syp locus promoter, activation of the syp locus leading to Syp production also leads to repression of cellulose. DOI: http://dx.doi.org/10.7554/eLife.24414.016
Figure 6.
Figure 6.. Biofilm production by squid-adaptive binK1 variants mediates hemocyte evasion.
(A) Relative efficiency of squid hemocyte binding of GFP-labelled V. fischeri strains including: squid-native symbiont ES114, binK+ MJ11, ∆binK MJ11 (RF1A4), binK1 MJ11, and shellfish pathogen V. harveyi B392. (B) Relative efficiency of squid hemocyte binding of squid-native symbiont ES114 and squid-adapted bink1 MJ11 carrying the empty vector (pVSV104), sypE (pRF2A1) or binA (pRF2A4). N = 30–52 hemocytes quantified per strain. Error bars: 95% CI. Significant p-values (p<0.05) are indicated above each comparison. Please refer to Figure 6—figure supplement 1 for micrographs of Vibrio–hemocyte interactions. DOI: http://dx.doi.org/10.7554/eLife.24414.017
Figure 6—figure supplement 1.
Figure 6—figure supplement 1.. In vitro response of squid hemocytes to wild, squid-evolved and mutant Vibrio.
The micrographs show examples of hemocyte-bound non-symbiotic (A: Vibrio harveyi), squid-symbiotic (B: V. fischeri ES114), squid-naive (C: V. fischeri MJ11 binK+) and squid-adapted (D: MJ11 binK1) cells. The mean number of GFP-labelled Vibrio cells bound by hemocytes was quantified relative to total bacterial count in a 60 µm radius using confocal microscopy at 63X magnification, following one hour of bacterial exposure. Squid hemocytes in red (CellTracker Orange), Vibrio in green (GFP). Scale bars: 12 μm. DOI: http://dx.doi.org/10.7554/eLife.24414.018
Figure 7.
Figure 7.. Contribution of Syp and cellulose to improved squid colonization by binK variants.
(A) Colonization efficiency (% colonized squid at 24 hr) by wild-type MJ11 (binK+), squid-adaptive binK1 and ∆binK variants in the presence of empty vector (EV, pVSV105) (white fill), the Syp repressor sypE (pCLD48) (hatched fill), or the cellulose repressor binA (pRF2A3) (gray fill). n = 15–20 biological replicates. (B) Influence of a sypK deletion on colonization efficiency of MJ11 and binK variants. n = 31–52 biological replicates. Error bars: 95% CI. Significant p-values (p<0.05) are indicated above each comparison. *p<2.2e-16. DOI: http://dx.doi.org/10.7554/eLife.24414.019
Figure 8.
Figure 8.. Host-adapted binK1 attenuates quorum-sensing regulation of luminescence.
(A) Supernatant concentrations (nM/OD600) of N-(3-oxohexanoyl) homoserine lactone (C6-HSL), as quantified against synthetic standards (Schaefer et al., 2000; Pearson et al., 1994; Duerkop et al., 2007) and corresponding luminescence (Lum/OD600) of 10 independent cultures each for wild-type MJ11, binK1 and ΔbinK derivatives during quorum-sensing induction of luminescence determined from cultures grown to early log (Average OD600 1.1, range 0.9–1.4,). (B) Average cell density as measured by absorbance (OD600), colony-forming units (CFU)/mL/OD600, N-(3-oxohexanoyl) homoserine lactone (C6) nM concentration, N-octanoyl homoserine lactone (C8) nM concentration, and luminescence (Lum)/1 mL culture for ten biological replicates of each variant relative to wild-type MJ11. Error bars: 95% CI. Significant p-values (p<0.05) are indicated above each comparison. *p<2.2e-16. DOI: http://dx.doi.org/10.7554/eLife.24414.020
Figure 9.
Figure 9.. Effect of binK on squid colonization and biofilm production.
(A) Improvement in colonization by multi-copy in trans expression of the evolved binK1 allele and decreased colonization by expression of the ancestral binK+ allele. Colonization assessed by percentage of squid that are luminous after 24 hr. Error bars: 95% CI. N = 15–25. (B) Increased biofilm production resulting from in trans expression of the binK1 allele, and decreased biofilm production resulting from expression of the ancestral binK+. Comparisons of biofilm production in control-plasmids (pVSV105= EV) with that in multi-copy plasmids carrying binK suggest an inhibitory role for BinK in biofilm production, presumably alleviated by the dominance of the binK1 allele. Biofilm production was quantified by absorbance of crystal violet at A550. Background color depicts strain background in which multicopy plasmid effects were measured, mirroring those used throughout where blue is wild-type MJ11, green is the evolved binK1 variant and salmon is the ∆binK derivative. Error bars: 95% CI; non-overlap indicates significance. N = 7–8. Significant p-values (p<0.05) are indicated above each comparison. *p<0.05, **p<0.005, ***p<0.005. DOI: http://dx.doi.org/10.7554/eLife.24414.021
Figure 10.
Figure 10.. Model of BinK regulation of traits adaptive during squid symbiosis.
Arrows originating from BinK point to characteristics that are activated or enhanced, and blocked lines point to those that are repressed or blocked by BinK. Hashed lines point to polysaccharides that contribute to biofilm. DOI: http://dx.doi.org/10.7554/eLife.24414.022
Appendix 1—figure 1.
Appendix 1—figure 1.. Siderophore production in MJ11 and binK variants.
(A) Squid-native ES114, (B) squid-naïve MJ11 binK+ and (c) squid-evolved binK1 plated on CAS agar. DOI: http://dx.doi.org/10.7554/eLife.24414.027
Appendix 2—figure 1.
Appendix 2—figure 1.. Metabolic shifts associated with binK variants.
Significantly differing metabolic responses to BIOLOG compounds for wild-type MJ11 (binK+), squid-adapted MJ11 binK1, MJ11 ∆binK and squid-native ES114. Responses to all tested compounds are reported in the Figure Supplement. DOI: http://dx.doi.org/10.7554/eLife.24414.034
Appendix 2—figure 2.
Appendix 2—figure 2.. Metabolic profiles using BIOLOG phenotyping assays.
Plots enclosed by boxes indicate substrates that are significantly differentially metabolized across strains (listed in Table 2). X-axis represents time (0–48 hr); Y-axis represents metabolic activity as detected by BIOLOG redox (tetrazolium) dye absorbance (OD490). DOI: http://dx.doi.org/10.7554/eLife.24414.035

Similar articles

Cited by

References

    1. Altura MA, Heath-Heckman EA, Gillette A, Kremer N, Krachler AM, Brennan C, Ruby EG, Orth K, McFall-Ngai MJ. The first engagement of partners in the Euprymna scolopes-Vibrio fischeri symbiosis is a two-step process initiated by a few environmental symbiont cells. Environmental Microbiology. 2013;15:2937–2950. doi: 10.1111/1462-2920.12179. - DOI - PMC - PubMed
    1. An JH, Goo E, Kim H, Seo YS, Hwang I. Bacterial quorum sensing and metabolic slowing in a cooperative population. PNAS. 2014;111:14912–14917. doi: 10.1073/pnas.1412431111. - DOI - PMC - PubMed
    1. Anantharaman V, Aravind L. Cache - a signaling domain common to animal ca(2+)-channel subunits and a class of prokaryotic chemotaxis receptors. Trends in Biochemical Sciences. 2000;25:535–537. doi: 10.1016/S0968-0004(00)01672-8. - DOI - PubMed
    1. Bassis CM, Visick KL. The cyclic-di-GMP phosphodiesterase BinA negatively regulates cellulose-containing biofilms in Vibrio fischeri. Journal of Bacteriology. 2010;192:1269–1278. doi: 10.1128/JB.01048-09. - DOI - PMC - PubMed
    1. Baym M, Kryazhimskiy S, Lieberman TD, Chung H, Desai MM, Kishony R. Inexpensive multiplexed library preparation for megabase-sized genomes. PLoS One. 2015;10:e0128036. doi: 10.1371/journal.pone.0128036. - DOI - PMC - PubMed

Substances

LinkOut - more resources