

The potential economic burden of Zika in the continental United States
- PMID: 28448488
- PMCID: PMC5407573
- DOI: 10.1371/journal.pntd.0005531
The potential economic burden of Zika in the continental United States
Abstract
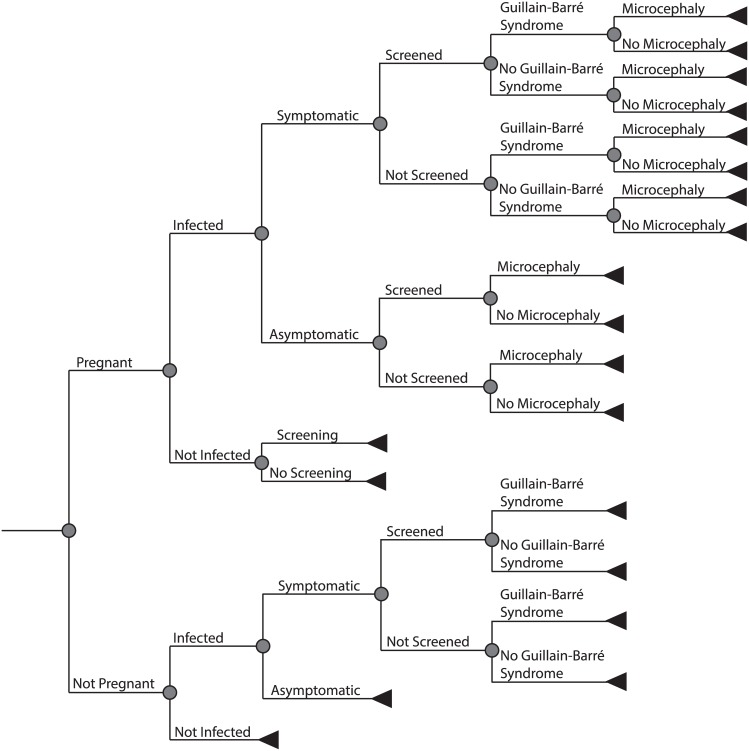
Background: As the Zika virus epidemic continues to spread internationally, countries such as the United States must determine how much to invest in prevention, control, and response. Fundamental to these decisions is quantifying the potential economic burden of Zika under different scenarios.
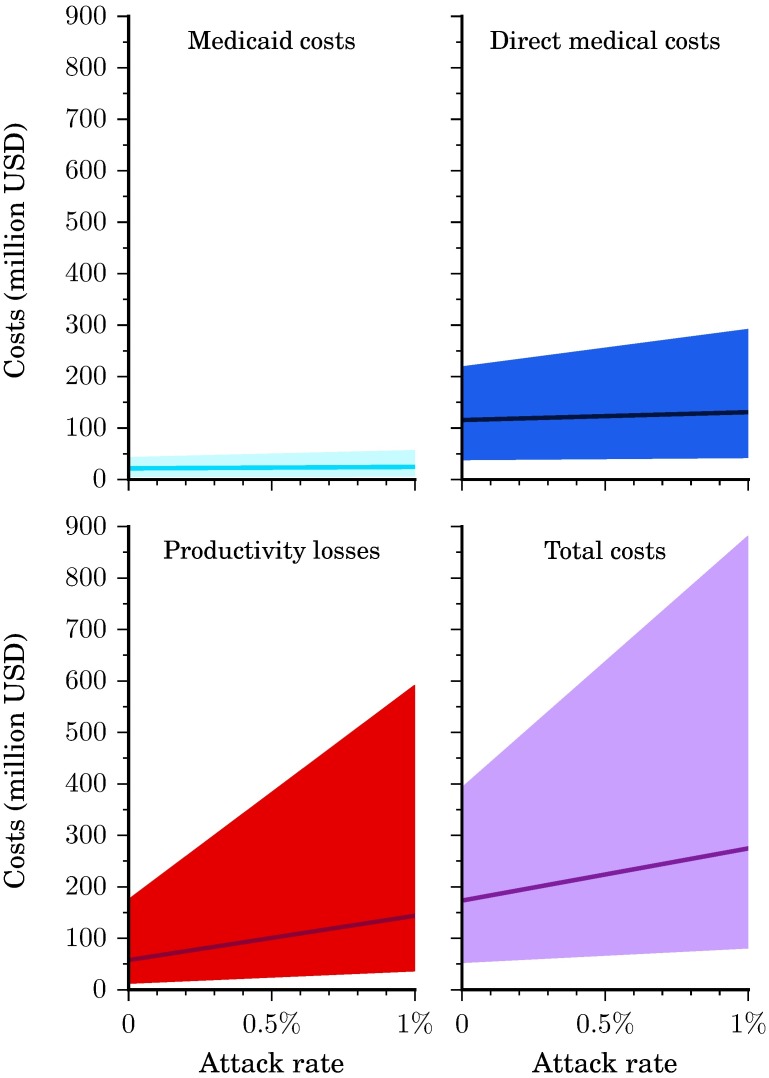
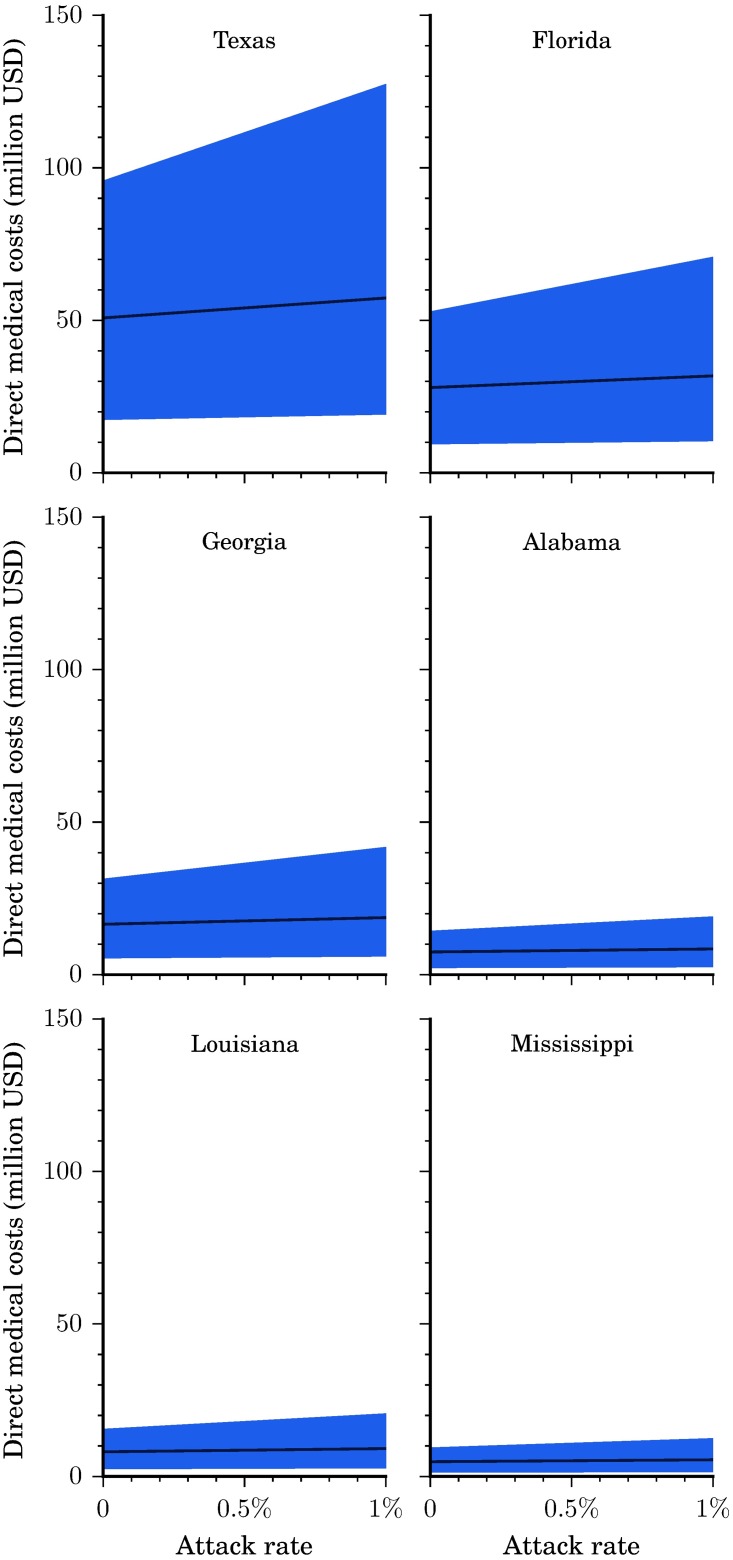
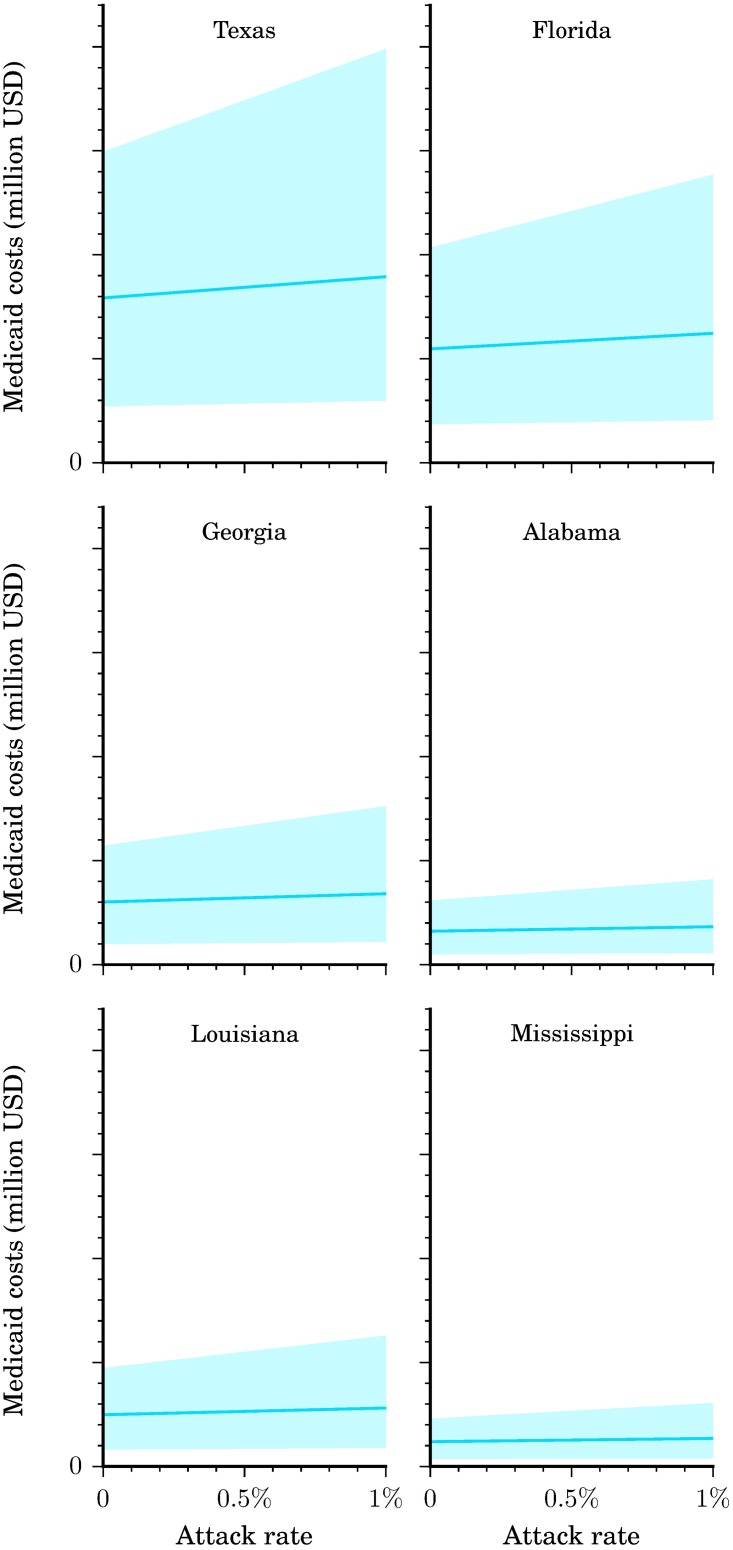
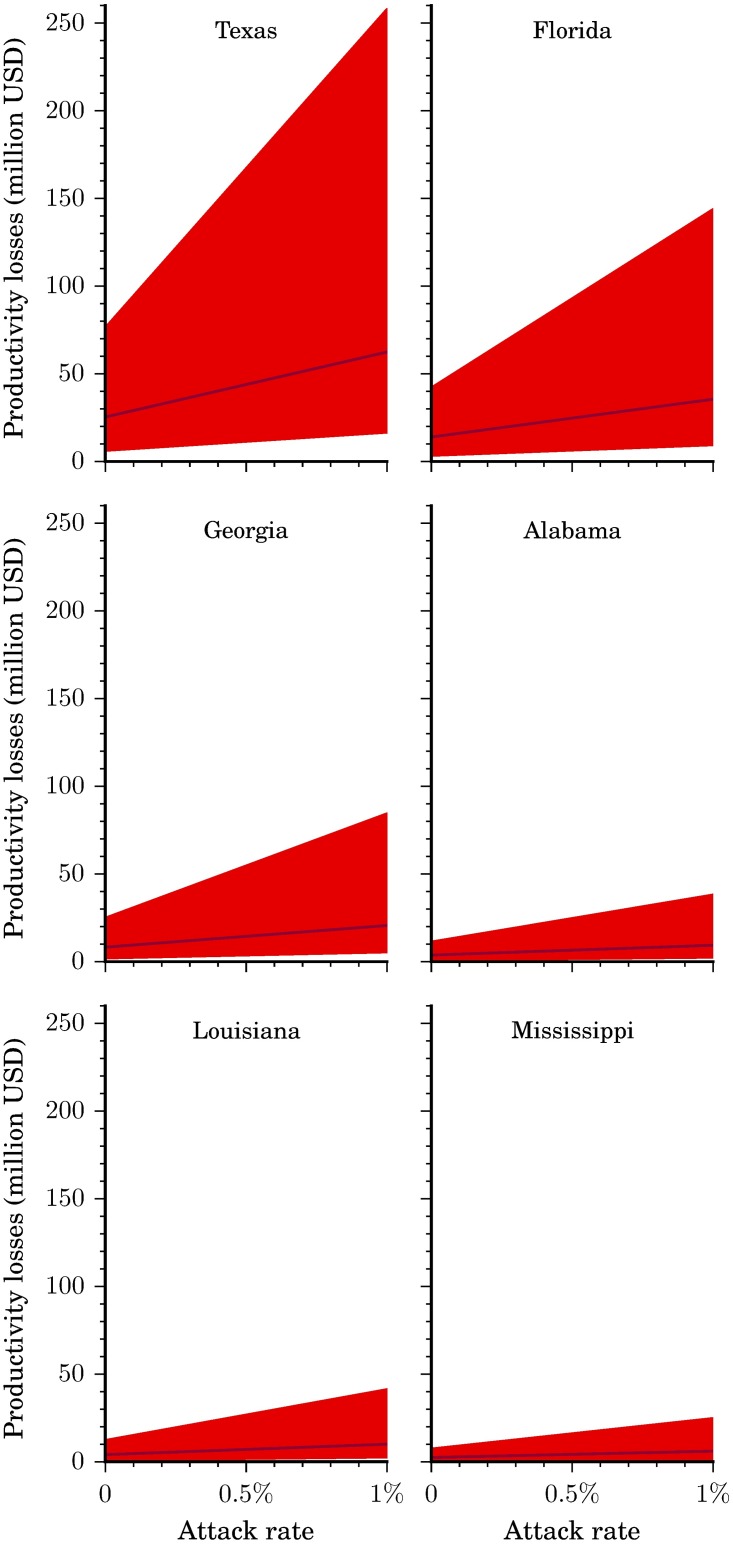
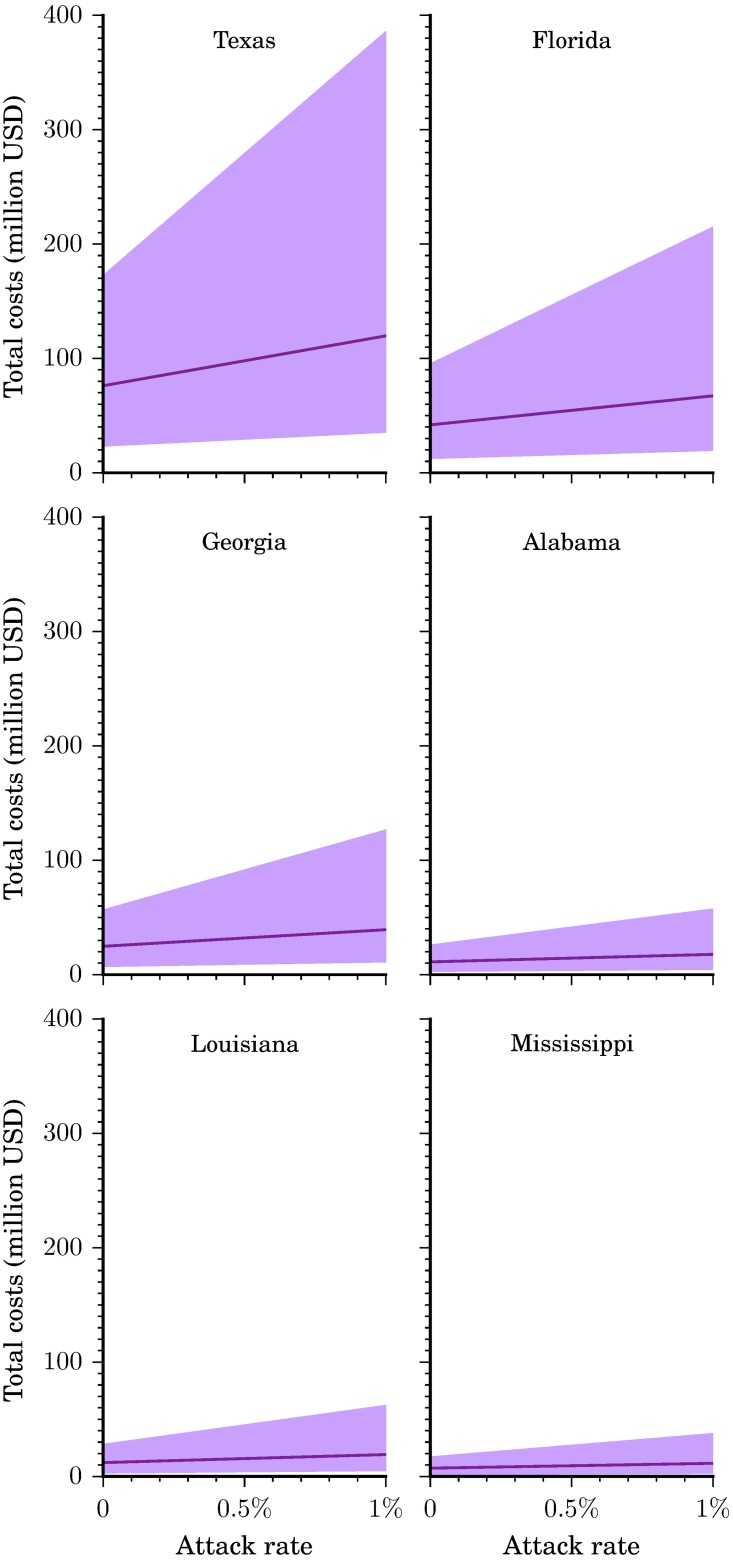
Methodology/principle findings: To inform such decision making, our team developed a computational model to forecast the potential economic burden of Zika across six states in the US (Alabama, Florida, Georgia, Louisiana, Mississippi, and Texas) which are at greatest risk of Zika emergence, under a wide range of attack rates, scenarios and circumstances. In order to accommodate a wide range of possibilities, different scenarios explored the effects of varying the attack rate from 0.01% to 10%. Across the six states, an attack rate of 0.01% is estimated to cost $183.4 million to society ($117.1 million in direct medical costs and $66.3 million in productivity losses), 0.025% would result in $198.6 million ($119.4 million and $79.2 million), 0.10% would result in $274.6 million ($130.8 million and $143.8 million) and 1% would result in $1.2 billion ($268.0 million and $919.2 million).
Conclusions: Our model and study show how direct medical costs, Medicaid costs, productivity losses, and total costs to society may vary with different attack rates across the six states and the circumstances at which they may exceed certain thresholds (e.g., Zika prevention and control funding allocations that are being debated by the US government). A Zika attack rate of 0.3% across the six states at greatest risk of Zika infection, would result in total costs that exceed $0.5 billion, an attack rate of 1% would exceed $1 billion, and an attack rate of 2% would exceed $2 billion.
Conflict of interest statement
The authors have declared that no competing interests exist.
Figures
References
-
- Editorial Board. It’s us against Zika—whose side is Congress on?. The Washington Post [Internet]. 2016 27 Jun 2016. https://www.washingtonpost.com/opinions/its-us-against-zika—whose-side-i....
-
- DeBonis M. Why Republicans are opposing President Obama's request for Zika funding. The Washington Post [Internet]. 2016 8 May 2016. https://www.washingtonpost.com/news/powerpost/wp/2016/04/28/why-republic....
-
- Oehler E, Watrin L, Larre P, Leparc-Goffart I, Lastere S, Valour F, et al. Zika virus infection complicated by Guillain-Barre syndrome—case report, French Polynesia, December 2013. Euro Surveill. 2014;19(9). - PubMed
Publication types
MeSH terms
Grants and funding
LinkOut - more resources
Full Text Sources
Other Literature Sources
Medical
Research Materials
