

Determinants of severe dehydration from diarrheal disease at hospital presentation: Evidence from 22 years of admissions in Bangladesh
- PMID: 28448489
- PMCID: PMC5423662
- DOI: 10.1371/journal.pntd.0005512
Determinants of severe dehydration from diarrheal disease at hospital presentation: Evidence from 22 years of admissions in Bangladesh
Abstract
Background: To take advantage of emerging opportunities to reduce morbidity and mortality from diarrheal disease, we need to better understand the determinants of life-threatening severe dehydration (SD) in resource-poor settings.
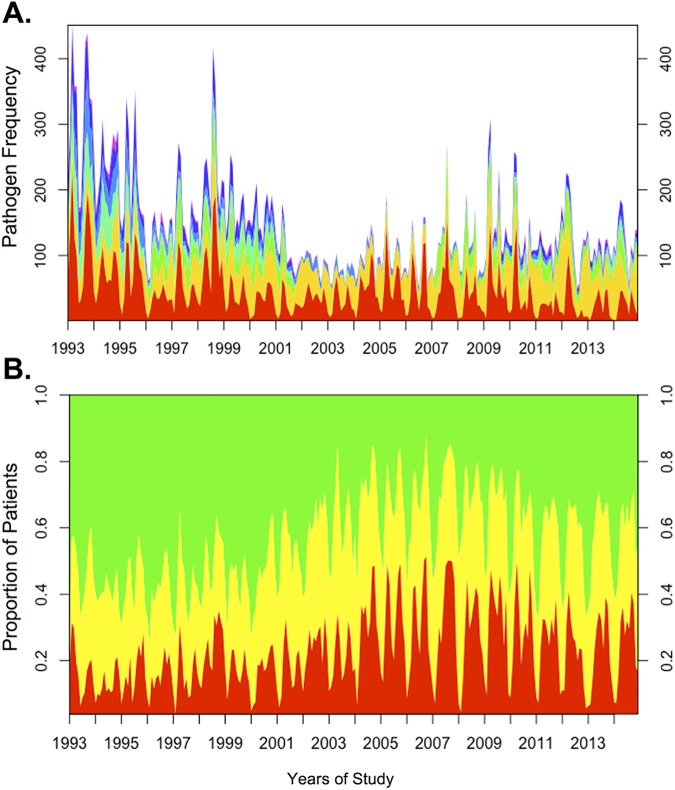
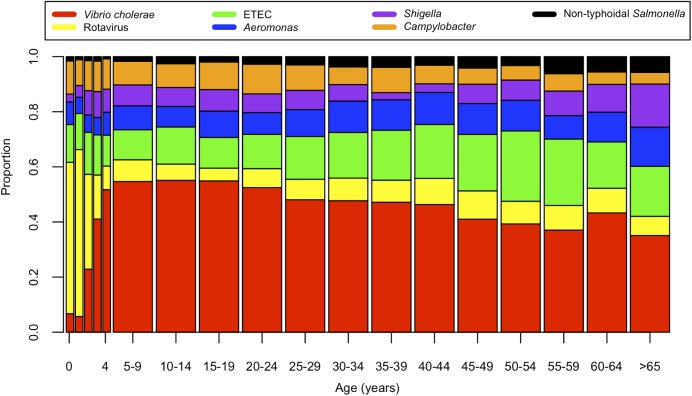
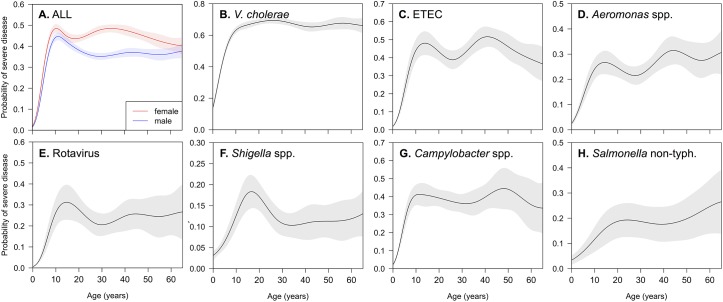
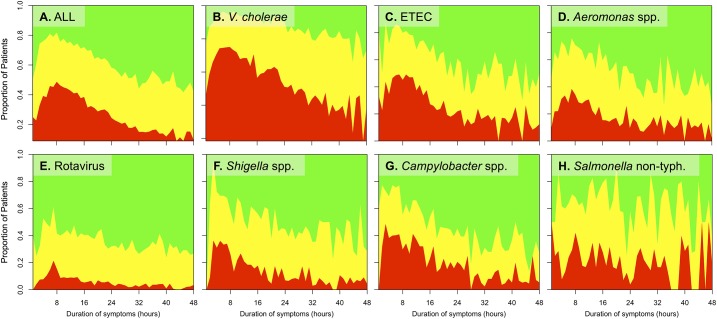
Methodology/findings: We analyzed records of patients admitted with acute diarrheal disease over twenty-two years at the International Centre for Diarrhoeal Disease Research, Bangladesh (1993-2014). Patients presenting with and without SD were compared by multivariable logistic regression models, which included socio-demographic factors and pathogens isolated. Generalized additive models evaluated non-linearities between age or household income and SD. Among 55,956 admitted patients, 13,457 (24%) presented with SD. Vibrio cholerae was the most common pathogen isolated (12,405 patients; 22%), and had the strongest association with SD (AOR 4.77; 95% CI: 4.41-5.51); detection of multiple pathogens did not exacerbate SD risk. The highest proportion of severely dehydrated patients presented in a narrow window only 4-12 hours after symptom onset. Risk of presenting with SD increased sharply from zero to ten years of age and remained high throughout adolescence and adulthood. Adult women had a 38% increased odds (AOR 1.38; 95% CI: 1.30-1.46) of SD compared to adult men. The probability of SD increased sharply at low incomes. These findings were consistent across pathogens.
Conclusions/significance: There remain underappreciated populations vulnerable to life-threatening diarrheal disease that include adult women and the very poor. In addition to efforts that address diarrheal disease in young children, there is a need to develop interventions for these other high-risk populations that are accessible within 4 hours of symptom onset.
Conflict of interest statement
The authors have declared that no competing interests exist.
Figures

References
-
- Farmer P, Almazor CP, Bahnsen ET, Barry D, Bazile J, Bloom BR, et al. Meeting cholera's challenge to Haiti and the world: a joint statement on cholera prevention and care. PLoS Negl Trop Dis. 2011;5(5):e1145 doi: 10.1371/journal.pntd.0001145 - DOI - PMC - PubMed
-
- Liu L, Johnson HL, Cousens S, Perin J, Scott S, Lawn JE, et al. Global, regional, and national causes of child mortality: an updated systematic analysis for 2010 with time trends since 2000. Lancet. 2012;379(9832):2151–61. doi: 10.1016/S0140-6736(12)60560-1 - DOI - PubMed
-
- Lozano R, Naghavi M, Foreman K, Lim S, Shibuya K, Aboyans V, et al. Global and regional mortality from 235 causes of death for 20 age groups in 1990 and 2010: a systematic analysis for the Global Burden of Disease Study 2010. Lancet. 2012;380(9859):2095–128. Epub 2012/12/19. doi: 10.1016/S0140-6736(12)61728-0 - DOI - PMC - PubMed
-
- GBD 2015 DALYs and HALE Collaborators. Global, regional, and national disability-adjusted life-years (DALYs) for 315 diseases and injuries and healthy life expectancy (HALE), 1990–2015: a systematic analysis for the Global Burden of Disease Study 2015. Lancet. 2016;388(10053):1603–58. doi: 10.1016/S0140-6736(16)31460-X - DOI - PMC - PubMed
-
- GBD 2015 Mortality and Causes of Death Collaborators. Global, regional, and national life expectancy, all-cause mortality, and cause-specific mortality for 249 causes of death, 1980–2015: a systematic analysis for the Global Burden of Disease Study 2015. Lancet. 2016;388(10053):1459–544. doi: 10.1016/S0140-6736(16)31012-1 - DOI - PMC - PubMed
Publication types
MeSH terms
Grants and funding
LinkOut - more resources
Full Text Sources
Other Literature Sources
Medical
Molecular Biology Databases
