. 2017 Apr 27;12(4):e0175300.
doi: 10.1371/journal.pone.0175300. eCollection 2017.

Integrin β1 activation induces an anti-melanoma host response

Affiliations

Integrin β1 activation induces an anti-melanoma host response

Laila Ritsma et al. PLoS One. .

Abstract

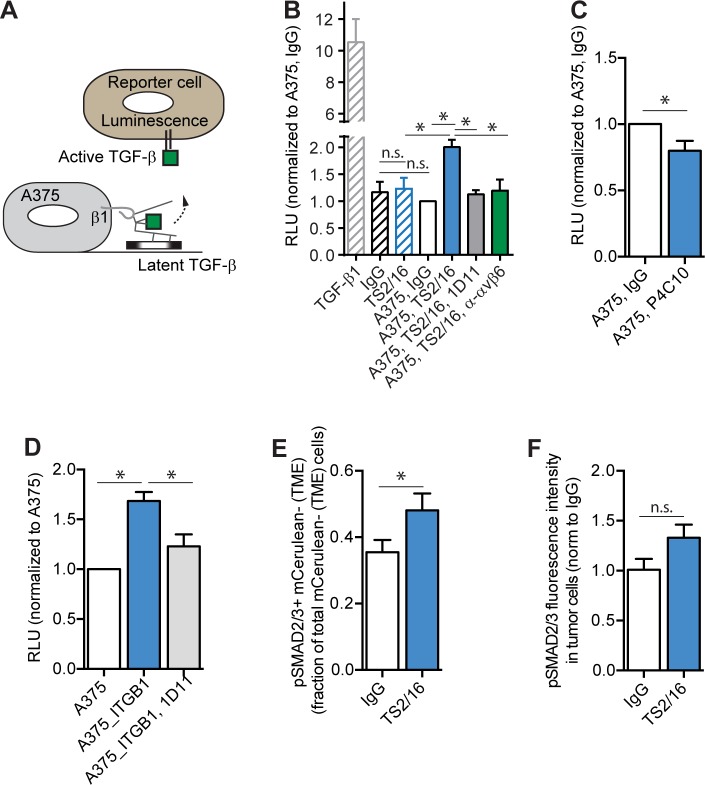
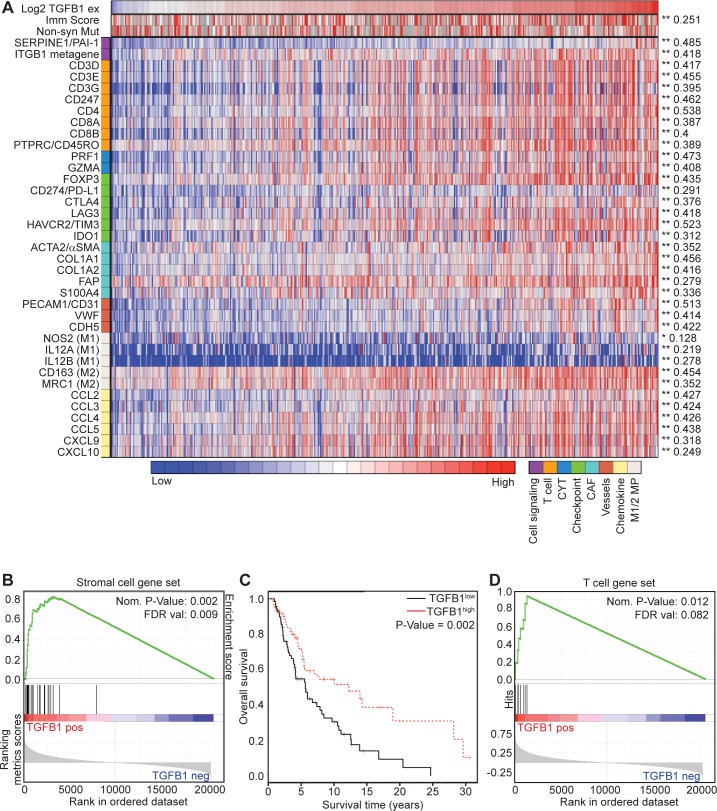
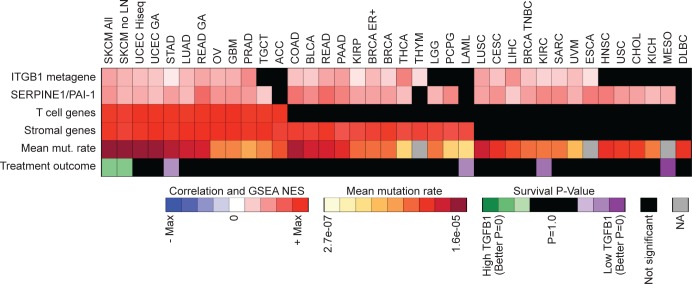
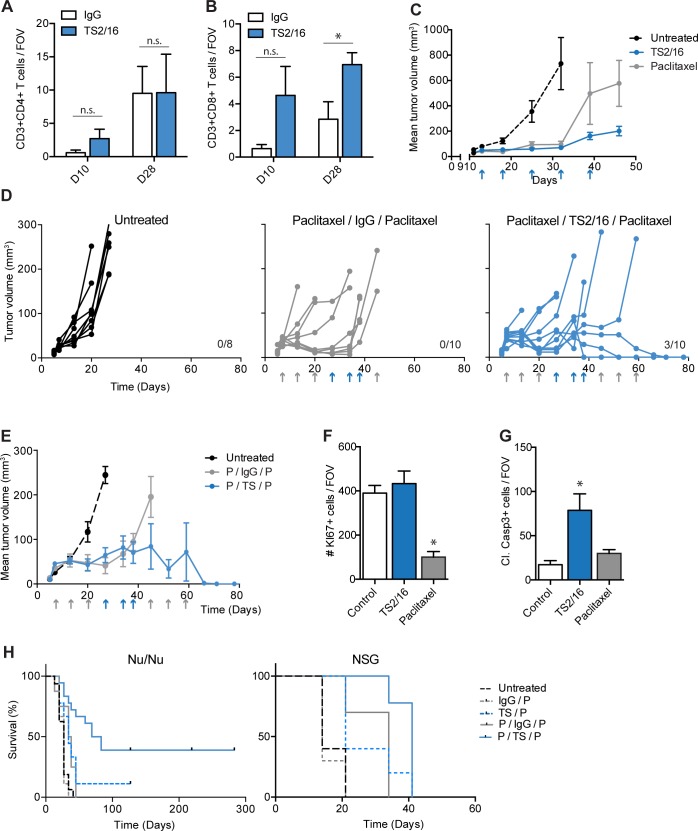
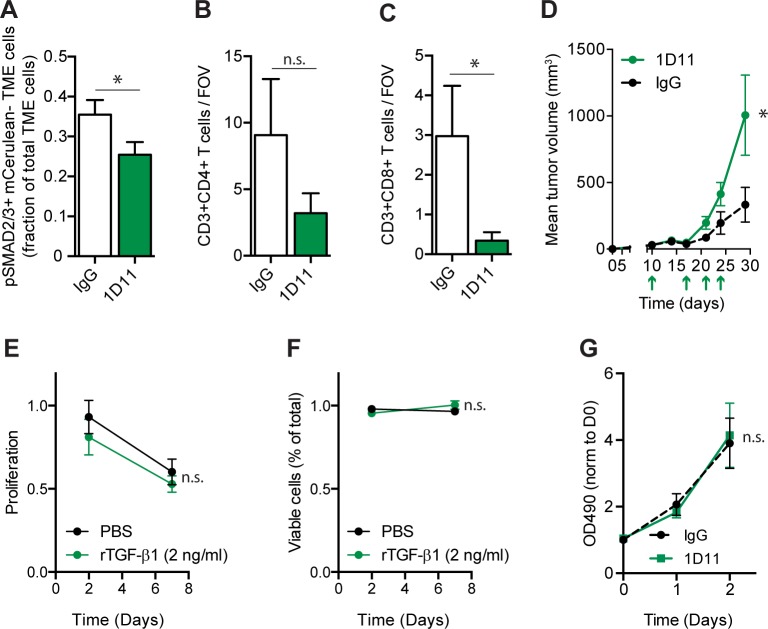
TGF-β is a cytokine thought to function as a tumor promoter in advanced malignancies. In this setting, TGF-β increases cancer cell proliferation, survival, and migration, and orchestrates complex, pro-tumorigenic changes in the tumor microenvironment. Here, we find that in melanoma, integrin β1-mediated TGF-β activation may also produce tumor suppression via an altered host response. In the A375 human melanoma cell nu/nu xenograft model, we demonstrate that cell surface integrin β1-activation increases TGF-β activity, resulting in stromal activation, neo-angiogenesis and, unexpectedly for this nude mouse model, increase in the number of intra-tumoral CD8+ T lymphocytes within the tumor microenvironment. This is associated with attenuation of tumor growth and long-term survival benefit. Correspondingly, in human melanomas, TGF-β1 correlates with integrin β1/TGF-β1 activation and the expression of markers for vasculature and stromal activation. Surprisingly, this integrin β1/TGF-β1 transcriptional footprint also correlates with the expression of markers for tumor-infiltrating lymphocytes, multiple immune checkpoints and regulatory pathways, and, importantly, better long-term survival of patients. These correlations are unique to melanoma, in that we do not observe similar associations between β1 integrin/TGF-β1 activation and better long-term survival in other human tumor types. These results suggest that activation of TGF-β1 in melanoma may be associated with the generation of an anti-tumor host response that warrants further study.


Conflict of interest statement

Competing Interests: The authors have declared that no competing interests exist.

Figures

Fig 1
Fig 1. Activated integrin β1 mediates the conversion of latent-to-active TGF-β.
(A) TGF-β co-culture assay cartoon explaining how TGF-β activity is measured in experiment B to D. A375 cells plated on latent-TGF-β-rich matrix are in co-culture with tMLEC reporter cells that report active TGF-β with luminescence. Integrin β1 can bind to the latent-TGF-β complex and activate TGF-β. (B—C) TGF-β co-culture assays. Quantification of the relative luciferase units (RLU—measure for active TGF-β) of tMLEC only cultures (striped bars) or tMLEC/A375 co-cultures (open bars) treated with indicated treatments for 3 days ((IgG) control antibody, TS2/16 (antibody that activates integrin β1), 1D11 (TGF-β neutralizing antibody), P4C10 (integrin β1 inhibitory antibody), α-αvβ6 (integrin αvβ6 inhibitory antibody). Graphs are normalized to A375, IgG. N ≥ 3 experiments, performed in triplicate. (D) TGF-β co-culture assay. Quantification of the RLU of tMLEC/A375 (white bar), tMLEC/A375-EmGFP-ITGB1 (blue bar), or tMLEC/A375-EmGFP-ITGB1 treated with 1D11 (grey bar) co-cultures. Graph is normalized to A375. N ≥ 3 experiments, performed in triplicate. (E) TGF-β signaling in the TME. IHC quantification on A375 NLS-mCerulean tumors treated with IgG control or TS2/16 antibody for 3 weeks. Per field of view, cells negative for mCerulean (TME cells) but with nuclear pSMAD2/3 were counted and plotted as a fraction of total mCeruleannegative (TME) cells. N ≥ 3 tumors per condition, 10 FOV per tumor. (F) TGF-β signaling in A375 cells. IHC quantification on A375 NLS-mCerulean tumors treated with IgG control or TS2/16 antibody for 2 days. Per field of view, pSMAD2/3 fluorescent intensity levels in mCerulean positive cells (tumor cells) was calculated. The graph is normalized to IgG control. N = 5 tumors per condition. Error bars, SEM; ANOVA (B and D) or double-sided unpaired T-Test (C, E, F): * P-value ≤ 0.05, ** P-value ≤ 0.01, n.s. P-value ≥ 0.05.
Fig 2
Fig 2. TGFB1 is positively correlated with overall survival and the TS2/16 gene signature in melanoma.
(A) Heatmap showing TCGA human skin cutaneous melanoma (SKCM) patient sample Pearson correlations for TGFB1 RNA-seq expression levels and tumor microenvironmental genes. Active TGF-β signaling (SERPINE1), a metagene for integrin β1 activity (ITGB1 metagene), the immune score (imm score) and Non-Synonymous Mutation rate (non-syn Mut) are included as well. (B) Gene set enrichment analysis (GSEA) for the stromal gene signature on TCGA SKCM patient samples with genes ranked based on Pearson correlation with TGFB1 expression level. (C) Kaplan-Meier curve displaying overall survival (OS) for TCGA SKCM skin/distant melanoma patients who were subdivided into a TGFB1high and a TGFB1low group. TGFB1high > median (N = 63), TGFB1low < median (N = 70). (D) GSEA analyses for T cell gene signature on TCGA SKCM patient samples with genes ranked based on Pearson correlation with TGFB1 expression level.
Fig 3
Fig 3. TGFB1 correlations for various tumor types.
Heatmap displaying correlations between TGFB1 expression and active ITGB1 (ITGB1 metagene) and TGF-β activity (SERPINE1/PAI1) for various tumor types (S4 Table). The heatmap also includes rows with mean mutation rates (mean mut. rate), TGFB1 Kaplan-Meier treatment outcome log-rank p-values (Treatment outcome), and GSEA Normalized Enrichment Score (NES) for T-cell (T cell genes) and stromal (Stromal genes) gene sets for each of the tumor types.
Fig 4
Fig 4. TS2/16 attenuates tumor growth by indirectly increasing apoptosis.
(A-B) IHC quantification on A375 NLS-mCerulean tumors treated with IgG control (white bars) or TS2/16 (blue bars) antibody. The number of (A) CD3+CD4+, (B) CD3+CD8+ T cells was counted per field of view (FOV), and the average of ≥5 FOV in ≥3 tumors per condition was plotted in bar graphs. D10: tumors were treated once and were harvested 10 days after injection (2 days after treatment). D28: Tumors were treated 3x and were harvested 28 days after injection (5 days after last treatment). (C) Mean tumor volume of A375 tumors in nu/nu mice left untreated (dashed line), treated with TS2/16 (blue line) or Paclitaxel (grey line). Treatments are indicated with an arrow. N ≥ 5 mice per group. (D) A375 tumor growth measurements in nu/nu mice. Each curve represents the growth of a single tumor. Treatments are indicated with an arrow: TS2/16 or IgG (blue), paclitaxel (grey). Mice were sacrificed when tumors reached > 130 mm3, cured mice are indicated by the number on the right. N ≥ 8 tumors per group. (E) Mean tumor volume of A375 tumors shown in D. Mice were left untreated (dashed line), treated with paclitaxel/IgG/Paclitaxel (grey line) or treated with paclitaxel/TS2/16/paclitaxel (blue line). Treatments are indicated with an arrow: TS2/16 or IgG (blue), paclitaxel (grey). Mice were sacrificed when tumors reached > 130 mm3. N ≥ 8 mice per group. (F-G) IHC quantification on A375 NLS-mCerulean tumors treated with IgG control (white bars) or TS2/16 (blue bars) antibody for 5 weeks. The number of KI67+ cells (proliferation, F) or Cl. Casp3+ cells (apoptosis,G) per FOV was measured. N ≥ 10 FOV per condition. (H) Kaplan Meier survival curves of nu/nu and NSG mice respectively injected with A375 tumor cells and treated with indicated treatment regimen: IgG (IgG control antibody), P (paclitaxel), TS (TS2/16). Mice were sacrificed when tumors reached >130 mm3. N ≥ 10 mice per group. Survival analyses with Bonferroni post-hoc: in both nu/nu and NSG mice IgG/P vs TS/P and P/IgG/P vs P/TS/P was significant (P-value≤ 0.05). Error bars, SEM; Two-sided unpaired T-tests (A—B) or 1-way ANOVA with Bonferroni post-hoc test comparing treatments to control (F—G): * P-value ≤ 0.05, n.s. P-value > 0.05.
Fig 5
Fig 5. Neutralization of TGF-β reduces tumor infiltrating lymphocytes and A375 tumor growth.
(A) TGF-β signaling in the TME. IHC quantification on A375 NLS-mCerulean tumors treated with IgG control (white bars) or 1D11 (green bars) antibody for 3 weeks. Per field of view, cells negative for mCerulean (TME cells) but with nuclear pSMAD2/3 were counted and plotted as a fraction of total mCeruleannegative (TME) cells. N ≥ 4 animals per condition. (B-C) IHC quantification on A375 NLS-mCerulean tumors treated with IgG control (white bars) or 1D11 (green bars) antibody. The number of (B) CD3+CD4+, (C) CD3+CD8+ T cells was counted per field of view (FOV), and the average of ≥4 FOV in ≥4 tumors per condition was plotted in the bar graphs. (D) Mean tumor volume of A375 NLS-mCerulean tumors in nu/nu mice treated with IgG control antibody (dashed black line) or treated with 1D11 (solid green line). Treatments are indicated with an arrow. N ≥ 6 mice per group. (E) In vitro proliferation assay. A375 cells were treated with PBS or rTGF-β1 for 2 or 7 days. Proliferation was measured by calculating green fluorescent (living) cells and comparing it to a live control. N = 3 experiments performed in triplicate. (F) In vitro cell viability assay. A375 cells were treated with PBS or rTGF-β1 for 2 or 7 days. Viability was measured by calculating the red fluorescent (dead) cells and comparing it to a dead control. N = 3 experiments performed in triplicate. G) In vitro proliferation assay. A375 cells were treated with IgG control antibody or 1D11 antibody for 0, 1 or 2 days. After addition of cell titel 96 aquaous solution proliferation was assessed by measuring optical density at 490 nm and normalizing it to day 0. N = 3 experiments performed in triplicate. Error bars, SEM; Double-sided unpaired T-Test (A to C) or repeated measures two-way ANOVA (D-G): * P-value ≤ 0.05, n.s. P-value > 0.05.

References

    1. Soengas MS, Lowe SW (2003) Apoptosis and melanoma chemoresistance. Oncogene 22: 3138–3151. doi: 10.1038/sj.onc.1206454 - DOI - PubMed
    1. Sosman JA, Kim KB, Schuchter L, Gonzalez R, Pavlick AC, et al. (2012) Survival in BRAF V600-mutant advanced melanoma treated with vemurafenib. N Engl J Med 366: 707–714. doi: 10.1056/NEJMoa1112302 - DOI - PMC - PubMed
    1. Puzanov I, Amaravadi RK, McArthur GA, Flaherty KT, Chapman PB, et al. (2015) Long-term outcome in BRAF(V600E) melanoma patients treated with vemurafenib: Patterns of disease progression and clinical management of limited progression. Eur J Cancer 51: 1435–1443. doi: 10.1016/j.ejca.2015.04.010 - DOI - PMC - PubMed
    1. Shi H, Hugo W, Kong X, Hong A, Koya RC, et al. (2014) Acquired resistance and clonal evolution in melanoma during BRAF inhibitor therapy. Cancer Discov 4: 80–93. doi: 10.1158/2159-8290.CD-13-0642 - DOI - PMC - PubMed
    1. Van Allen EM, Wagle N, Sucker A, Treacy DJ, Johannessen CM, et al. (2014) The genetic landscape of clinical resistance to RAF inhibition in metastatic melanoma. Cancer Discov 4: 94–109. doi: 10.1158/2159-8290.CD-13-0617 - DOI - PMC - PubMed

MeSH terms