

Detecting the impact of temperature on transmission of Zika, dengue, and chikungunya using mechanistic models
- PMID: 28448507
- PMCID: PMC5423694
- DOI: 10.1371/journal.pntd.0005568
Detecting the impact of temperature on transmission of Zika, dengue, and chikungunya using mechanistic models
Erratum in
-
Correction: Detecting the impact of temperature on transmission of Zika, dengue, and chikungunya using mechanistic models.PLoS Negl Trop Dis. 2022 Jun 2;16(6):e0010514. doi: 10.1371/journal.pntd.0010514. eCollection 2022 Jun. PLoS Negl Trop Dis. 2022. PMID: 35653363 Free PMC article.
Abstract
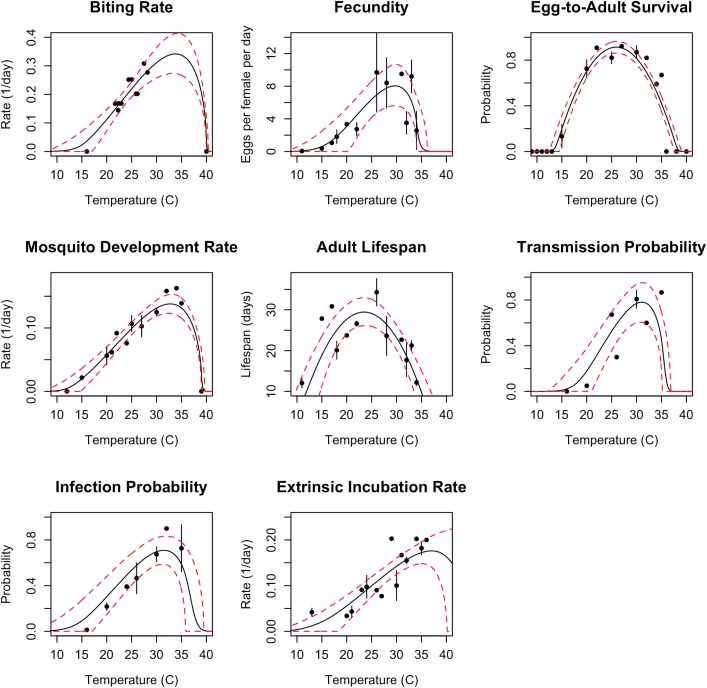
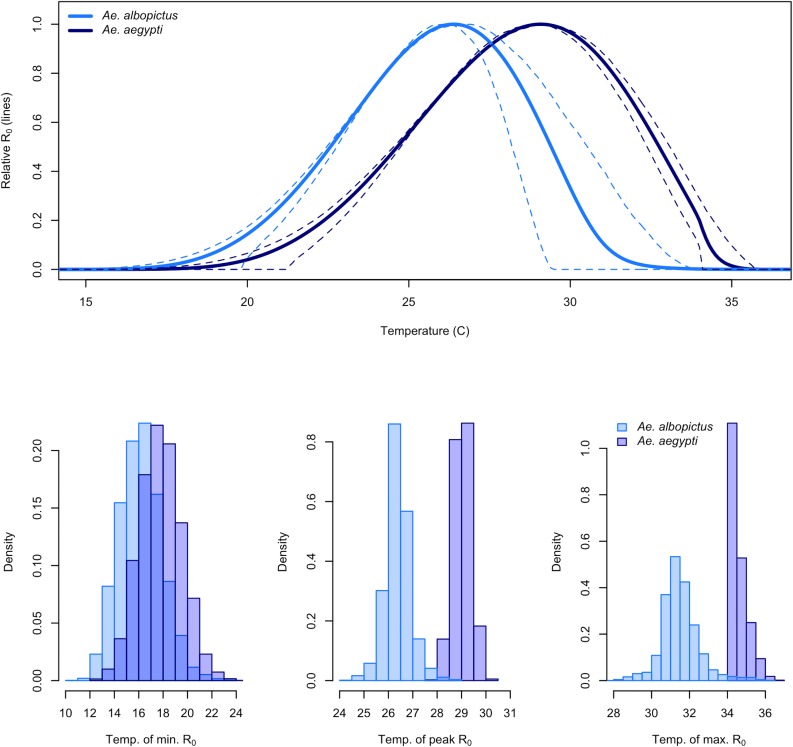
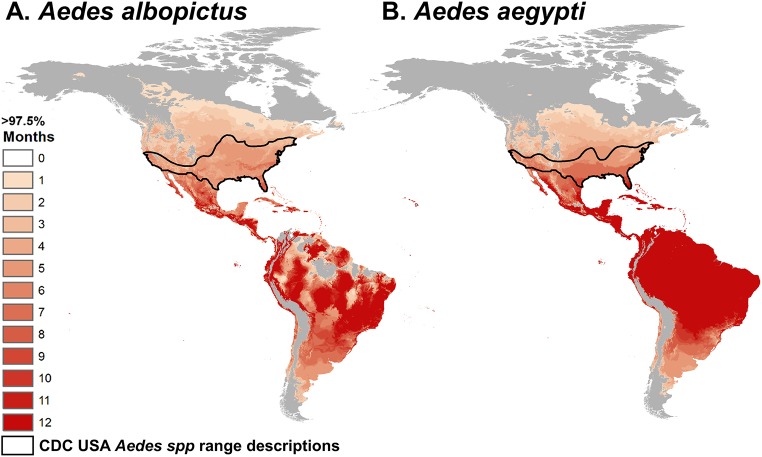
Recent epidemics of Zika, dengue, and chikungunya have heightened the need to understand the seasonal and geographic range of transmission by Aedes aegypti and Ae. albopictus mosquitoes. We use mechanistic transmission models to derive predictions for how the probability and magnitude of transmission for Zika, chikungunya, and dengue change with mean temperature, and we show that these predictions are well matched by human case data. Across all three viruses, models and human case data both show that transmission occurs between 18-34°C with maximal transmission occurring in a range from 26-29°C. Controlling for population size and two socioeconomic factors, temperature-dependent transmission based on our mechanistic model is an important predictor of human transmission occurrence and incidence. Risk maps indicate that tropical and subtropical regions are suitable for extended seasonal or year-round transmission, but transmission in temperate areas is limited to at most three months per year even if vectors are present. Such brief transmission windows limit the likelihood of major epidemics following disease introduction in temperate zones.
Conflict of interest statement
The authors have declared that no competing interests exist.
Figures

References
-
- Brady OJ, Gething PW, Bhatt S, Messina JP, Brownstein JS, Hoen AG, et al. Refining the global spatial limits of dengue virus transmission by evidence-based consensus. PLOS Negl Trop Dis. 2012;6: e1760 doi: 10.1371/journal.pntd.0001760 - DOI - PMC - PubMed
-
- Bhatt S, Gething PW, Brady OJ, Messina JP, Farlow AW, Moyes CL, et al. The global distribution and burden of dengue. Nature. 2013;496: 504–507. doi: 10.1038/nature12060 - DOI - PMC - PubMed
-
- Rasmussen SA, Jamieson DJ, Honein MA, Petersen LR. Zika virus and birth defects—reviewing the evidence for causality. N Engl J Med. 2016;374: 1981–1987. doi: 10.1056/NEJMsr1604338 - DOI - PubMed
-
- Scott TW, Takken W. Feeding strategies of anthropophilic mosquitoes result in increased risk of pathogen transmission. Trends Parasitol. 2012;28: 114–121. doi: 10.1016/j.pt.2012.01.001 - DOI - PubMed
-
- Messina JP, Kraemer MU, Brady OJ, Pigott DM, Shearer FM, Weiss DJ, et al. Mapping global environmental suitability for Zika virus. eLife. 2016;5: e15272 doi: 10.7554/eLife.15272 - DOI - PMC - PubMed
Publication types
MeSH terms
Associated data
Grants and funding
LinkOut - more resources
Full Text Sources
Other Literature Sources
Medical
