. 2017 Apr 27;12(4):e0176050.
doi: 10.1371/journal.pone.0176050. eCollection 2017.

Suppression of the Escherichia coli dnaA46 mutation by changes in the activities of the pyruvate-acetate node links DNA replication regulation to central carbon metabolism

Affiliations

Suppression of the Escherichia coli dnaA46 mutation by changes in the activities of the pyruvate-acetate node links DNA replication regulation to central carbon metabolism

Joanna Tymecka-Mulik et al. PLoS One. .

Abstract

To ensure faithful transmission of genetic material to progeny cells, DNA replication is tightly regulated, mainly at the initiation step. Escherichia coli cells regulate the frequency of initiation according to growth conditions. Results of the classical, as well as the latest studies, suggest that the DNA replication in E. coli starts at a predefined, constant cell volume per chromosome but the mechanisms coordinating DNA replication with cell growth are still not fully understood. Results of recent investigations have revealed a role of metabolic pathway proteins in the control of cell division and a direct link between metabolism and DNA replication has also been suggested both in Bacillus subtilis and E. coli cells. In this work we show that defects in the acetate overflow pathway suppress the temperature-sensitivity of a defective replication initiator-DnaA under acetogenic growth conditions. Transcriptomic and metabolic analyses imply that this suppression is correlated with pyruvate accumulation, resulting from alterations in the pyruvate dehydrogenase (PDH) activity. Consequently, deletion of genes encoding the pyruvate dehydrogenase subunits likewise resulted in suppression of the thermal-sensitive growth of the dnaA46 strain. We propose that the suppressor effect may be directly related to the PDH complex activity, providing a link between an enzyme of the central carbon metabolism and DNA replication.


Conflict of interest statement

Competing Interests: The authors have declared that no competing interests exist.

Figures

Fig 1
Fig 1. Mechanisms controlling DnaA abundance and activity in the E. coli cells.
Left panel shows the factors stimulating ATP hydrolysis by DnaA or rejuvenation of DnaA-ATP. The dnaA gene and its promoter (gray triangle) are depicted. Right panel summarizes the mechanisms stimulating or blocking complex formation by DnaA-ATP at oriC. Stimulating interactions are marked by red arrows, inhibiting–by blue bars, ± sign depicts dual function of the DnaA-ATP protein as both, the repressor and activator of transcription. The oriC region contains three DnaA binding sequences of high affinity (green triangles), two arrays of low-affinity sites recognized by DnaA-ATP exclusively (blue triangles) and a DNA unwinding element (DUE) where duplex melting occurs. The middle circle reflects positions of the chromosomal regions involved in the regulation of DnaA activity (datA and two DARS) on the E. coli genome map and their relative distance to oriC and the dif chromosome dimer resolution locus, where chromosome copies become decatenated.
Fig 2
Fig 2. Suppression of dnaA46 thermal sensitivity by mutations in the pta-ackA pathway depends on the carbon source.
Bacteria were grown on plates containing the indicated carbon sources (as described in Materials and methods) at 30 and 39°C and growth was estimated in CFU. Data represents mean ± SEM of three independent experiments.
Fig 3
Fig 3. The effect of suppression of dnaA46 replication defect by mutations in the acetate overflow pathway can be modulated by manipulating NADH/NAD+ ratio.
Bacteria were grown on LB plates containing 100 mM sodium formate and 1 mM IPTG (where indicated). Growth was estimated in CFU. Data represents mean ± SEM of three independent experiments.
Fig 4
Fig 4. Alterations of CCM genes’ expression in the single and double metabolic mutants.
Blue arrows indicate upregulation of transcription of the respective genes. Only the genes that were consistently upregulated at least 2-fold in all of the four strains bearing metabolic mutations (ackA, pta, dnaA46ackA and dnaA46pta) were marked by solid blue arrows. The arrows represent gene function and not reactions, therefore two arrows are present for the functions encoded by two separate genes which may be differentially regulated. The expression of glyoxylate bypass genes was increased more than 2-fold in both ackA strains, but not the pta mutants, although it was still enhanced in the latter strains in comparison to the wt (as marked by blue dotted lines). Relative change of RNA abundance is shown as fold change (values in brackets) for significantly upregulated genes. Consecutive numbers stand for the fold change in the ackA, pta, dnaA46ackA and dnaA46pta strain, respectively. All of the TCA cycle genes were upregulated by more than 2 fold in all four strains, the change of expression of sucAB and sucCD was most pronounced and the range of fold-change in all strains was indicated in brackets. Abbreviations: G6P –glucose 6-phosphate, F6P –fructose 6-phospate, FBP- fructose 1,6-bisphosphate, G3P –glyceraldehyde 3-phosphate, PEP–phosphoenolpyruvate, PYR- pyruvate, AcCoA–acetyl-CoA, ICT–isocitrate, SUC–succinate, OAA–oxaloacetate, GOX–glyoxylate. pstHI, crr, ptsG–PTS glucose transport system, glk—glucokinase, pgi–phosphoglucose isomerase, pfkA and pfkB– 6-phosphofructokinase, fbp–fructose-1,6-bisphosphatase, fbaB–fructose bisphosphate aldolase, tpiA–triosephosphate isomerase, gapA–glyceraldehyde 3-phosphate dehydrogenase, pgk–phosphoglycerate kinase, gpmA and gpmB–phosphoglycerate mutase, eno—enolase, pykA and pykF–pyruvate kinase, ppsA–phosphoenolopyruvate synthetase, pckA–phosphoenolopyruvate carboxykinase, ppc—phosphoenolopyruvate carboxylase, poxB–pyruvate oxidase, aceEF–pyruvate dehydrogenase, acs–acetyl-CoA synthetase, sfcA and maeB–malate dehydrogenase, gltA–citrate synthase, acnA and acnB–aconitate hydratase, icdA–isocitrate dehydrogenase, sucAB– 2-oxoglutarate dehydrogenase, sucCD–succinyl-CoA synthetase, sdhCDAB–succinate dehydrogenase, fumA—fumarase, mdh–malate dehydrogenase, aceA–isocitrate lyase, glcB and aceB–malate synthase. The scheme was adapted from reference 50.
Fig 5
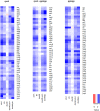
Fig 5. Expression of genes regulated by rpoS and ppGpp in the overflow pathway mutants.
Gene expression was estimated in the exponential phase by RNA-seq. Heat map contains the genes whose expression in the metabolic mutants was changed by at least 2-fold with p-value < 0.05. RpoS and ppGpp-regulated genes were chosen based on results of whole transcriptome studies of an isoleucine limitation response [52].
Fig 6
Fig 6. Intracellular accumulation of metabolites in the acetate overflow pathway mutants.
A) pyruvate, B) 2-oxoglutarate. Concentration of metabolites was measured as described in Materials and Methods. Data represents mean ± SEM of two independent experiments. The values present metabolites’ concentration in the cellular extracts prepared from an equal bacterial mass but not their concentration in the bacterial cell volume.
Fig 7
Fig 7. The influence of rpoS (A), relA (B) and gadX (C) on the suppression of the dnaA46 temperature-sensitive growth by mutations in the acetate overflow pathway or lpd genes.
Bacteria were grown at 30°C in LB medium to early exponential phase, subsequently serial dilutions were prepared and plated on LB plates at 30 and 39°C. Growth was estimated by CFU. Data represents mean ± SEM of three independent experiments.
Fig 8
Fig 8. Intracellular accumulation of acetate in the pta and ackA mutants.
Concentration of metabolites was measured as described in Materials and Methods. Data represents mean ± SEM of two independent experiments.
Fig 9
Fig 9. Sensitivity to gyrase inhibitors of the dnaA46 strain lacking a part of acetate overflow pathway (AB) or growing in the presence of 0.5 M NaCl (CD).
Indicated concentrations of nalidixic acid (AC) or novobiocin (BD) were used. Bacteria were grown on LB plates at 30 and 39°C and growth was estimated by CFU. Data represents mean ± SEM of three independent experiments.

Similar articles

Cited by

References

    1. Cooper S, Helmstetter CE. Chromosome replication and the division cycle of Escherichia coli B/r. J Mol Biol. 1968; 31: 519–40 - PubMed
    1. Donachie WD. Relationship between cell size and time of initiation of DNA replication. Nature. 1968; 219: 1077–9 - PubMed
    1. Wallden M, Fange D, Lundius EG, Baltekin Ö, Elf J. The synchronization of replication and division cycles in individual E. coli cells. Cell. 2016; 166: 729–39 10.1016/j.cell.2016.06.052 - DOI - PubMed
    1. Leonard AC, Grimwade JE. The orisome: structure and function. Front Microbiol. 2015; 6: 545 10.3389/fmicb.2015.00545 - DOI - PMC - PubMed
    1. Zheng H, Ho PY, Jiang M, Tang B, Liu W, Li D, et al. Interrogating the Escherichia coli cell cycle by cell dimension perturbations. Proc Natl Acad Sci U S A. 2016; 113:15000–15005. 10.1073/pnas.1617932114 - DOI - PMC - PubMed

MeSH terms

LinkOut - more resources