. 2017 Apr 27;13(4):e1006345.
doi: 10.1371/journal.ppat.1006345. eCollection 2017 Apr.

IL-33/ST2 pathway drives regulatory T cell dependent suppression of liver damage upon cytomegalovirus infection

Affiliations

IL-33/ST2 pathway drives regulatory T cell dependent suppression of liver damage upon cytomegalovirus infection

Branka Popovic et al. PLoS Pathog. .

Abstract

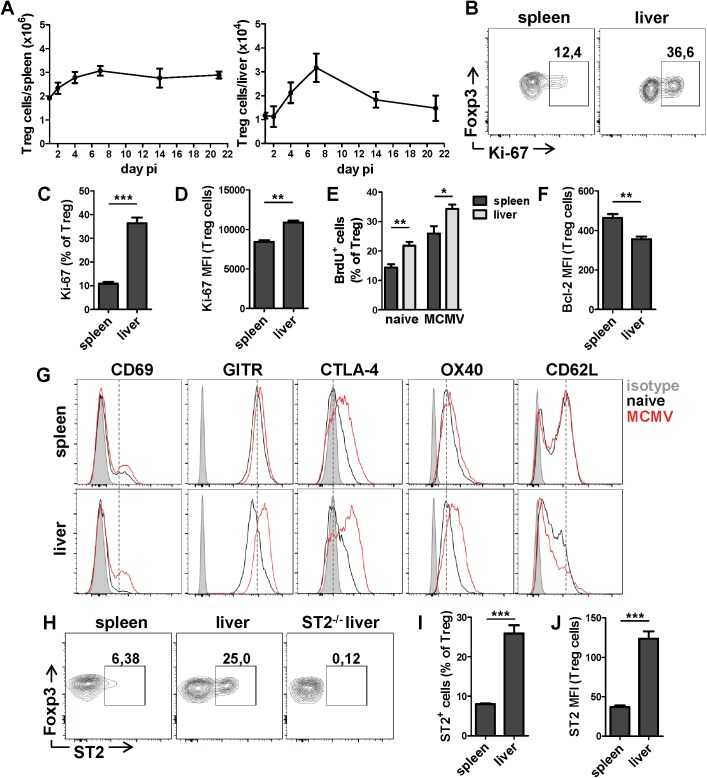
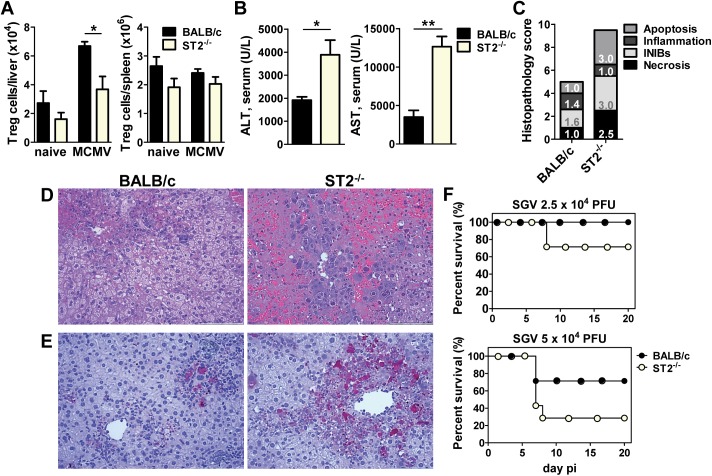
Regulatory T (Treg) cells dampen an exaggerated immune response to viral infections in order to avoid immunopathology. Cytomegaloviruses (CMVs) are herpesviruses usually causing asymptomatic infection in immunocompetent hosts and induce strong cellular immunity which provides protection against CMV disease. It remains unclear how these persistent viruses manage to avoid induction of immunopathology not only during the acute infection but also during life-long persistence and virus reactivation. This may be due to numerous viral immunoevasion strategies used to specifically modulate immune responses but also induction of Treg cells by CMV infection. Here we demonstrate that liver Treg cells are strongly induced in mice infected with murine CMV (MCMV). The depletion of Treg cells results in severe hepatitis and liver damage without alterations in the virus load. Moreover, liver Treg cells show a high expression of ST2, a cellular receptor for tissue alarmin IL-33, which is strongly upregulated in the liver of infected mice. We demonstrated that IL-33 signaling is crucial for Treg cell accumulation after MCMV infection and ST2-deficient mice show a more pronounced liver pathology and higher mortality compared to infected control mice. These results illustrate the importance of IL-33 in the suppressive function of liver Treg cells during CMV infection.


Conflict of interest statement

The authors declare that they have no competing interests.

Figures

Fig 1
Fig 1. Treg cells show an activated phenotype after MCMV infection.
BALB/c mice were i.v. injected with 2x10⁵ PFU of WT MCMV (clone MW97.01) or left uninfected. (A) Absolute number of Treg cells in spleen and liver is shown. (B) Representative FACS plots and (C) graphs showing percentages and (D) median fluorescence intensity (MFI) of Ki-67 expression by naive Treg cells. (F) Bcl-2 expression by naive Treg cells. (E) Mice were treated with BrdU in drinking water for 6 days starting at the day of infection. Percentage of BrdU positive Treg cells on day 7 was determined. (G) Histograms show a representative expression of different markers by Treg cells from uninfected and 7 days infected mice. (H) Representative FACS plots and (I) graphs showing percentages and (J) median fluorescence intensity (MFI) of ST2 expression by Treg cells isolated from the spleen and liver of naive BALB/c and ST2-/- mice. Data are shown as mean ± SEM of n = 3–5 mice from one representative experiment out of three. *p<0.05; ** p<0.01; ***p<0.001 from two tailed, unpaired Student’s t-test.
Fig 2
Fig 2. Depletion of Treg cells results in severe liver damage upon MCMV infection.
(A-D) BALB/c DEREG mice were i.v. injected with 106 WT MCMV (pSM3fr-MCK-2fl clone 3.3) and treated i.p. with DT on day 0 and 1 or left untreated. Mice were analyzed on day 5 p.i. (A) AST and ALT levels were determined in the serum (B) Changes in the body weight were monitored daily and plotted as percent of weight at the date of infection. (C) Scores of cumulative liver pathology for apoptosis, intranuclear inclusion bodies (INIBs), inflammation, and necrosis. Bars correspond to the mean score for each parameter. The height of each bar represents the mean of the total histological score (out of 12). (D) Representative H&E staining of paraffin embedded liver sections. Arrows highlight necrotic areas, and asterisks indicate hepatocytes with large nuclear inclusions. (E-G) BALB/c mice were i.p. injected with anti-TGFβ antibody 3 hours prior to i.v. infection with 106 WT MCMV (pSM3fr-MCK-2fl clone 3.3) and analyzed on day 5 p.i. (E) Histology score and (F) representative H&E staining of liver sections. (G) AST and ALT levels in the serum. Data are shown as mean ± SEM of n = 3–5 mice from one representative experiment out of three. *p<0.05 from one-way ANOVA with Bonferroni correction and two tailed, unpaired Student’s t-test.
Fig 3
Fig 3. Depletion of Treg cells results in enhanced virus-specific CD8+ T cell response.
BALB/c DEREG mice were i.v. injected with 106 WT MCMV (pSM3fr-MCK-2fl clone 3.3) and treated i.p. with DT on day 0 and 1 or left untreated. Mice were analyzed on day 5 p.i. (A) Lymphocytes from spleen and liver were re-stimulated with IE1 or m164 peptides and frequency of CD8+ T cells expressing IFNγ, granzyme B, or both (double positive, DP), was determined. Data are shown as mean ± SEM of n = 3 mice from one representative experiment. *p<0.05; ** p < 0.01 from two tailed, unpaired Student’s t-test. (B) Viral titers in the spleen and liver were determined by the plaque assay. A circle depicts the titer for each individual mouse; a small horizontal line indicates the median. n = 5 (C) BALB/c SCID mice were i.v. injected with 106 WT MCMV (pSM3fr-MCK-2fl clone 3.3) and at the same day of infection received 1x10⁷ splenocytes from naive BALB/c mice (anti-CD25 treated) alone or together with 1x10⁶ Treg cells. AST and ALT levels were determined in the serum on day 5 p.i. Data are shown as mean ± SEM of n = 5 mice from one representative experiment. *p<0.05 from one-way ANOVA with Bonferroni correction.
Fig 4
Fig 4. IL-33 expression is increased during MCMV infection.
BALB/c mice were injected i.v. with 2x10⁵ PFU of WT MCMV (MW97.01) and liver tissue was harvested on indicated time points. (A) Kinetic analysis of IL-33 mRNA expression, relative to GAPDH mRNA, performed by real-time PCR. (B) Representative IL-33 (black) and MCMV IE1 (red) co-staining of paraffin embedded liver sections on day 5 p.i.
Fig 5
Fig 5. Identification of the cell type that expresses IL-33 in inflammatory foci in infected liver tissue as F4/80+ macrophages.
BALB/c mice were injected i.v. with 5x10⁵ PFU of WT MCMV (MW97.01) and liver tissue was harvested on day 5 p.i. (A) Consecutive serial 1-μm sections of liver tissue focusing on an infected hepatocyte (Hc) that is delimited from uninfected tissue by a sheath made up by a mononuclear cell infiltrate. The expression of the indicated marker molecules was tested in a two-color IHC (2C-IHC) staining. (a-d) Identification of the infected Hc by red staining of the intranuclear viral IE1 protein. (a) Focus-forming mononuclear cells are not CD31+ black-stained endothelial cells (EC). (b) Focus-forming mononuclear cells are not CD3ε+ black-stained cells, thus excluding α/ß and γ/δ T cells as well as NKT cells. (c) Identification of focus-forming mononuclear cells as black-stained F4/80+ macrophages (Mø). (d) IL33-expressing cells stained in turquoise-green color colocalize with focus-forming F4/80 macrophages in the neighboring section of image c. Counterstaining with hematoxylin. Arrows point to the indicated cell types exemplarily. The bar markers represent 50 μm throughout. (B) 2C-IHC verifying colocalization of F4/80 and IL33 on the cellular level. (a) Higher resolution image of an advanced, aged focus consisting of a cluster of dual-stained F4/80+ (red) IL33+ (turquoise-green) macrophages (Mø) surrounding an infected hepatocyte (Hc) that is identified by an intranuclear inclusion body. Note that dually-expressing macrophages localize also to liver tissue outside of a focus. (b) A young focus in which dual-stained F4/80+ (red) IL33+ (turquoise-green) macrophages cling to an infected hepatocyte (Hc) that shows the pathocytomorphology of an owl’s eye cell with an intranuclear inclusion body that indicates the late phase (L phase) in the viral gene expression program. Counterstaining with hematoxylin. Arrows point to sites of interest. The bar markers represent 50 μm.
Fig 6
Fig 6. ST2-/- mice show increased liver damage and mortality rate after MCMV infection.
(A) BALB/c and ST2-/- mice were i.v. injected with 2x10⁵ PFU of WT MCMV (MW97.01) and lymphocytes from spleen and liver were analyzed on day 7 p.i. Absolute number of Treg cells is shown. (B-E) BALB/c and ST2-/- mice were i.v. injected with 106 PFU of WT MCMV (pSM3fr-MCK-2fl clone 3.3) and analyzed on day 5 p.i. (B) AST and ALT serum levels were determined. (C) Scores of cumulative liver pathology for apoptosis, intranuclear inclusion bodies (INIBs), inflammation, and necrosis. Bars correspond to the mean score for each parameter. The height of each bar represents the mean of the total histological score (out of 12). (D) Representative H&E and (E) Caspase-3 staining of paraffin embedded liver sections. (F) BALB/c and ST2-/- mice were i.p. injected with indicated doses of SGV MCMV. Survival rates were monitored daily. Data are shown as mean ± SEM of n = 3–5 mice from one representative experiment out of three. For survival monitoring n = 7. *p <0.05 and **p<0.01 from two tailed, unpaired Student’s t-test.
Fig 7
Fig 7. ST2 deficiency does not affect viral control.
(A) WT and ST2-/- mice were injected i.v. with 2x10⁵ PFU of WT MCMV (MW97.01) and lymphocytes from the spleen and liver were isolated on day 4 p.i. The percentages of IE1-specific and m164-specific CD8+ T are shown. Data are shown as mean ± SEM. (B) WT and ST2-/- mice were injected i.v. with 106 PFU of WT MCMV (pSM3fr-MCK-2fl clone 3.3). Viral titers in indicated organs 5 days post infection were determined by the plaque assay. A circle depicts the titer for each individual mouse; a small horizontal line indicates the median. n = 4–5 mice from one representative experiment out of three. **p<0.01 from two tailed, unpaired Student’s t-test.
Fig 8
Fig 8. Intrinsic requirement for ST2 expression in Treg cells.
Mixed bone marrow chimeras were generated by irradiation of C57BL/6 CD45.1+CD45.2+ mice followed by i.v. injection of 1:1 mixture of wild-type (WT; CD45.1+) and knockout (ST2-/-; CD45.2+) bone marrow cells. After reconstitution, mixed chimeras were infected with 2x10⁵ PFU of Δm157 MCMV and analyzed on day 7 p.i. (A) Percentage of donor WT and KO Treg cells is shown. (B) The ratio between WT and KO Treg cells is shown. Dotted line represents initial ratio of transferred bone marrow cells. (C) Percentage of Ki-67 expression by donor Treg cells is shown. Data are shown as mean ± SEM of n = 4–5 mice per group from one representative experiment out of two. *p <0.05 and **p<0.01 from two tailed, unpaired Student’s t-test.
Fig 9
Fig 9. Administration of IL-33 induces liver Treg expansion.
BALB/c mice were i.v. injected with 2x10⁵ PFU of WT MCMV (MW97.01) and treated i.p. with recombinant IL-33 (or PBS) on day 0 and 2 and analyzed 5 days later. (A) Percentage of Treg cells was determined in the liver. Percentage of (B) Ki-67, (C) ST2 and (D) Helios by liver Treg cells. (E) Percentage of CD8+ T cells (among live lymphocytes) was determined in the spleen and liver. Data are shown as mean ± SEM of n = 5 mice from one representative experiment out of three. *p <0.05 and ***p<0.001 from two tailed, unpaired Student’s t-test.

References

    1. Josefowicz SZ, Lu LF, Rudensky AY. Regulatory T cells: mechanisms of differentiation and function. Annu Rev Immunol. 2012;30:531–64. doi: 10.1146/annurev.immunol.25.022106.141623 - DOI - PMC - PubMed
    1. Curotto de Lafaille MA, Lafaille JJ. Natural and adaptive foxp3+ regulatory T cells: more of the same or a division of labor? Immunity. 2009;30(5):626–35. doi: 10.1016/j.immuni.2009.05.002 - DOI - PubMed
    1. Cretney E, Kallies A, Nutt SL. Differentiation and function of Foxp3(+) effector regulatory T cells. Trends Immunol. 2013;34(2):74–80. doi: 10.1016/j.it.2012.11.002 - DOI - PubMed
    1. Burzyn D, Benoist C, Mathis D. Regulatory T cells in nonlymphoid tissues. Nat Immunol. 2013;14(10):1007–13. PubMed Central PMCID: PMCPMC4708287. doi: 10.1038/ni.2683 - DOI - PMC - PubMed
    1. Arpaia N, Green JA, Moltedo B, Arvey A, Hemmers S, Yuan S, et al. A Distinct Function of Regulatory T Cells in Tissue Protection. Cell. 2015;162(5):1078–89. PubMed Central PMCID: PMCPMC4603556. doi: 10.1016/j.cell.2015.08.021 - DOI - PMC - PubMed

MeSH terms