. 2017 Apr 27;12(4):e0176410.
doi: 10.1371/journal.pone.0176410. eCollection 2017.

A minimal model of burst-noise induced bistability

Affiliations

A minimal model of burst-noise induced bistability

Johannes Falk et al. PLoS One. .

Abstract

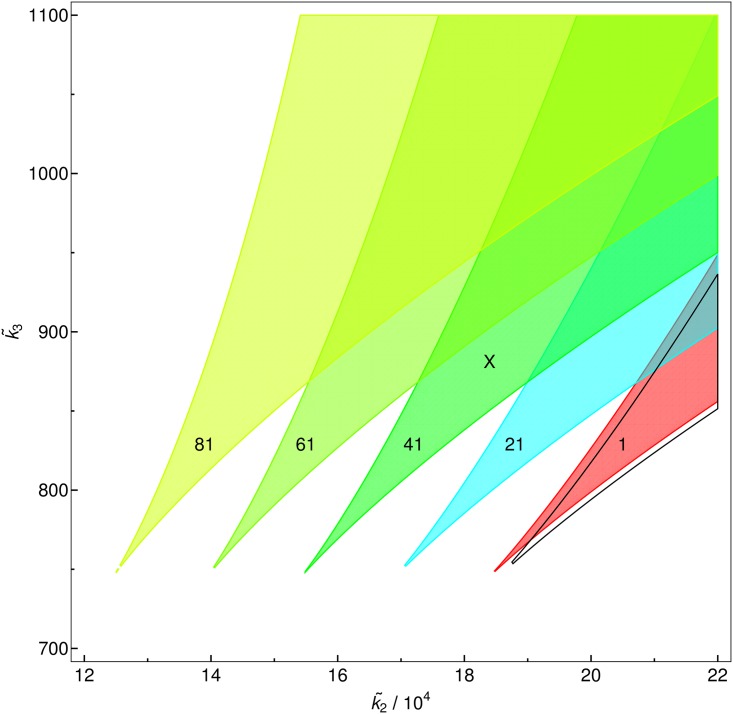
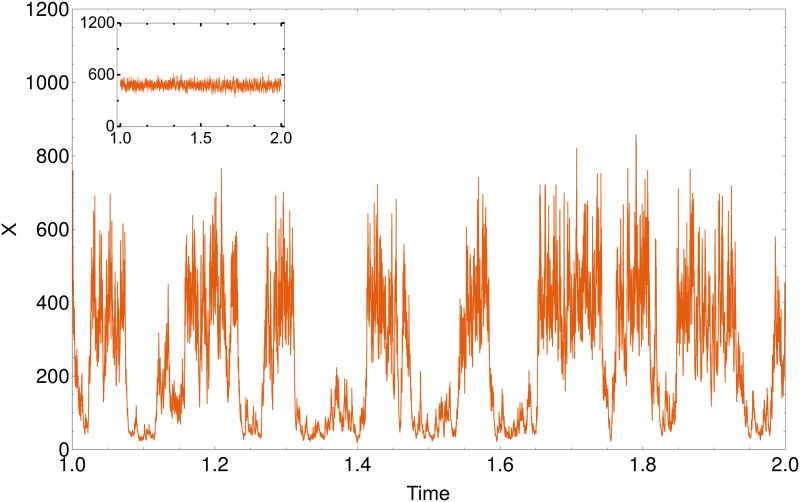
We investigate the influence of intrinsic noise on stable states of a one-dimensional dynamical system that shows in its deterministic version a saddle-node bifurcation between monostable and bistable behaviour. The system is a modified version of the Schlögl model, which is a chemical reaction system with only one type of molecule. The strength of the intrinsic noise is varied without changing the deterministic description by introducing bursts in the autocatalytic production step. We study the transitions between monostable and bistable behavior in this system by evaluating the number of maxima of the stationary probability distribution. We find that changing the size of bursts can destroy and even induce saddle-node bifurcations. This means that a bursty production of molecules can qualitatively change the dynamics of a chemical reaction system even when the deterministic description remains unchanged.


Conflict of interest statement

Competing Interests: The authors have declared that no competing interests exist.

Figures

Fig 1
Fig 1. Parameter regions of the deterministic model and cusp bifurcation.
Top: The bistable (filled) and monostable parameter regions of the deterministic model. Bottom: Steady-state molecule numbers for a two-dimensional cross section, showing the two saddle-node bifurcations that merge, creating a cusp bifurcation. The red line indicates the transitions from stable to unstable. The green line is the projection of the red line onto the k1 − k2-plane. The gray plane in the top graph visualizes the region that is plotted in the bottom figure. The gray line in the top graph is the trajectory of parameters later used to produce Fig 2.
Fig 2
Fig 2. Comparison of stochastic simulation and Fokker-Planck-Equation.
Stationary distributions obtained by stochastic simulation (histograms) and by solving the Fokker-Planck-Equation (lines) for different values of k˜3 (other parameters: k˜1=8·106,k˜2=1.33·105, see the gray line in Fig 1). The dark dots indicate the fixed points of the deterministic model.
Fig 3
Fig 3. Comparison of stochastic simulation and Fokker-Planck-Equation.
Stationary distributions obtained by stochastic simulation (histograms) and by solving the Fokker-Planck-Equation (lines) for different values of the burst size r (other parameters: k˜1=9·106,k˜2=1.5·105,k˜3=720). The dark dots indicate the fixed points of the deterministic model, which do not depend on r.
Fig 4
Fig 4. Influcence of noise on the maxima of the stationary solution.
Influence of noise on the maxima of the stationary solution, showing that noise shifts the maxima to the extent that bifurcations can be destroyed or induced. The red line shows the deterministic fixed points, the first black line shows the solution for a burst size 1 (the standard Schlögl model). With each further black line, the burst size r increases by 10. Starting from the first black curve next to the red one, the parameter value r of the black curves are therefore: 1,11,21,31,41. The other parameters are (a) k˜2=1.65·105,k˜3=720, (b) k˜1=5.33·106,k˜3=800, (c) k˜1=8·106,k˜2=1·105.
Fig 5
Fig 5. Cross section of the phase diagram.
Cross section of the phase diagram in the k˜1=1.54 plane. The burst size for the red surface is r = 1 for each step to the left r is increased by 20 (as indicated by numbers in each colored tongue). The black line shows the deterministic solution.
Fig 6
Fig 6. Time evolution of the system.
Time evolution of a system with a parameter-set: k1 = 3 ⋅ 106, k2 = 77518 and k3 = 601. The burst size was set to r = 25. The time series shows a bistable characteristic of the system with one stable point at X = 43 and one at X = 376. The inset shows the same system without burst (r = 1). Here the system has only one stable point at X = 438.

References

    1. Kendall D. Stochastic Processes and Population Growth. Journal of the Royal Statistical Society Series B-Statistical Methodology. 1949;11(2):230–264.
    1. Gillespie D. Exact Stochastic Simulation of Coupled Chemical-Reactions. Journal of Physical Chemistry. 1977;81(25):2340–2361. 10.1021/j100540a008 - DOI
    1. Nagel K, Schreckenberg M. A Cellular Automaton Model for Freeway Traffic. Journal De Physique I. 1992;2(12):2221–2229. 10.1051/jp1:1992277 - DOI
    1. Guckenheimer J, Holmes PJ. Nonlinear Oscillations, Dynamical Systems, and Bifurcations of Vector Fields. Springer; 2002.
    1. Horsthemke W. Noise Induced Transitions Vidal PDC, Pacault PDA, editors. Springer Series in Synergetics. Springer; Berlin Heidelberg; 1984.

LinkOut - more resources