

Spillover effects on health outcomes in low- and middle-income countries: a systematic review
- PMID: 28449030
- PMCID: PMC5837515
- DOI: 10.1093/ije/dyx039
Spillover effects on health outcomes in low- and middle-income countries: a systematic review
Erratum in
-
Spillover effects on health outcomes in low- and middle-income countries: a systematic review.Int J Epidemiol. 2019 Aug 1;48(4):1387. doi: 10.1093/ije/dyz111. Int J Epidemiol. 2019. PMID: 31157381 Free PMC article. No abstract available.
Abstract
Background: Many interventions delivered to improve health may benefit not only direct recipients but also people in close physical or social proximity. Our objective was to review all published literature about the spillover effects of interventions on health outcomes in low-middle income countries and to identify methods used in estimating these effects.
Methods: We searched 19 electronic databases for articles published before 2014 and hand-searched titles from 2010 to 2013 in five relevant journals. We adapted the Cochrane Collaboration's quality grading tool for spillover estimation and rated the quality of evidence.
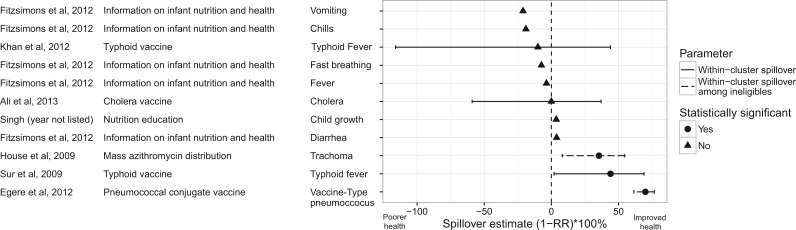
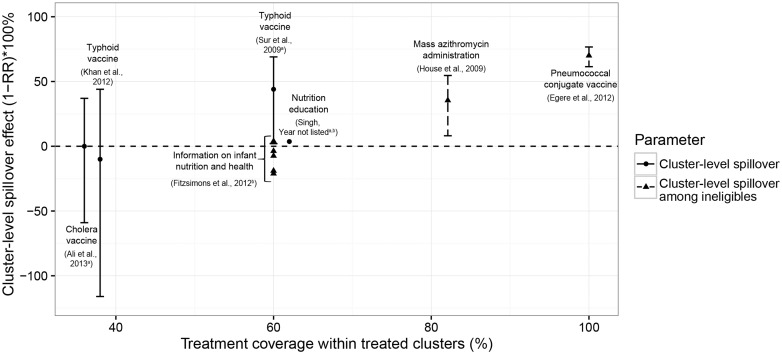
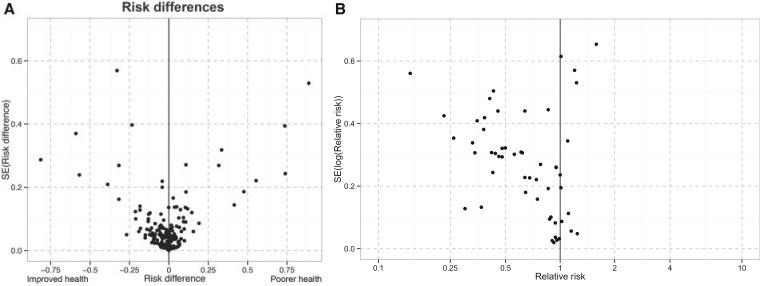
Results: A total of 54 studies met inclusion criteria. We found a wide range of terminology used to describe spillovers, a lack of standardization among spillover methods and poor reporting of spillovers in many studies. We identified three primary mechanisms of spillovers: reduced disease transmission, social proximity and substitution of resources within households. We found the strongest evidence for spillovers through reduced disease transmission, particularly vaccines and mass drug administration. In general, the proportion of a population receiving an intervention was associated with improved health. Most studies were of moderate or low quality. We found evidence of publication bias for certain spillover estimates but not for total or direct effects. To facilitate improved reporting and standardization in future studies, we developed a reporting checklist adapted from the CONSORT framework specific to reporting spillover effects.
Conclusions: We found the strongest evidence for spillovers from vaccines and mass drug administration to control infectious disease. There was little high quality evidence of spillovers for other interventions.
Keywords: Spillover effects; indirect effects; herd effects; herd immunity; diffusion; externalities; interference.
© The Author 2017. Published by Oxford University Press on behalf of the International Epidemiological Association
Figures
References
-
- Duflo E, Glennerster R, Kremer M. Using randomization in development economics research: A toolkit. Handb Dev Econ 2007;4:3895–62.
-
- Miguel E, Kremer M. Worms: Identifying Impacts on Education and Health in the Presence of Treatment Externalities. Econometrica 2004;72:159–217.
-
- Cox DR. Planning of Experiments. Oxford, UK: Wiley, 1958.
Publication types
MeSH terms
Grants and funding
LinkOut - more resources
Full Text Sources
Other Literature Sources
Miscellaneous
