

Clinical Trial
doi: 10.1093/brain/awx088.
Real-time imaging of single neuronal cell apoptosis in patients with glaucoma
Affiliations
- PMID: 28449038
- PMCID: PMC5445254
- DOI: 10.1093/brain/awx088
Item in Clipboard
Clinical Trial
Real-time imaging of single neuronal cell apoptosis in patients with glaucoma
Brain.
.
No abstract available
Keywords: apoptosis; glaucoma; real-time visualization; retinal imaging.
© The Author (2017). Published by Oxford University Press on behalf of the Guarantors of Brain.
Figures
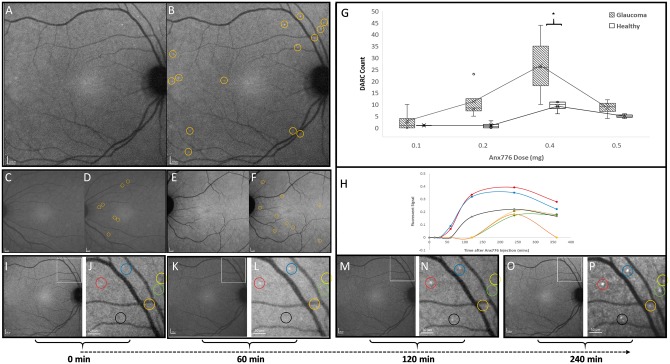
DARC counts are increased in affected glaucoma patients compared to healthy controls. ANX776 injections revealed single neuronal cell apoptosis in the retina of study subjects. Representative retinal images are shown from glaucoma patients following intravenous injections of 0.4 (A and B), 0.2 (C and D) and 0.5 (E and F) mg ANX776 at 240 minutes. Panels show unmarked (A, C and E) and marked (B, D and F) ANX776-positive spots with yellow rings highlighting individual spots. DARC counts were defined as new, unique individual ANX776-labelled spots, at their first appearance in the retina. Analysis of DARC counts in glaucoma and healthy controls for each ANX776 dosing cohort showed that at each dose, the number of DARC spot counts was consistently higher in glaucoma patients compared to healthy controls, and this reached significance at the 0.4 mg (P < 0.005) dose (G). The spread of the individual data points is shown in Tukey’s box plots (G). Horizontal lines indicate medians and interquartile ranges with the continuous line across doses showing the means. Asterisks indicate the level of significance by Bonferroni multiple comparison test between groups (P < 0.01) with two-way ANOVA across the doses showing a significant effect of glaucoma status (P = 0.0033) and time point (P = 0.0011). Multivariable analysis indicated that the total DARC count across 6 h was 2.37-fold higher in patients with glaucoma (95% CI: 1.4–4.03, P = 0.003) at any dose. Different fluorescent intensity profiles were seen for individual labelled spots (H–P). Low (I, K, M and O) and high (J, L, N and P) magnification (scale bars indicated) retinal images at different time points are shown from the same patient as in A at baseline (I and J, 0 min), 60 (K and L), 120 (M and N) and 240 (O and P) min. Marked, colour-coded spots are shown in adjacent panels (J, L, N and P) with fluorescent intensity profiles illustrated in H, identified by corresponding coloured lines.
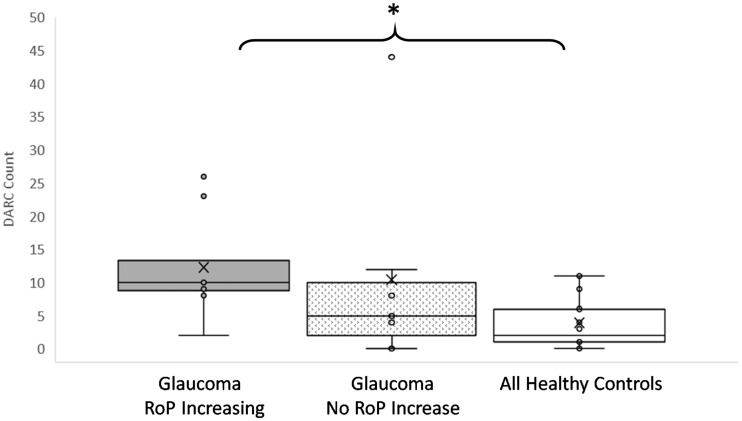
DARC counts are significantly increased in glaucoma patients with increasing rates of progression compared to healthy controls. The rate of progression (RoP) was calculated for all parameters at baseline and follow-up for all glaucoma patients, where an increasing rate of progression was computed from the difference between follow-up and baseline significant (P < 0.05) negative slopes. The DARC count was significantly increased in glaucoma patients with increasing rate of progression in any one parameter, compared to healthy controls, as shown in Tukey’s box plots illustrating individual data points in glaucoma patients with and without increasing rate of progression compared to healthy controls. Asterisks indicate level of significance by Dunn’s multiple comparison test between groups (P < 0.05) with Kruskal Wallis one-way ANOVA showing statistical significance across three groups (P = 0.0448). Horizontal lines indicate medians and interquartile ranges with ×’ symbol showing the means, and all individual data points indicated. See also Table 3.
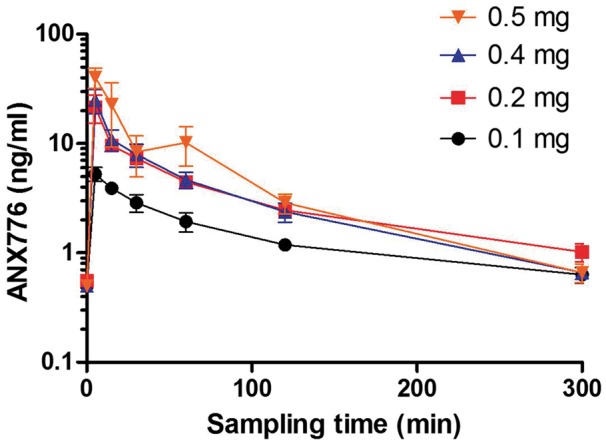
ANX776 pharmacokinetics and pharmacodynamics. The mean serum concentration of ANX776 over time after a single intravenous administration of five different dose levels is shown with standard error bars in healthy and glaucoma cohorts. See also Table 5.
Comment in
-
In vivo imaging of retinal neurodegeneration at the single cell level in humans.Brain. 2017 Jun 1;140(6):1542-1543. doi: 10.1093/brain/awx100. Brain. 2017. PMID: 28549130 No abstract available.
References
-
- Adanja I, Debeir O, Megalizzi V, Kiss R, Warzee N, Decaestecker C. Automated tracking of unmarked cells migrating in three-dimensional matrices applied to anti-cancer drug screening. Exp Cell Res 2010; 316: 181–93. - PubMed
-
- Aptel F, Aryal-Charles N, Giraud JM, El Chehab H, Delbarre M, Chiquet C et al. Progression of visual field in patients with primary open-angle glaucoma - ProgF study 1. Acta Ophthalmol 2015; 93: e615–20. - PubMed
-
- Benali K, Louedec L, Azzouna RB, Merceron O, Nassar P, Al Shoukr F et al. Preclinical validation of 99mTc-annexin A5‐128 in experimental autoimmune myocarditis and infective endocarditis: comparison with 99mTc-HYNIC-annexin A5. Mol Imaging 2014; 13: 1–10. - PubMed
-
- Bengtsson B, Patella VM, Heijl A. Prediction of glaucomatous visual field loss by extrapolation of linear trends. Arch Ophthalmol 2009; 127: 1610–15. - PubMed
Publication types
MeSH terms
Substances
Grants and funding
LinkOut - more resources
Full Text Sources
Other Literature Sources
Medical
