. 2017 Aug 1;24(4):419-434.
doi: 10.1093/dnares/dsx014.

Integrated analysis of individual codon contribution to protein biosynthesis reveals a new approach to improving the basis of rational gene design

Affiliations

Integrated analysis of individual codon contribution to protein biosynthesis reveals a new approach to improving the basis of rational gene design

Juan C Villada et al. DNA Res. .

Abstract

Gene codon optimization may be impaired by the misinterpretation of frequency and optimality of codons. Although recent studies have revealed the effects of codon usage bias (CUB) on protein biosynthesis, an integrated perspective of the biological role of individual codons remains unknown. Unlike other previous studies, we show, through an integrated framework that attributes of codons such as frequency, optimality and positional dependency should be combined to unveil individual codon contribution for protein biosynthesis. We designed a codon quantification method for assessing CUB as a function of position within genes with a novel constraint: the relativity of position-dependent codon usage shaped by coding sequence length. Thus, we propose a new way of identifying the enrichment, depletion and non-uniform positional distribution of codons in different regions of yeast genes. We clustered codons that shared attributes of frequency and optimality. The cluster of non-optimal codons with rare occurrence displayed two remarkable characteristics: higher codon decoding time than frequent-non-optimal cluster and enrichment at the 5'-end region, where optimal codons with the highest frequency are depleted. Interestingly, frequent codons with non-optimal adaptation to tRNAs are uniformly distributed in the Saccharomyces cerevisiae genes, suggesting their determinant role as a speed regulator in protein elongation.

Keywords: codon usage bias; microbial biotechnology; position-dependent codon usage; rational gene design; yeast genomics.


Figures

Figure 1
Figure 1
Quantification strategy of codon usage bias by bins relative to coding sequences’ length. From each original genome, two datasets were arranged, the first including only CDSs lacking signal peptides, and the second comprising only CDSs codifying proteins with signal peptides. Then, for both datasets, all CDSs were divided into ten parts (bins) and their codons quantified and saved in bins (Observed Matrix). Synonymous mutations were introduced, conserving the original codon usage of the genome but scrambling codon positions within genes, thus generating 200 whole simulated genomes per yeast. Codons were quantified by bins as stated in the ‘Material and methods’ section, and a 3D matrix of 10 × 59 × 200 was generated in order to retrieve the expected value and standard deviation for each codon after codon position alteration.
Figure 2
Figure 2
The positional dependency of codon usage bias relative to coding sequences length. The figure shows the analysis applied to the set of coding sequences lacking signal peptides. (A) Deviations from uniformity (squared z-scores) are reported graphically to illustrate the codon usage deviations from uniformity at different intragenic regions, concentrated mainly at the 5′-end close to the start codon. Squared z-scores are presented according to the quadratically scaled bar. (B) Distribution of deviations from uniformity by bin, illustrating the differences between first bin (5′-end region) and subsequent bins. The Mann–Whitney test was applied to determine the significance of the differences.
Figure 3
Figure 3
Heterogeneous correspondences between codon frequency and codon optimality metrics. (A) The values of the Relative Synonymous Codon Usage (RSCU) are shown here in order to characterize each codon in terms of frequency or rarity. Values near to the centre and inside the shaded region with black borderline are frequent codons, those outside the circle are rare. (B) Values of Codon Adaptiveness (w) to cognate tRNAs from the tRNA Adaptation Index (tAI) are represented to illustrate the translation efficiency of each codon. Points inside the shaded region, far apart from the centre of the plot represent “optimal” codons, opposite points near to the centre and inside the white region indicate non-optimal codons.
Figure 4
Figure 4
Integrated characterization of individual codons. (A) Each codon is characterized regarding its frequency and optimality. (B) Percentage of the four codon categories in the 59 redundant codons of each yeast genome. (C) The third-base composition of the four codon categories illustrates the differences between Yarrowia lipolytica and the other yeasts.
Figure 5
Figure 5
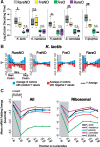
Codon decoding time (CDT), the average of Y-values and the mRNA free folding energy are presented to indicate the features of each codon category. (A) shows the significant differences found when CDT values of Rare–Non-optimal (RareNO) are compared with Frequent–Optimal (FreNO) codons. The translation rate is the slowest when decoding RareNO codons. No significant differences between the optimal ones (FreO and RareO) were found. (B) RareNO codons seem to be enriched at regions near to start codons in K. lactis and other yeasts (Supplementary Fig. S8), while Frequent–Optimal (FreO) codons contrast that profile. FreNO codons are not significantly enriched or depleted as a function of position within genes, they are uniformly distributed inside genes, probably to guarantee the accuracy in protein biosynthesis as translation speed regulators (see Supplementary Figs S3–S7 for individual values of codons per bin). (C) mRNA structure is the lowest in the 5′-end region, where RareNO codons are enriched. The MFE was computed for all the CDSs of each yeast (nK. lactis= 5065, nK. marxianus = 4774, nP. pastoris = 5019, nS. cerevisiae = 5786, nY. lipolytica = 6413).
Figure 6
Figure 6
The codon positional dependency in genes coding proteins with signal peptide. The figure shows the analysis applied to the set of CDSs which have signal peptides. The Y-value (see Materials and methods) is reported graphically to illustrate the codon enrichment or depletion at different intragenic positions.
Figure 7
Figure 7
Proof of concept on codon category contribution to structural features of two different proteins. (A) Similar values of Codon Adaptation Index (CAI) were found for the SSE1 (expressed as a response of heat-shock) and the TEF1a proteins (highly and constitutively expressed). As both present similar CAI values to their host genomes, and have very different expression rates in physiological conditions, they are an interesting example to test our concept. CAI, a commonly used index, seems to be a non-well fitted method for predicting expression levels of proteins and thus is not recommended for the secure optimization of yeast genes. (B) Method for multiple sequence alignment based on codons to determine the conservation of codon categories in coding sequences. If a codon category is conserved at least in four out of five yeasts then the codon is defined as conserved and its category is illustrated with its correspondent colour in the protein structure. (C) Conserved codon categories are highlighted in SSE1 protein structure. Motifs of conserved Frequent–Optimal codons (FreO) at determinant positions in alpha-helices. (D) Conserved codon categories are highlighted in TEF1a protein structure. Positions with conserved Frequent–Non-optimal codons (FreNO), illustrating conserved non-optimal sites within genes at different positions to possibly regulate the efficiency and accuracy of the protein elongation process, being a potential requirement to the co-translational folding of proteins. (E) Changes in codon category composition when both proteins were optimized by CAI algorithm. CAI optimization introduces silent mutations that could impact translation rates by insertion of FreO and FreNO codons.
Figure 8
Figure 8
Theoretical scheme of codon contribution to translation efficiency and co-translational protein folding. The figure shows the potential impacts in quantity, folding and function of proteins by insertion of synonymous (silent) mutations. The four categories of codons determined in the present work have been used to illustrate each codon contribution for protein biosynthesis. (A) A hypothetical protein-coding gene shaped by different codons category. (B) The gene has been modified in order to improve its optimality for available tRNA isoacceptors. Translation speed is enhanced, positively affecting protein quantity. On the other hand, this modification can affect negatively the co-translational folding and with that the protein function. (C) An optimized version in terms of frequency (e.g. by CAI) of the wild-type gene. The insertion of FreNO codons affects negatively the quantity of protein produced, but on the other hand supports the maintenance of a slower speed in the translation steps and thereby assists in co-translational protein folding. (D) Silent mutation inserting RareNO codons (slowest translated codons). It affects the translation rate, decreases protein quantity and leads to unknown features in co-translational folding and function. Abbreviations: FreO: Frequent and Optimal codons; RareO: Rare and Optimal; FreNO: Frequent and Non-optimal; RareNO: Rare and Non-optimal.

Similar articles

Cited by

References

    1. Ikemura T. 1981, Correlation between the abundance of Escherichia coli transfer RNAs and the occurrence of the respective codons in its protein genes, J. Mol. Biol., 146, 1–21. - PubMed
    1. Sharp P., Li W.-H. 1987, The codon adaptation index-a measure of directional synonymous codon usage bias, and its potential applications, Nucleic Acids Res., 15, 1281–95. - PMC - PubMed
    1. Dong H., Nilsson L., Kurland C.G.. 1996, Co-variation of tRNA abundance and codon usage in Escherichia coli at different growth rates, J. Mol. Biol., 260, 649–63. - PubMed
    1. Hahn M.W., Mezey J.G., Begun D.J., et al.2005, Evolutionary genomics: codon bias and selection on single genomes, Nature, 433, E5–6. - PubMed
    1. Dos Reis M., Savva R., Wernisch L.. 2004, Solving the riddle of codon usage preferences: a test for translational selection, Nucleic Acids Res., 32, 5036–44. - PMC - PubMed

MeSH terms