. 2017 Aug;16(4):704-715.
doi: 10.1111/acel.12600. Epub 2017 Apr 27.

Autophagy compensates impaired energy metabolism in CLPXP-deficient Podospora anserina strains and extends healthspan

Affiliations

Autophagy compensates impaired energy metabolism in CLPXP-deficient Podospora anserina strains and extends healthspan

Laura Knuppertz et al. Aging Cell. 2017 Aug.

Abstract

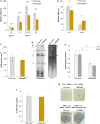
The degradation of nonfunctional mitochondrial proteins is of fundamental relevance for maintenance of cellular homeostasis. The heteromeric CLPXP protein complex in the mitochondrial matrix is part of this process. In the fungal aging model Podospora anserina, ablation of CLPXP leads to an increase in healthy lifespan. Here, we report that this counterintuitive increase depends on a functional autophagy machinery. In PaClpXP mutants, autophagy is involved in energy conservation and the compensation of impairments in respiration. Strikingly, despite the impact on mitochondrial function, it is not mitophagy but general autophagy that is constitutively induced and required for longevity. In contrast, in another long-lived mutant ablated for the mitochondrial PaIAP protease, autophagy is neither induced nor required for lifespan extension. Our data provide novel mechanistic insights into the capacity of different forms of autophagy to compensate impairments of specific components of the complex mitochondrial quality control network and about the biological role of mitochondrial CLPXP in the control of cellular energy metabolism.

Keywords: Podospora anserina; CLPXP protease; aging; autophagy; energy metabolism; mitochondria.


Figures

Figure 1
Figure 1
Mitochondrial function is partially impaired in ∆PaClpXP compared to wild type. (a) Relative oxygen consumption rate (OCR) of 7‐day‐old ∆PaClpXP and wild type mitochondria (for each strain, three mitochondrial preparations with three to six technical replicates were analyzed). State 4 OCR of the wild type was set to 100%. (b) The relative oxygen consumption of mycelia from 7‐day‐old wild type and ∆PaClpXP strains (three biological and four technical replicates) was analyzed after KCN (inhibition of C IV) or SHAM [inhibition of alternative oxidase (AOX)] addition. The basal oxygen consumption of the wild type was set to 100%, and the inhibition of the oxidases was calculated relatively. (c) Basal oxygen consumption rate (OCR) per mg dry weight from mycelia of 7‐day‐old wild type and ∆PaClpXP strains (three biological and four technical replicates). (d) BNPAGE analysis of 100 μg mitochondrial protein extracts from 7‐day‐old wild type and ∆PaClpXP (three mitochondrial preparations). SC, supercomplexes, V2, complex V dimer; I1, complex I monomer; V1, complex V monomer; III 2, complex III dimer; IV 1, complex IV monomer. Changes in the composition are marked with arrows. Coomassie‐stained gel (left) and ‘in‐gel’ staining of C V (right) are demonstrated. (e) Quantification of relative complex I (CI, Coomassie‐stained gel) and complex V (CV, CV‐stained gel) protein levels of wild type and ∆PaClpXP mitochondrial extracts (n = 3) that were separated during a BNPAGE analysis shown in (d). Protein abundance in the wild type was set to 1. Error bars correspond to the standard deviation. P‐values were determined by Student's t‐test (< 0.05). (f) ATP levels of 7‐day‐old wild type vs. ∆PaClpXP (three biological replicates with three technical replicates) were measured by a luminescence‐based assay. Error bars correspond to the standard deviation, and P‐values were determined with paired Student's t‐test (> 0.05). (g) Determination of superoxide and hydrogen peroxide in 7‐day‐old wild type and ∆PaClpXP strains by NBT and DAB staining. (a–c) Error bars correspond to the standard deviation, and P‐values were determined by two‐tailed Mann–Whitney–Wilcoxon U‐test. (a, b, e) *= P< 0.05, **= P< 0.01, *** P< 0.001.
Figure 2
Figure 2
It is healthy to preserve mitochondria from degradation by mitophagy in the different PaClpXP deletion strains. (a) Monitoring mitophagy by western blot analysis of 7‐ and 20‐day‐old PaSod3::Gfp compared to ∆PaClpX/PaSod3::Gfp,PaClpP/PaSod3::Gfp, and ∆PaClpXP/PaSod3::Gfp. (b) Quantification of ‘free GFP’ protein levels of 7 (n = 3)‐ and 20 (n = 4)‐day‐old PaSod3::Gfp vs. ∆PaClpX/PaSod3::Gfp, ∆PaClpP/PaSod3::Gfp, and ∆PaClpXP/PaSod3::Gfp normalized to the level of PaSOD1. Protein abundance in 7‐day‐old PaSod3::Gfp was set to 1. Error bars correspond to the standard deviation. P‐values were determined by Student's t‐test. (c) Relative growth rates of MMS‐treated wild type (n = 16) and ∆PaClpXP (n = 17) compared to the untreated controls. P‐values were determined between the wild type and the mutant and between each strain and MMS condition by two‐tailed Mann–Whitney–Wilcoxon U‐test. Error bars correspond to the standard deviation. (d) Survival curves of the wild type (n = 20), ∆PaClpXP (n = 21), ∆PaCypD (n = 23), and ∆PaClpXP/∆PaCypD (n = 23). P‐values were determined between wild type and ∆PaClpXP (< 0.001), wild type and ∆PaCypD (> 0.05), ∆PaClpXP and ∆PaCypD (< 0.001), between ∆PaClpXP/∆PaCypD and ∆PaClpXP (< 0.05), ∆PaClpXP/∆PaCypD and wild type (< 0.001), respectively, ∆PaClpXP/∆PaCypD and ∆PaCypD (< 0.001) by two‐tailed Mann–Whitney U‐test. (e) Growth rate of the wild type (n = 20), ∆PaClpXP (n = 22), ∆PaCypD (n = 24), and ∆PaClpXP/∆PaCypD (n = 26). Error bars correspond to the standard deviation, and P‐values were determined by two‐tailed Mann–Whitney–Wilcoxon U‐test. (f) Monitoring mitophagy by western blot analysis of PaSod3::Gfp compared to ∆PaClpXP/PaSod3::Gfp, ∆PaCypD/PaSod3::Gfp, and ∆PaClpXP/∆PaCypD/PaSod3::Gfp. The Coomassie‐stained gel serves as a loading control. (g) Determination of superoxide and hydrogen peroxide in 7‐day‐old wild type, ∆PaClpXP, ∆PaCypD, and ∆PaClpXP/∆PaCypD strains by NBT and DAB staining. (c, e) *= P< 0.05, **= P< 0.01, *** P< 0.001.
Figure 3
Figure 3
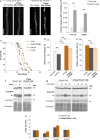
Autophagy is induced in a starvation‐like response of PaClpXP mutant strains. LSFM of hyphae from 4 (a)‐ and 20 (b)‐day‐old wild type and ∆PaClpX, ∆PaClpP, and ∆PaClpXP strains expressing Gfp::PaAtg8. (c) Quantification of autophagosomes of 4‐ and 20‐day‐old wild type and ∆PaClpX, ∆PaClpP, and ∆PaClpXP strains expressing Gfp::PaAtg8 (n = 10). P‐values were determined between 4‐ and 20‐day‐old strains and between wild type and mutant of the same age. Error bars correspond to the standard error. P‐values were determined by two‐tailed Mann–Whitney–Wilcoxon U‐test. (d) Monitoring autophagy by western blot analysis of 7‐ and 20–day‐old PaSod1::Gfp compared to ∆PaClpX/PaSod1::Gfp, ∆PaClpP/PaSod1::Gfp, and ∆PaClpXP/PaSod1::Gfp cultivated on CM medium. (e) Monitoring autophagy by western blot analysis of 7‐day‐old PaSod1::Gfp compared to ∆PaClpX/PaSod1::Gfp, ∆PaClpP/PaSod1::Gfp, and ∆PaClpXP/PaSod1::Gfp cultivated on M2 medium. (f) Quantification of ‘free GFP’ protein levels of 7 (n = 4)‐day‐old PaSod1::Gfp vs. ∆PaClpX/PaSod1::Gfp, ∆PaClpP/PaSod1::Gfp, and ∆PaClpXP/PaSod1::Gfp cultivated on CM or M2 medium normalized to the level of PaSOD1. Protein abundance in 7‐day‐old PaSod1::Gfp was set to 1. Error bars correspond to the standard deviation. P‐values were determined by Student's t‐test. (g) Survival curves of the wild type (n = 25) and ∆PaClpXP (n = 25) cultivated on M2 vs. M2‐. P‐values were determined between wild type and ∆PaClpXP on M2 (< 0.001), wild type and ∆PaClpXP on M2‐ (< 0.001), wild type on M2 and M2‐ (< 0.001), and ∆PaClpXP on M2 and M2‐ (< 0.001) by two‐tailed Mann–Whitney–Wilcoxon U‐test. (h) ATP levels of 5‐day‐old wild type, ∆PaClpXP, and ∆PaClpXP/∆PaAtg1 (three biological replicates with three technical replicates) were measured by a luminescence‐based assay. Error bars correspond to the standard deviation, and P‐values were determined with paired Student's t‐test. (c, f, h) *= P< 0.05, **= P< 0.01, *** P< 0.001.
Figure 4
Figure 4
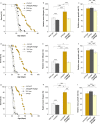
Autophagy is responsible for the healthy phenotype of ∆PaClpXP mutants. (a) Survival curves of the wild type (n = 27), ∆PaAtg1 (n = 27; < 0.001), ∆PaClpX (n = 29), and ∆PaClpX/∆PaAtg1 (n = 30; < 0.001). (b) Relative mean lifespan of ∆PaAtg1 (n = 27), ∆PaClpX (n = 29), and ∆PaClpX/∆PaAtg1 (n = 30) resulting from the comparison of the mean lifespan of each strain with the mean lifespan of the wild type (n = 27, set to 100%). (c) Relative mean growth rates of ∆PaAtg1 (n = 27), ∆PaClpX (n = 29), and ∆PaClpX/∆PaAtg1 (n = 30) derived from the comparison of the mean growth rate of each strain with the mean growth rate of the wild type (n = 27, set to 100%). (d) Survival curves of the wild type (n = 27), ∆PaAtg1 (n = 27; < 0.001), ∆PaClpP (n = 32), and ∆PaClpP/∆PaAtg1 (n = 23; < 0.001). (e) Relative mean lifespan of ∆PaAtg1 (n = 27), ∆PaClpP (n = 32), and ∆PaClpP/∆PaAtg1 (n = 23) resulting from the comparison of the mean lifespan of each strain with the mean lifespan of the wild type (n = 27, set to 100%). (f) Relative mean growth rates of ∆PaAtg1 (n = 27), ∆PaClpP (n = 32), and ∆PaClpP/∆PaAtg1 (n = 23) derived from the comparison of the mean growth rate of each strain with the mean growth rate of the wild type (n = 27, set to 100%). (g) Survival curves of the wild type (n = 27), ∆PaAtg1 (n = 27; P < 0.001), ∆PaClpXP (n = 31), and ∆PaClpXP/∆PaAtg1 (n = 25; < 0.001). (h) Relative mean lifespan of ∆PaAtg1 (n = 27), ∆PaClpXP (n = 31), and ∆PaClpXP/∆PaAtg1 (n = 25) resulting from the comparison of the mean lifespan of each strain with the mean lifespan of the wild type (n = 27, set to 100%). (i) Relative mean growth rates of ∆PaAtg1 (n = 27), ∆PaClpXP (n = 31), and ∆PaClpXP/∆PaAtg1 (n = 25) derived from the comparison of the mean growth rate of each strain with the mean growth rate of the wild type (n = 27, set to 100%). (b, c, e, f, h, i) Error bars correspond to the standard error, and P‐values were determined by two‐tailed Mann–Whitney–Wilcoxon U‐test. *= P< 0.05, **= P< 0.01, *** P< 0.001.
Figure 5
Figure 5
The healthy phenotype of ∆PaIap is not autophagy dependent. (a). LSFM of hyphae from 4‐ and 20–day‐old wild type and ∆PaIap strains expressing Gfp::PaAtg8. (b) Quantification of autophagosomes of 4‐ and 20‐day‐old wild type and ∆PaIap strains expressing Gfp::PaAtg8 (n = 10). P‐values were determined between 4‐ and 20‐day‐old strains and between wild type and mutant of the same age. Error bars correspond to the standard error. (c) Survival curves of the wild type (n = 27), ∆PaAtg1 (n = 27; < 0.001), ∆PaIap (n = 46), and ∆PaIap/∆PaAtg1 (n = 38; < 0.01). (d) Relative mean lifespan of ∆PaAtg1 (n = 27), ∆PaIap (n = 46), and ∆PaIap/∆PaAtg1 (n = 38) resulting from the comparison of the mean lifespan of each strain with the mean lifespan of the wild type (n = 27, set to 100%). (e) Relative mean growth rates of ∆PaAtg1 (n = 27), ∆PaIap (n = 46), and ∆PaIap/∆PaAtg1 (n = 38) derived from the comparison of the mean growth rate of each strain with the mean growth rate of the wild type (n = 27, set to 100%). (f) Monitoring mitophagy during MMS treatment (0.09% for the last 5 h of cultivation) by western blot analysis of 7‐day‐old PaSod1::Gfp compared to ∆PaIap/PaSod1::Gfp. (g) Monitoring autophagy by western blot analysis of 7‐day, 10‐day, 20‐day, and 24‐day‐old PaSod1::Gfp compared to ∆PaIap/PaSod1::Gfp. (h) Quantification of ‘free GFP’ protein levels of 7‐day (n = 4), 10‐day (n = 4), 20‐day (n = 4), and 24‐day (n = 4)‐old PaSod1::Gfp vs. ∆PaIap/PaSod1::Gfp normalized to the level of PaSOD1. Protein abundance in 7–day‐old PaSod1::Gfp was set to 1. Error bars correspond to the standard deviation. P‐values were determined by Student's t‐test. (b, d, e) P‐values were determined by two‐tailed Mann‐Whitney‐Wilcoxon U‐test (*= P< 0.05, **= P< 0.01, *** P< 0.001).
Figure 6
Figure 6
Regulation of aerobic metabolism and autophagy in the wild type compared to ∆PaClpXP. In the wild type, NADH generated by the tricarboxylic acid cycle (TCA) is used by oxidative phosphorylation to generate ATP, and thus only basal autophagy levels occur. Because there are no limitations in mitochondrial function, mitophagy level and lifespan behave normal in Podospora anserina wild type. Ablation of the mitochondrial AAA+ protease PaCLPXP leads to modifications in mitochondrial respiratory (complex I, complex IV, and complex V) chain and energy metabolism. This deficiency is compensated by molecular responses leading to the induction of the alternative oxidase (AOX) and by the upregulation of unspecific general autophagy, compensating for a decreased ATP content and leading to an increased lifespan of PaClpXP deletion mutants as a hormetic response to mild stress. Figure is modified according to Rizzuto et al. (2012). OMM, outer mitochondrial membrane; IMM, inner mitochondrial membrane.

Similar articles

Cited by

  • A Network of Pathways Controlling Cellular Homeostasis Affects the Onset of Senescence in Podospora anserina.
    Osiewacz HD, Schürmanns L. Osiewacz HD, et al. J Fungi (Basel). 2021 Mar 31;7(4):263. doi: 10.3390/jof7040263. J Fungi (Basel). 2021. PMID: 33807190 Free PMC article. Review.
  • Characterization of TR-107, a novel chemical activator of the human mitochondrial protease ClpP.
    Fennell EMJ, Aponte-Collazo LJ, Wynn JD, Drizyte-Miller K, Leung E, Greer YE, Graves PR, Iwanowicz AA, Ashamalla H, Holmuhamedov E, Lang H, Karanewsky DS, Der CJ, Houry WA, Lipkowitz S, Iwanowicz EJ, Graves LM. Fennell EMJ, et al. Pharmacol Res Perspect. 2022 Aug;10(4):e00993. doi: 10.1002/prp2.993. Pharmacol Res Perspect. 2022. PMID: 35929764 Free PMC article.
  • Guidelines and recommendations on yeast cell death nomenclature.
    Carmona-Gutierrez D, Bauer MA, Zimmermann A, Aguilera A, Austriaco N, Ayscough K, Balzan R, Bar-Nun S, Barrientos A, Belenky P, Blondel M, Braun RJ, Breitenbach M, Burhans WC, Büttner S, Cavalieri D, Chang M, Cooper KF, Côrte-Real M, Costa V, Cullin C, Dawes I, Dengjel J, Dickman MB, Eisenberg T, Fahrenkrog B, Fasel N, Fröhlich KU, Gargouri A, Giannattasio S, Goffrini P, Gourlay CW, Grant CM, Greenwood MT, Guaragnella N, Heger T, Heinisch J, Herker E, Herrmann JM, Hofer S, Jiménez-Ruiz A, Jungwirth H, Kainz K, Kontoyiannis DP, Ludovico P, Manon S, Martegani E, Mazzoni C, Megeney LA, Meisinger C, Nielsen J, Nyström T, Osiewacz HD, Outeiro TF, Park HO, Pendl T, Petranovic D, Picot S, Polčic P, Powers T, Ramsdale M, Rinnerthaler M, Rockenfeller P, Ruckenstuhl C, Schaffrath R, Segovia M, Severin FF, Sharon A, Sigrist SJ, Sommer-Ruck C, Sousa MJ, Thevelein JM, Thevissen K, Titorenko V, Toledano MB, Tuite M, Vögtle FN, Westermann B, Winderickx J, Wissing S, Wölfl S, Zhang ZJ, Zhao RY, Zhou B, Galluzzi L, Kroemer G, Madeo F. Carmona-Gutierrez D, et al. Microb Cell. 2018 Jan 1;5(1):4-31. doi: 10.15698/mic2018.01.607. Microb Cell. 2018. PMID: 29354647 Free PMC article. Review.
  • Mitochondrial Phospholipid Homeostasis Is Regulated by the i-AAA Protease PaIAP and Affects Organismic Aging.
    Löser T, Joppe A, Hamann A, Osiewacz HD. Löser T, et al. Cells. 2021 Oct 16;10(10):2775. doi: 10.3390/cells10102775. Cells. 2021. PMID: 34685755 Free PMC article.
  • Identification and immune features of cuproptosis-related molecular clusters in polycystic ovary syndrome.
    Su Z, Su W, Li C, Ding P, Wang Y. Su Z, et al. Sci Rep. 2023 Jan 18;13(1):980. doi: 10.1038/s41598-022-27326-0. Sci Rep. 2023. PMID: 36653385 Free PMC article.

References

    1. Al‐Furoukh N, Ianni A, Nolte H, Holper S, Kruger M, Wanrooij S, Braun T (2015) ClpX stimulates the mitochondrial unfolded protein response (UPRmt) in mammalian cells. Biochim. Biophys. Acta 1853, 2580–2591. - PubMed
    1. Borghouts C, Werner A, Elthon T, Osiewacz HD (2001) Copper‐modulated gene expression and senescence in the filamentous fungus Podospora anserina . Mol. Cell. Biol. 21, 390–399. - PMC - PubMed
    1. Brust D, Daum B, Breunig C, Hamann A, Kühlbrandt W, Osiewacz HD (2010) Cyclophilin D links programmed cell death and organismal aging in Podospora anserina . Aging Cell 9, 761–775. - PubMed
    1. Carreira RS, Lee Y, Ghochani M, Gustafsson ÅB, Gottlieb RA (2010) Cyclophilin D is required for mitochondrial removal by autophagy in cardiac cells. Autophagy 6, 462–472. - PMC - PubMed
    1. Cole A, Wang Z, Coyaud E, Voisin V, Gronda M, Jitkova Y, Mattson R, Hurren R, Babovic S, Maclean N, Restall I, Wang X, Jeyaraju DV, Sukhai MA, Prabha S, Bashir S, Ramakrishnan A, Leung E, Qia YH, Zhang N, Combes KR, Ketela T, Lin F, Houry WA, Aman A, Al‐Awar R, Zheng W, Wienholds E, Xu CJ, Dick J, Wang JC, Moffat J, Minden MD, Eaves CJ, Bader GD, Hao Z, Kornblau SM, Raught B, Schimmer AD (2015) Inhibition of the mitochondrial protease ClpP as a therapeutic strategy for human acute myeloid leukemia. Cancer Cell 27, 864–876. - PMC - PubMed

LinkOut - more resources