

Regional variation in outcomes for lower extremity vascular disease in the Vascular Quality Initiative
- PMID: 28450103
- PMCID: PMC5572773
- DOI: 10.1016/j.jvs.2017.01.061
Regional variation in outcomes for lower extremity vascular disease in the Vascular Quality Initiative
Abstract
Background: Increased focus has been placed on perioperative and long-term outcomes in the treatment of peripheral artery disease (PAD), both for purposes of quality improvement and for assessment of performance at a surgeon and institutional level. This study evaluates regional variation in outcomes after treatment for PAD within the Vascular Quality Initiative (VQI). By describing the variation in practice patterns and outcomes across regions, we hope that each regionally based quality group can select which areas are most important for them to focus on as they will have access to their regional data to compare.
Methods: We identified all patients in the VQI who had infrainguinal bypass or endovascular intervention from 2009 to 2014. We compared variation in perioperative and 1-year outcomes stratified by symptom status and revascularization type among the 16 regional groups of the VQI. We analyzed variation in perioperative end points using χ2 analysis, and 1-year end points were analyzed using Kaplan-Meier and life-table analysis.
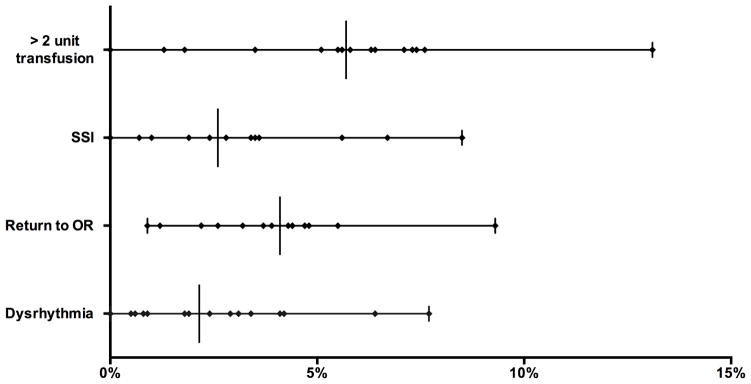
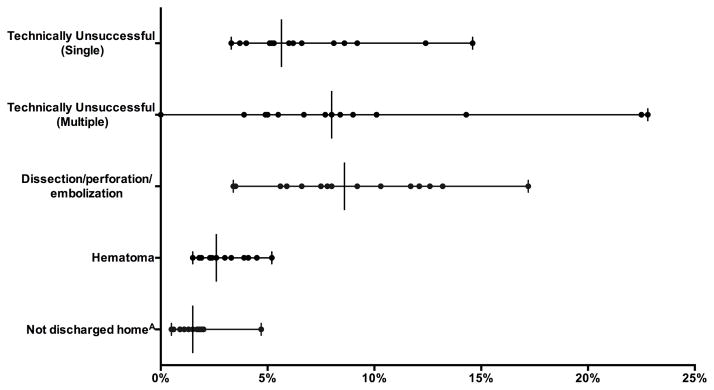
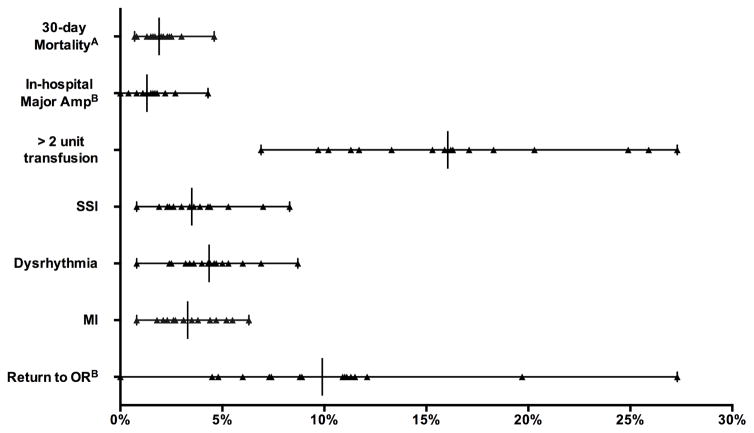
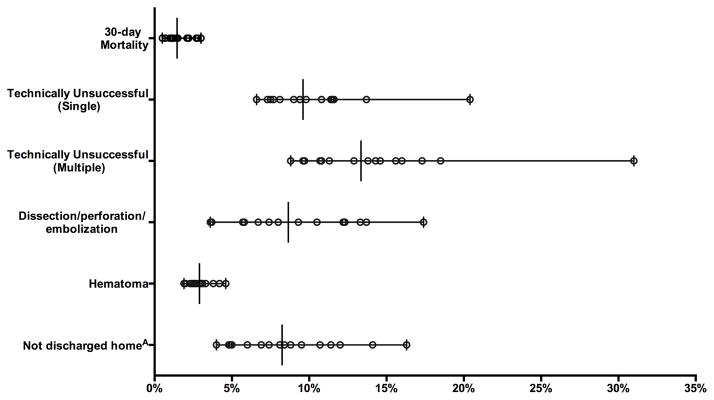
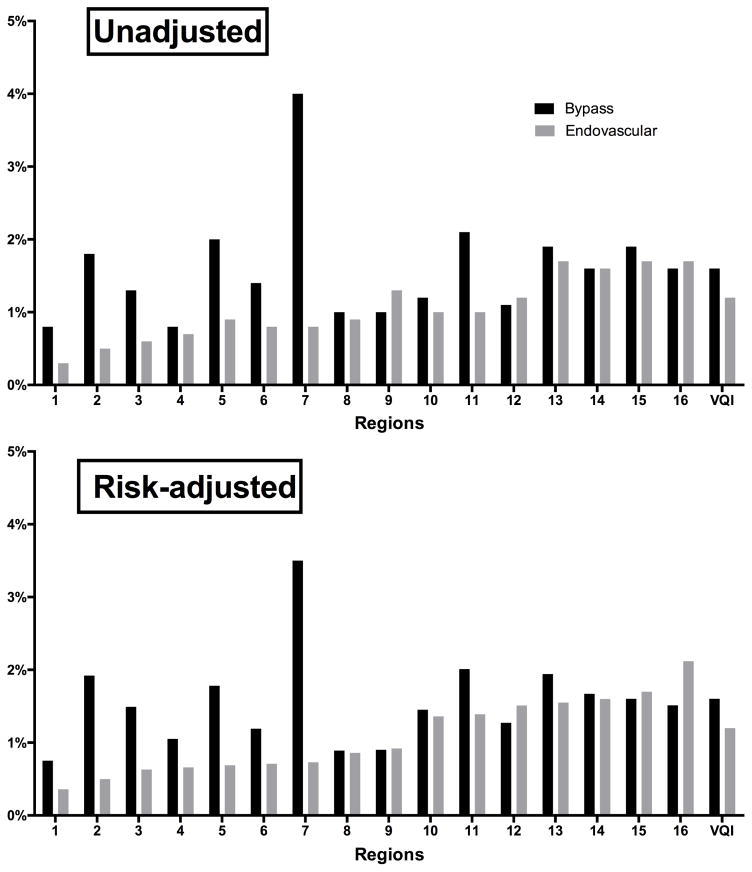
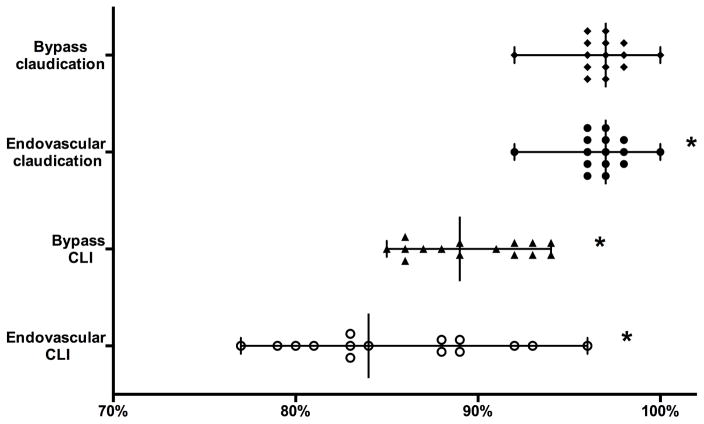
Results: We identified 15,338 bypass procedures for symptomatic PAD: 27% for claudication, 59% for chronic limb-threatening ischemia (CLI; 61% of these for tissue loss), and 14% for acute limb ischemia. We identified 33,925 endovascular procedures for symptomatic PAD: 42% for claudication, 48% for CLI (73% of these for tissue loss), and 10% for acute limb ischemia. Thirty-day mortality varied significantly after endovascular intervention for CLI (0.5%-3%; P < .001) but not for claudication (0.0%-0.5%, P = .77) or for bypass for claudication (0.0%-2.6%; P = .37) or CLI (0.0%-5.0%; P = .08). After bypass, rates of >2 units transfused red blood cells (claudication, 0.0%-13% [P < .001]; CLI, 6.9%-27% [P < .001]) varied significantly. In-hospital major amputation was variable after bypass for CLI (0.0%-4.3%; P = .004) but not for claudication (0.0%-0.6%; P = .98), as was postoperative myocardial infarction (claudication, 0.0%-4% [P = .36]; CLI, 0.8%-6% [P = .001]). One-year survival varied significantly for endovascular interventions for claudication (92%-100%; P < .001), bypass for CLI (85%-94% [P < .001]), and endovascular interventions for CLI (77%-96%; P < .001) but not after bypass for claudication (95%-100%; P = .57).
Conclusions: In this real-world comparison among VQI regions, we found significant variation in perioperative and 1-year end points for patients with PAD undergoing bypass or endovascular intervention. This study highlights opportunities for quality improvement efforts to reduce variation and to improve outcomes.
Copyright © 2017 Society for Vascular Surgery. Published by Elsevier Inc. All rights reserved.
Figures
Comment in
-
Invited commentary.J Vasc Surg. 2017 Sep;66(3):818-819. doi: 10.1016/j.jvs.2017.02.024. J Vasc Surg. 2017. PMID: 28842072 No abstract available.
References
-
- Prevention CfDCa. Deaths: Final Data for 2013. 2013. - PubMed
-
- Hannan EL, Kilburn H, Jr, O’Donnell JF, Lukacik G, Shields EP. Adult open heart surgery in New York State. An analysis of risk factors and hospital mortality rates. JAMA. 1990;264(21):2768–74. - PubMed
-
- O’Connor GT, Plume SK, Olmstead EM, Coffin LH, Morton JR, Maloney CT, et al. A regional prospective study of in-hospital mortality associated with coronary artery bypass grafting. The Northern New England Cardiovascular Disease Study Group. JAMA. 1991;266(6):803–9. - PubMed
-
- Khuri SF, Daley J, Henderson W, Hur K, Gibbs JO, Barbour G, et al. Risk adjustment of the postoperative mortality rate for the comparative assessment of the quality of surgical care: results of the National Veterans Affairs Surgical Risk Study. J Am Coll Surg. 1997;185(4):315–27. - PubMed
-
- Birkmeyer JD, Dimick JB. Understanding and reducing variation in surgical mortality. Annu Rev Med. 2009;60:405–15. - PubMed
Publication types
MeSH terms
Grants and funding
LinkOut - more resources
Full Text Sources
Other Literature Sources
Medical
Research Materials
Miscellaneous
