. 2017 Jun 5;214(6):1691-1710.
doi: 10.1084/jem.20160855. Epub 2017 Apr 27.

An adaptive signaling network in melanoma inflammatory niches confers tolerance to MAPK signaling inhibition

Affiliations

An adaptive signaling network in melanoma inflammatory niches confers tolerance to MAPK signaling inhibition

Helen L Young et al. J Exp Med. .

Abstract

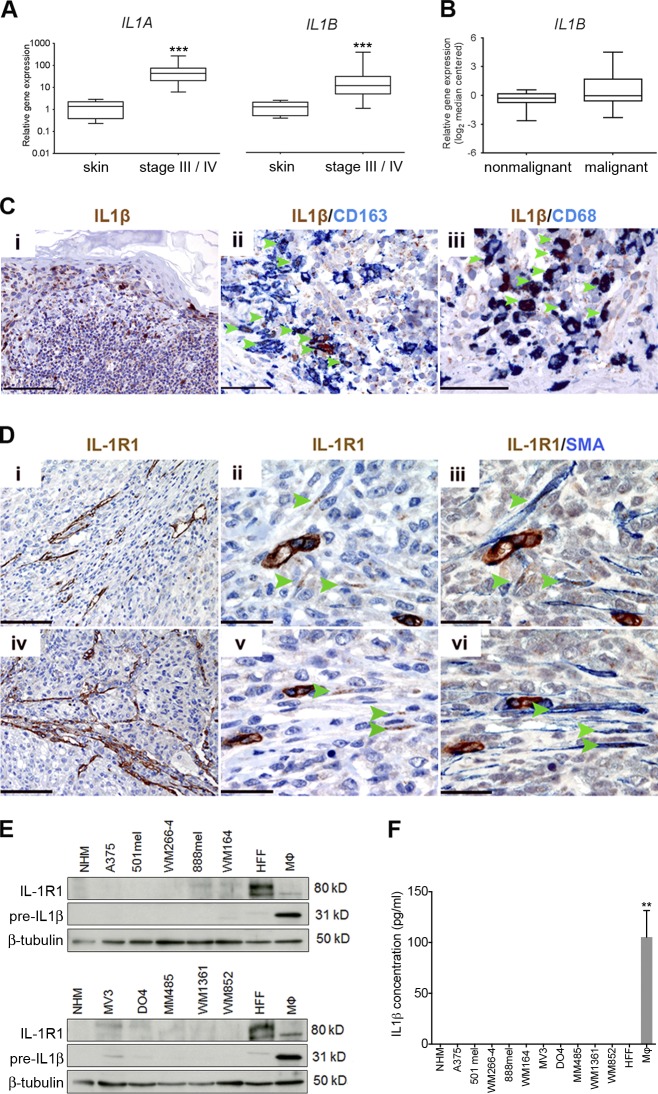
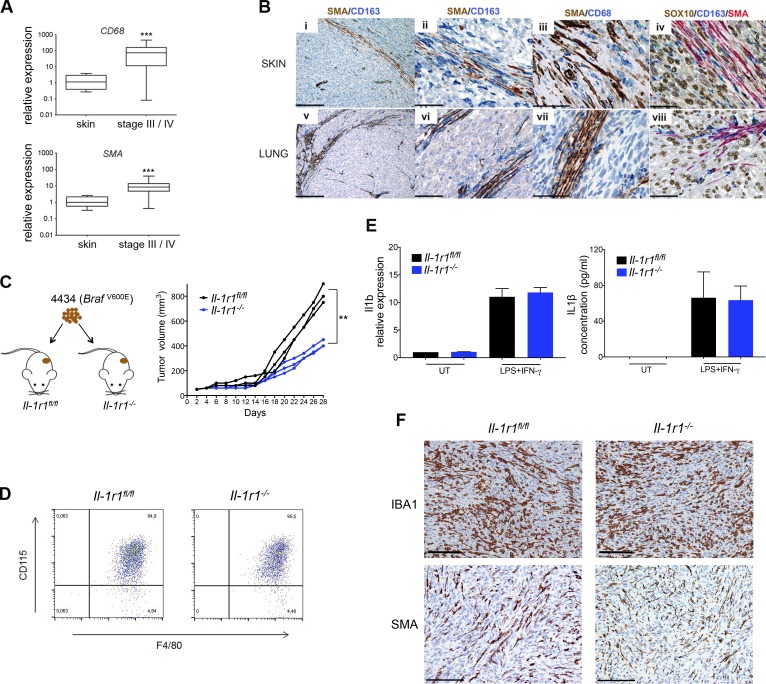
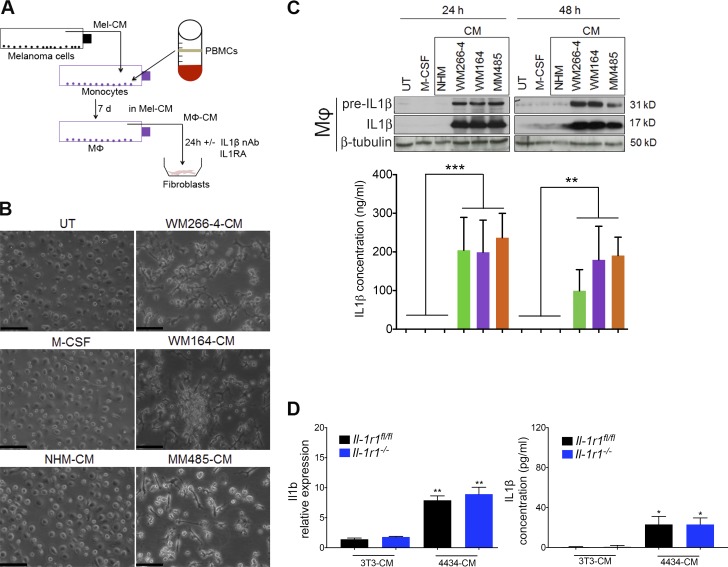
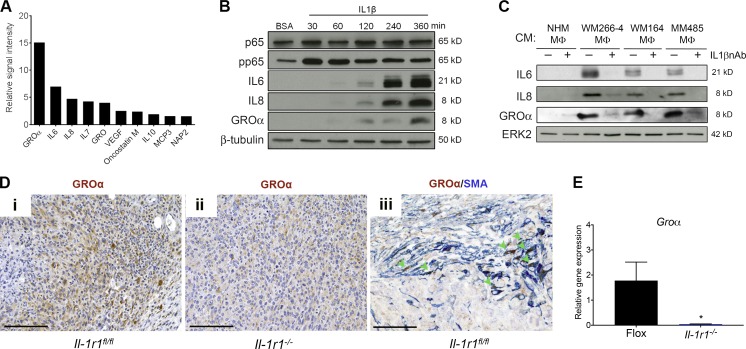
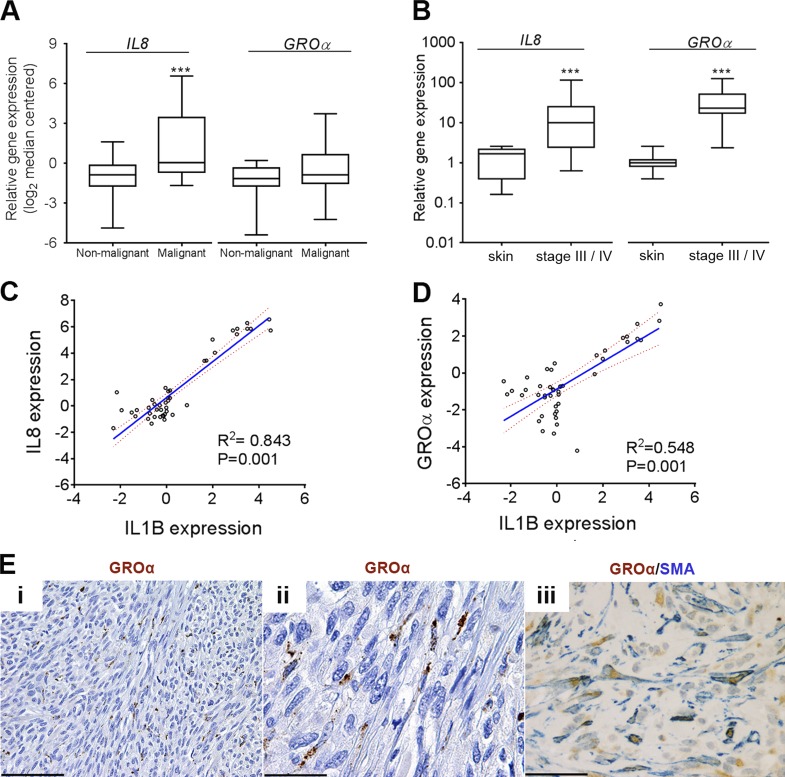
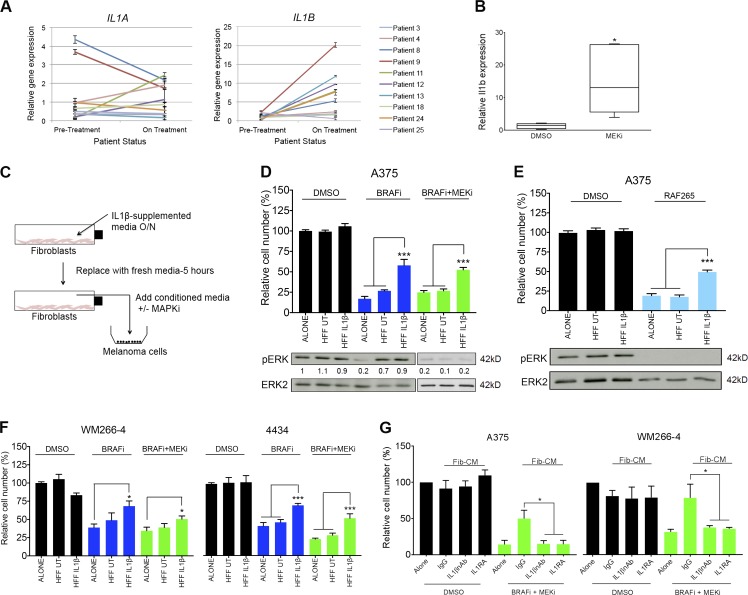
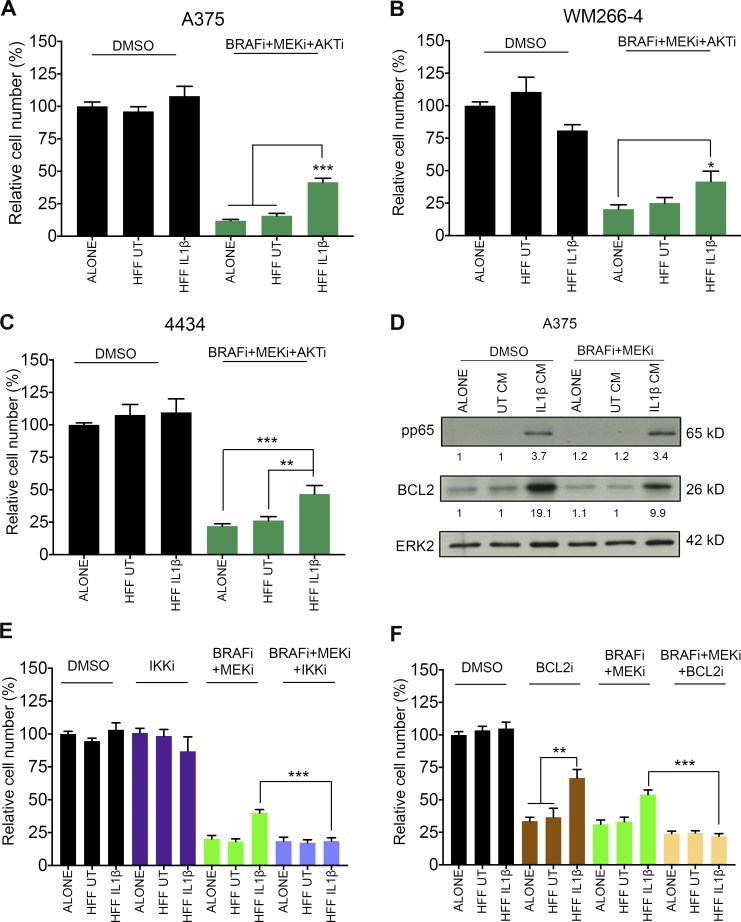
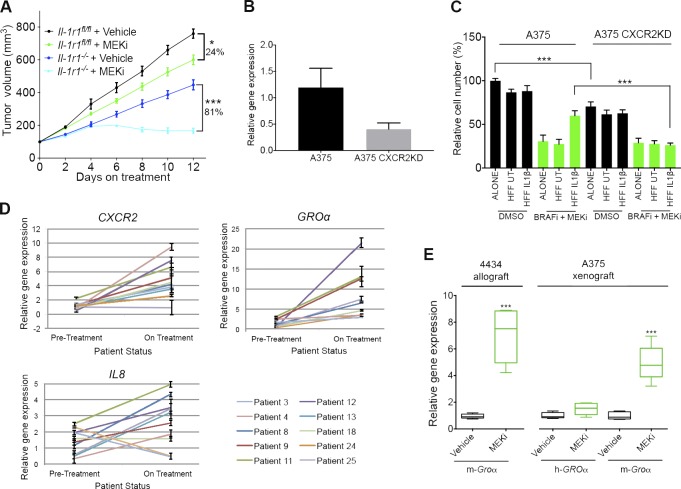
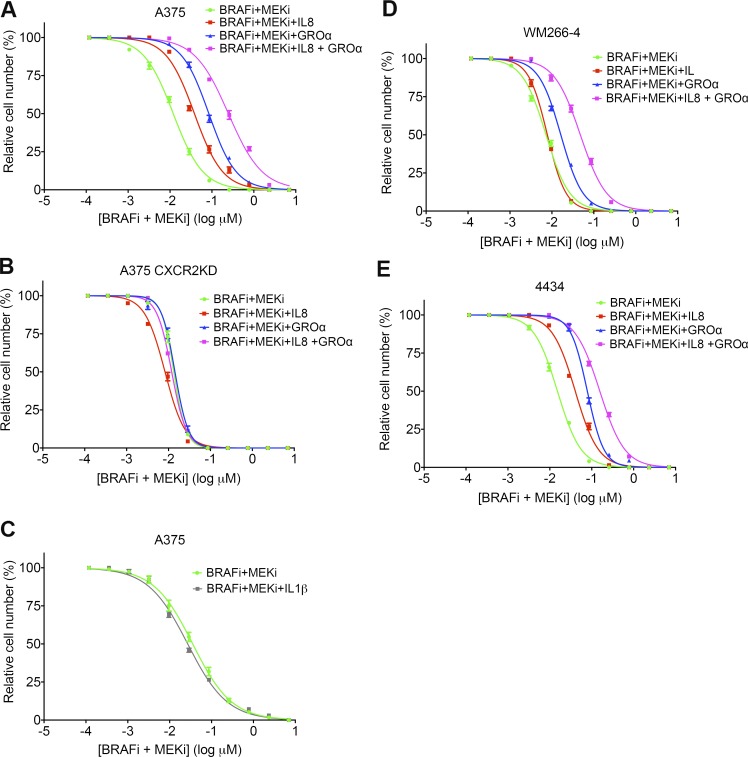
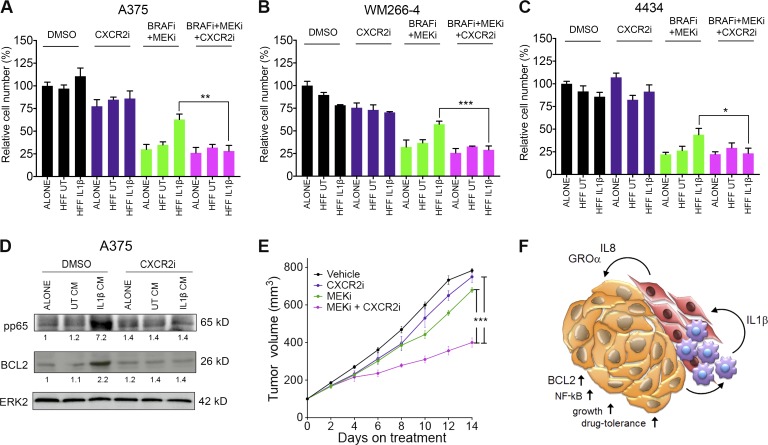
Mitogen-activated protein kinase (MAPK) pathway antagonists induce profound clinical responses in advanced cutaneous melanoma, but complete remissions are frustrated by the development of acquired resistance. Before resistance emerges, adaptive responses establish a mutation-independent drug tolerance. Antagonizing these adaptive responses could improve drug effects, thereby thwarting the emergence of acquired resistance. In this study, we reveal that inflammatory niches consisting of tumor-associated macrophages and fibroblasts contribute to treatment tolerance through a cytokine-signaling network that involves macrophage-derived IL-1β and fibroblast-derived CXCR2 ligands. Fibroblasts require IL-1β to produce CXCR2 ligands, and loss of host IL-1R signaling in vivo reduces melanoma growth. In tumors from patients on treatment, signaling from inflammatory niches is amplified in the presence of MAPK inhibitors. Signaling from inflammatory niches counteracts combined BRAF/MEK (MAPK/extracellular signal-regulated kinase kinase) inhibitor treatment, and consequently, inhibiting IL-1R or CXCR2 signaling in vivo enhanced the efficacy of MAPK inhibitors. We conclude that melanoma inflammatory niches adapt to and confer drug tolerance toward BRAF and MEK inhibitors early during treatment.


Figures

Figure 1.
Figure 1.
IL-1 and IL-1R1 expression is enriched in the melanoma stroma. (A) Real-time qPCR analysis of IL1A and IL1B expression in stage-III and stage-IV melanoma tumor samples (n = 39) relative to expression in human skin samples (n = 8). ***, P < 0.001; Mann-Whitney test. (B) Analysis of IL1B expression in normal skin and benign nevi samples (nonmalignant; n = 25) and cutaneous melanoma samples (malignant; n = 45) from an available gene expression dataset (Talantov et al., 2005) accessed through the Oncomine platform. (C) Sections from a case of primary cutaneous melanoma stained for IL-1β, CD163, and CD68 expression as indicated by labels. Bars: (i) 200 µm; (ii) 50 µm; (iii) 33 µm. (D) Serial sections from two skin metastases (i–iii and iv–vi, respectively), stained for IL-1R1 and SMA expression as indicated by the labels. Bars: (i and iv) 200 µm; (ii, iii, v, and vi) 33 µm. (C and D) Arrowheads indicate cells that are clearly double stained. (E) Western blot analysis of IL-1R1 and IL-1β precursor protein expression in a panel of cell lines. Data are representative of three independent experiments. (F) Secreted IL-1β in conditioned media from a panel of melanoma cell lines detected by ELISA. Data are represented as mean ± SEM for three independent samples in each group. **, P < 0.01; Dunn’s multiple comparisons test. (E and F) Macrophages (Mφ) were stimulated with 100 ng/ml IFN-γ and 20 ng/ml LPS.
Figure 2.
Figure 2.
Macrophages and fibroblasts are organized in the melanoma stroma into inflammatory niches to relay an IL-1 signal that fosters tumor growth. (A) Real-time qPCR analysis of CD68 and SMA expression in stage-III and stage-IV melanoma tumor samples (n = 39) relative to expression in human skin samples (n = 8). ***, P < 0.001; Mann-Whitney test. (B) Sections from two cases of skin (i–iv) and lung (v–viii) metastasis of primary cutaneous melanoma, stained for SMA, CD163, CD68, and SOX10 expression as indicated by the labels. Bars: (i and v) 200 µm; (ii, iv, vi, and viii) 50 µm; (iii and vii) 33 µm. (C) Schematic of BrafV600E-4434 mouse allograft model (left) and growth of individual BrafV600E-4434 allografts in Il-1r1fl/fl (n = 3) and Il-1r1−/− (n = 3; right) mice. **, P < 0.01; unpaired Student’s t test at day 28 after injection. (D) Flow cytometry staining of surface F4/80 and CD115 expression in bone marrow mononuclear cells collected from Il-1r1fl/fl (left) or Il-1r1−/− (right) mice and cultured in M-CSF–containing medium for 7 d. Data are representative of three independent experiments. (E) Il1b mRNA expression (left) and IL-1β secretion (right) in macrophages generated ex vivo from Il-1r1fl/fl or Il-1r1−/− mice stimulated with 100 ng/ml LPS and 50 ng/ml IFN-γ for 24 h, assayed by RT-PCR and ELISA, respectively. Gene expression is shown as fold-change relative to expression in unstimulated macrophages (UT) as mean ± SEM from three independent experiments. ELISA data represent mean ± SEM from two independent experiments. (F) Sections from tumors isolated from Il-1r1fl/fl and Il-1r1−/− mice stained for IBA1 and SMA expression as indicated by the labels. Bars, 100 µm. Data are representative of three independent tumors.
Figure 3.
Figure 3.
Melanoma cells initiate an IL-1β signaling cascade that is propagated by macrophages. (A) Schematic of in vitro co-culture assay of melanoma cells, macrophages (Mφ), and fibroblasts. nAb, neutralizing antibody. (B) Morphology of untreated (UT) macrophages, M-CSF–treated macrophages (M-CSF-Mφ), and macrophages cultured in conditioned media (CM) taken from NHM (NHM-Mφ), WM266-4 (WM266-4–Mφ), WM164 (WM164-Mφ), and MM485 (MM485-Mφ) cells, after 7 d differentiation. Bars,100 µm. Images are representative of three independent experiments. (C, top) Representative Western blot analysis of IL-1β (precursor and mature) protein expression in UT-Mφ, M-CSF–Mφ, NHM-Mφ, WM266-4–Mφ, WM164-Mφ, and MM485-Mφ at 24 and 48 h after differentiation for 7 d. (Bottom) IL-1β secretion in these same macrophages treated at 24 and 48 h after differentiation, detected by ELISA. Data are represented as mean ± SEM from three independent experiments. **, P < 0.01; ***, P < 0.001; Dunn’s multiple comparisons test. Mel-CM–treated samples were compared collectively to controls. (D) Il1b mRNA expression (left) and IL-1β secretion (right) in macrophages generated ex vivo from Il-1r1fl/fl or Il-1r1−/− mice, stimulated with 3T3-conditioned media or 4434 Mel-CM for 24 h, assayed by RT-PCR and ELISA, respectively. *, P < 0.05; Mann-Whitney test; **, P < 0.01; unpaired Student’s t test. Gene expression is shown as fold-change relative to expression in unstimulated macrophages as mean ± SEM from three independent experiments. ELISA data represent mean ± SEM from three independent experiments.
Figure 4.
Figure 4.
The IL-1β signaling cascade is further propagated by fibroblasts. (A) Cytokine array analysis of the normal IMR90 human fibroblast secretome after retroviral transfection with an IL-1A–expressing plasmid. The top ten secreted cytokines are displayed relative to their level in the secretome of normal IMR90 human fibroblasts transfected with control vector. Values represent a mean of two independent experiments. (B) Western blot analysis of p65, pp65, IL-6, IL-8, and GROα expression in HFF cells treated with 100 ng/ml IL-1β for the stated time points. Data are representative of three independent experiments. (C) Western blot analysis of IL-6, IL-8, and GROα expression in HFF cells cultured in conditioned media (CM) taken from NHM macrophage (NHM-Mφ), WM266-4–Mφ, WM164-Mφ, and MM485-Mφ, with 1 µg/ml normal goat IgG control or 1 µg/ml IL-1β neutralizing antibody (IL1βnAb). Data are representative of three independent experiments. (D) Sections from tumors isolated from Il-1r1fl/fl and Il-1r1−/− mice stained for GROα and SMA expression as indicated by the labels. (iii) Arrowheads indicate cells that are clearly double stained. Bars: (i and ii)100 µm; (iii) 33 µm. Images are representative of three independent tumors. (E) Real-time qPCR analysis of Groα expression in tumors isolated from Il-1r1−/− mice (n = 3) relative to expression in tumors isolated from Il-1r1fl/fl mice (n = 3), at day 28 after injection. Data are represented as mean ± SEM. *, P < 0.05; Mann-Whitney test.
Figure 5.
Figure 5.
CXCR2 ligands are up-regulated in human melanomas. (A) Analysis of IL8 and GROα expression in normal skin and benign nevi samples (nonmalignant; n = 25) and cutaneous melanoma samples (malignant; n = 45) generated using an available gene expression dataset (Talantov et al., 2005) accessed through the Oncomine platform. (B) Real-time qPCR analysis of IL8 and GROα expression in stage-III and -IV melanoma tumor samples (n = 39) relative to expression in human skin samples (n = 8). (A and B) ***, P < 0.001; Mann-Whitney test. (C and D) Correlation of IL8 and IL1B (C) and GROα and IL1B (D) expression in cutaneous melanoma samples (n = 45) using an available gene expression dataset (Talantov et al., 2005) accessed through the Oncomine platform. Data are represented as a scatter plot with the regression line (blue) and the 95% confidence interval for the regression line (red dashed lines). (E) Representative sections from skin metastases of primary cutaneous melanoma stained for GROα and SMA expression as indicated by the labels. Bars: (i) 100 µm; (ii and iii) 33 µm.
Figure 6.
Figure 6.
The IL-1β signaling cascade is augmented by and confers tolerance to MAPK pathway inhibitors. (A) Real-time qPCR analysis of IL1A (left) and IL1B (right) expression in tumors from BRAFV600E-positive metastatic melanoma patients undergoing treatment with BRAFi alone or a BRAFi and MEKi combination (n = 10). Each line represents relative gene expression in an individual patient pretreatment and at 10–14 d on treatment, with error bars representing mean ± SD from three repeats. (B) Real-time qPCR analysis of Il1b expression in BrafV600E-4434 allografts from C57J/B6 mice treated with 25 mg/kg/d PD184352 (MEKi; n = 5) or vehicle (DMSO; n = 5) for 20 d. Unpaired Student’s t test was used. (C) Schematic of in vitro co-culture assay of melanoma cells and fibroblasts using conditioned media from IL-1β–stimulated fibroblasts in combination with MAPK signaling inhibitors (MAPKi). O/N, overnight. (D, top) Growth assay of A375 cells treated with 1% DMSO, 1 µM PLX4032 (BRAFi), or 0.5 µM both PLX4032 and selumetinib (MEKi), cultured in nonconditioned media or conditioned media taken from unstimulated fibroblasts or fibroblasts previously stimulated with IL-1β. UT, untreated. (Bottom) Representative Western blot analysis and quantification of pERK expression in A375 cells treated as just described, for 24 h. (E, top). Growth assay of A375 cells treated with 1% DMSO or 1 µM RAF265 (pan-RAFi), cultured in conditioned media as in D. (Bottom) Representative Western blot analysis of pERK expression in A375 cells treated as just described for 24 h. (D and E) Western blot data are representative of two independent experiments. (F) Growth assay of WM266-4 (left) and 4434 (right) cells treated as in D. (G) Growth assay of A375 (left) and WM266-4 (right) cells treated with 1% DMSO or 0.5 µM both PLX4032 and selumetinib, cultured in nonconditioned media or conditioned media taken from fibroblasts previously cultured in media taken from Mel-CM–treated macrophages supplemented with 1 µg/ml normal goat IgG control, 1 µg/ml IL-1β neutralizing antibody (IL1βnAb), or 1 µg/ml IL-1RA. (D–F) Data are represented as mean ± SEM from at least three independent experiments with a minimum of eight repeats. Tukey’s multiple comparisons test was used. (G) Data are represented as mean ± SEM from at least three independent experiments. Mann-Whitney test was used. For all growth assays, cells were treated for 48 h, and cell number was assayed by crystal violet staining. *, P < 0.05; ***, P < 0.001.
Figure 7.
Figure 7.
IL1-β–activated fibroblasts mediate tolerance to BRAF/MEK combination therapy through NF-κB and BCL2. (A) Growth assay of A375 treated with 1% DMSO or 0.5 µM both PLX4032 and selumetinib and 1 µM MK-2206 (AKTi), cultured in nonconditioned media or conditioned media taken from unstimulated fibroblasts or fibroblasts previously stimulated with IL-1β. UT, untreated. (B) Growth assay of WM266-4 (B) and 4434 (C) cells treated as in A. (A–C) *, P < 0.05; **, P < 0.01; ***, P < 0.001; Tukey’s multiple comparisons test. (D) Representative Western blot analysis and quantification of pp65 and BCL2 expression in A375 cells treated with 1% DMSO or 0.5 µM both PLX4032 and selumetinib cultured in conditioned media (CM) as in A for 24 h. Data are representative of two independent experiments. (E) Growth assay of A375 cells treated with 1% DMSO, 0.2 µM Bay 11-7082 (IKKi), 0.5 µM both PLX4032 and selumetinib or 0.5 µM both PLX4032 and selumetinib, and 0.2 µM Bay 11-7082, cultured in conditioned media as in A. (F) Growth assay of A375 cells as in E but with 0.2 µM obatoclax (BCL2i) instead. (E and F) **, P < 0.01; Tukey’s multiple comparisons test; ***, P < 0.001; unpaired Student’s t test. (A–C, E, and F) Data are represented as mean ± SEM from at least three independent experiments with a minimum of seven repeats. For all growth assays, cells were treated for 48 h, and cell number was assayed by crystal violet staining.
Figure 8.
Figure 8.
CXCR2 signaling confers tolerance to MAPK pathway inhibitors. (A) Growth of BrafV600E-4434 allografts in vehicle-treated Il-1r1fl/fl mice (n = 5), Il-1r1fl/fl mice treated with 25 mg/kg PD184352 (MEKi; n = 5), vehicle-treated Il-1r1−/− mice (n = 6), and Il-1r1−/− mice treated with 25 mg/kg PD184352 (n = 4). Data are represented as mean ± SEM. *, P < 0.05; ***, P < 0.001; Tukey’s multiple comparisons test at day 12 on treatment. (B) Real-time qPCR analysis of CXCR2 expression in A375 CXCR2KD cells relative to expression in A375 cells (n = 4). Data are represented as mean ± SEM. (C) Growth assay of A375 and A375 CXCR2KD cells treated with 1% DMSO or a combination of 0.5 µM both PLX4032 and selumetinib, cultured in nonconditioned media or conditioned media taken from unstimulated fibroblasts or fibroblasts previously stimulated with IL-1β for 48 h, detected by crystal violet staining. Data are represented as mean ± SEM from three independent experiments with nine repeats. ***, P < 0.05; unpaired Student’s t test. UT, untreated. (D) Real-time qPCR analysis of CXCR2, GROα, and IL8 expression in tumors from BRAFV600E-positive metastatic melanoma patients undergoing treatment with BRAFi alone or a BRAFi and MEKi combination (n = 10). Each line represents relative gene expression in an individual patient pretreatment and at 10–14 d on treatment, with error bars representing mean ± SD from three repeats. (E) Real-time qPCR analysis of Groα expression in BrafV600E-4434 allografts from C57J/B6 mice treated with 25 mg/kg/d PD184352 (n = 5) or vehicle (n = 5) for 20 d (left) and both human GROα (h-GROα) and mouse Groα (m-Groα) expression in A375 human melanoma xenografts implanted in nude mice treated with 10 mg/kg/d AZD6244 (MEKi; n = 5) or vehicle (n = 5) for 30 d (right). ***, P < 0.05; unpaired Student’s t test.
Figure 9.
Figure 9.
CXCR2 ligands protect melanoma cells from BRAF and MEK inhibition. (A and B) Drug dose–response analysis of A375 (A) and A375 CXCR2KD (B) cell survival in response to BRAFi and MEKi, in combination with 100 ng/ml IL-8, 100 ng/ml GROα, or 100 ng/ml IL-8 and GROα for 72 h, detected by crystal violet staining. (C) Drug dose–response analysis of A375 cell survival in response to BRAFi and MEKi, in combination with 100 ng/ml IL-1β for 72 h, detected by crystal violet staining. (D and E) Drug dose–response analysis of WM266-4 (D) and 4434 (E) cell survival in response to BRAFi and MEKi as in A. Data are represented as mean ± SEM from two independent experiments where each treatment was performed on samples in triplicate.
Figure 10.
Figure 10.
CXCR2i and MEKi synergizes in vivo to effectively reduce tumor growth. (A–C) Growth assay of A375 (A), WM266-4 (B), and 4434 (C) cells treated with 1% DMSO, 0.5 µM SB225002 (CXCR2i), 0.5 µM both PLX4032 and selumetinib (BRAFi + MEKi), or 0.5 µM BRAFi, MEKi, and CXCR2i, cultured in nonconditioned media or conditioned media taken from unstimulated fibroblasts or fibroblasts previously stimulated with IL-1β for 48 h, detected by crystal violet staining. Data are represented as mean ± SEM from three independent experiments (A) or two independent experiments (B and C), with a minimum of five repeats. *, P < 0.05; **, P < 0.01; ***, P < 0.001; unpaired Student’s t test. UT, untreated. (D) Representative Western blot analysis and quantification of pp65 and BCL2 expression in A375 cells treated with 1% DMSO or 0.5 µM SB225002 (CXCR2i) cultured in conditioned media (CM) as in A for 24 h. (E) Growth of BrafV600E-4434 allografts in vehicle-treated C57J/B6 mice (n = 8), mice treated with 25 mg/kg PD184352 (MEKi; n = 8), mice treated with 30 mg/kg sch-527123 (CXCR2i; n = 5), and mice treated with 25 mg/kg PD184352 and 30 mg/kg sch-527123 (n = 5). Data are represented as mean ± SEM. ***, P < 0.001; Tukey’s multiple comparisons test at day 14 on treatment. (F) Model of cross talk among melanoma cells, macrophages, and fibroblasts located in inflammatory niches in melanoma tumors, which leads to survival in the presence of MAPK signaling inhibitors.

References

    1. Abdulaal W.H., Walker C.R., Costello R., Redondo-Castro E., Mufazalov I.A., Papaemmanouil A., Rothwell N.J., Allan S.M., Waisman A., Pinteaux E., and Müller W.. 2016. Characterization of a conditional interleukin-1 receptor 1 mouse mutant using the Cre/LoxP system. Eur. J. Immunol. 46:912–918. 10.1002/eji.201546075 - DOI - PMC - PubMed
    1. Acharyya S., Oskarsson T., Vanharanta S., Malladi S., Kim J., Morris P.G., Manova-Todorova K., Leversha M., Hogg N., Seshan V.E., et al. 2012. A CXCL1 paracrine network links cancer chemoresistance and metastasis. Cell. 150:165–178. 10.1016/j.cell.2012.04.042 - DOI - PMC - PubMed
    1. Acosta J.C., O’Loghlen A., Banito A., Guijarro M.V., Augert A., Raguz S., Fumagalli M., Da Costa M., Brown C., Popov N., et al. 2008. Chemokine signaling via the CXCR2 receptor reinforces senescence. Cell. 133:1006–1018. 10.1016/j.cell.2008.03.038 - DOI - PubMed
    1. Acosta J.C., Banito A., Wuestefeld T., Georgilis A., Janich P., Morton J.P., Athineos D., Kang T.W., Lasitschka F., Andrulis M., et al. 2013. A complex secretory program orchestrated by the inflammasome controls paracrine senescence. Nat. Cell Biol. 15:978–990. 10.1038/ncb2784 - DOI - PMC - PubMed
    1. Balch C.M., Gershenwald J.E., Soong S.J., Thompson J.F., Atkins M.B., Byrd D.R., Buzaid A.C., Cochran A.J., Coit D.G., Ding S., et al. 2009. Final version of 2009 AJCC melanoma staging and classification. J. Clin. Oncol. 27:6199–6206. 10.1200/JCO.2009.23.4799 - DOI - PMC - PubMed

Publication types

MeSH terms