

Identification and validation of distinct biological phenotypes in patients with acute respiratory distress syndrome by cluster analysis
- PMID: 28450529
- PMCID: PMC5964254
- DOI: 10.1136/thoraxjnl-2016-209719
Identification and validation of distinct biological phenotypes in patients with acute respiratory distress syndrome by cluster analysis
Abstract
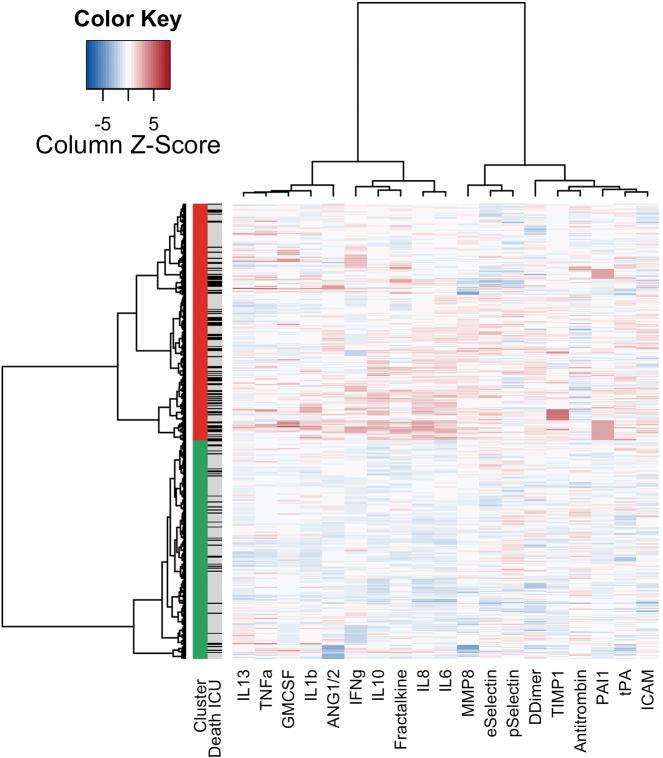
Rationale: We hypothesised that patients with acute respiratory distress syndrome (ARDS) can be clustered based on concentrations of plasma biomarkers and that the thereby identified biological phenotypes are associated with mortality.
Methods: Consecutive patients with ARDS were included in this prospective observational cohort study. Cluster analysis of 20 biomarkers of inflammation, coagulation and endothelial activation provided the phenotypes in a training cohort, not taking any outcome data into account. Logistic regression with backward selection was used to select the most predictive biomarkers, and these predicted phenotypes were validated in a separate cohort. Multivariable logistic regression was used to quantify the independent association with mortality.
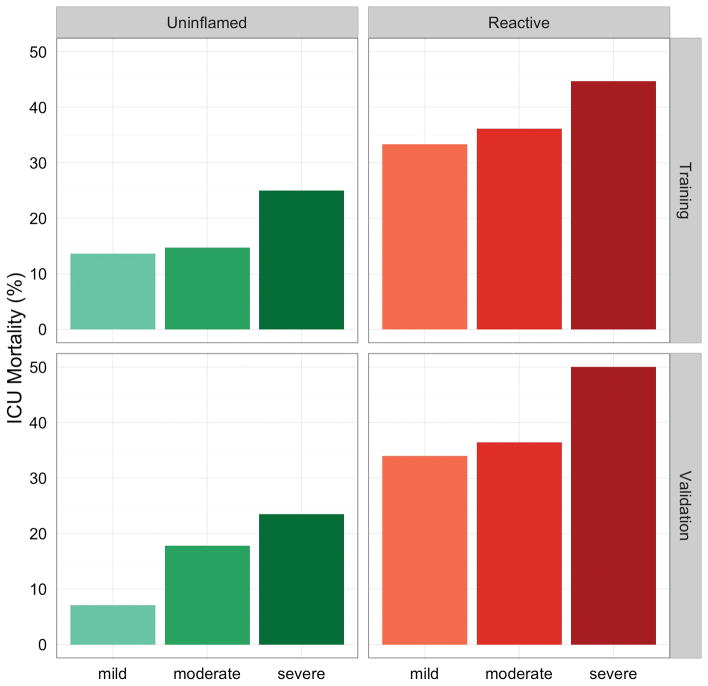
Results: Two phenotypes were identified in 454 patients, which we named 'uninflamed' (N=218) and 'reactive' (N=236). A selection of four biomarkers (interleukin-6, interferon gamma, angiopoietin 1/2 and plasminogen activator inhibitor-1) could be used to accurately predict the phenotype in the training cohort (area under the receiver operating characteristics curve: 0.98, 95% CI 0.97 to 0.99). Mortality rates were 15.6% and 36.4% (p<0.001) in the training cohort and 13.6% and 37.5% (p<0.001) in the validation cohort (N=207). The 'reactive phenotype' was independent from confounders associated with intensive care unit mortality (training cohort: OR 1.13, 95% CI 1.04 to 1.23; validation cohort: OR 1.18, 95% CI 1.06 to 1.31).
Conclusions: Patients with ARDS can be clustered into two biological phenotypes, with different mortality rates. Four biomarkers can be used to predict the phenotype with high accuracy. The phenotypes were very similar to those found in cohorts derived from randomised controlled trials, and these results may improve patient selection for future clinical trials targeting host response in patients with ARDS.
Keywords: ARDS; Cytokine Biology.
Published by the BMJ Publishing Group Limited. For permission to use (where not already granted under a licence) please go to http://www.bmj.com/company/products-services/rights-and-licensing/.
Conflict of interest statement
Competing interests: CC was supported by the NIH (HL133390 and HL131621).
Figures

Comment in
-
Divide and conquer: identifying acute respiratory distress syndrome subphenotypes.Thorax. 2017 Oct;72(10):867-869. doi: 10.1136/thoraxjnl-2017-210422. Epub 2017 Jul 17. Thorax. 2017. PMID: 28717034 No abstract available.
-
Identification of Biological Phenotypes in Acute Respiratory Distress Syndrome. From Biomarkers to Clinical Outcome.Am J Respir Crit Care Med. 2018 May 1;197(9):1209-1211. doi: 10.1164/rccm.201708-1713RR. Am J Respir Crit Care Med. 2018. PMID: 29406790 No abstract available.
References
-
- Rubenfeld GD, Caldwell E, Peabody E, et al. Incidence and outcomes of acute lung injury. N Engl J Med. 2005;353:1685–93. - PubMed
Publication types
MeSH terms
Substances
Grants and funding
LinkOut - more resources
Full Text Sources
Other Literature Sources