Responses to Hypoxia and Endoplasmic Reticulum Stress Discriminate the Development of Vitreous and Floury Endosperms of Conventional Maize (Zea mays) Inbred Lines
- PMID: 28450877
- PMCID: PMC5390489
- DOI: 10.3389/fpls.2017.00557
Responses to Hypoxia and Endoplasmic Reticulum Stress Discriminate the Development of Vitreous and Floury Endosperms of Conventional Maize (Zea mays) Inbred Lines
Abstract
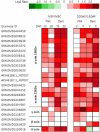
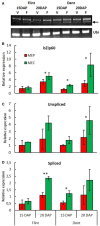
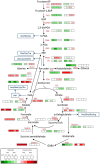
Major nutritional and agronomical issues relating to maize (Zea mays) grains depend on the vitreousness/hardness of its endosperm. To identify the corresponding molecular and cellular mechanisms, most studies have been conducted on opaque/floury mutants, and recently on Quality Protein Maize, a reversion of an opaque2 mutation by modifier genes. These mutant lines are far from conventional maize crops. Therefore, a dent and a flint inbred line were chosen for analysis of the transcriptome, amino acid, and sugar metabolites of developing central and peripheral endosperm that is, the forthcoming floury and vitreous regions of mature seeds, respectively. The results suggested that the formation of endosperm vitreousness is clearly associated with significant differences in the responses of the endosperm to hypoxia and endoplasmic reticulum stress. This occurs through a coordinated regulation of energy metabolism and storage protein (i.e., zein) biosynthesis during the grain-filling period. Indeed, genes involved in the glycolysis and tricarboxylic acid cycle are up-regulated in the periphery, while genes involved in alanine, sorbitol, and fermentative metabolisms are up-regulated in the endosperm center. This spatial metabolic regulation allows the production of ATP needed for the significant zein synthesis that occurs at the endosperm periphery; this finding agrees with the zein-decreasing gradient previously observed from the sub-aleurone layer to the endosperm center. The massive synthesis of proteins transiting through endoplasmic reticulum elicits the unfolded protein responses, as indicated by the splicing of bZip60 transcription factor. This splicing is relatively higher at the center of the endosperm than at its periphery. The biological responses associated with this developmental stress, which control the starch/protein balance, leading ultimately to the formation of the vitreous and floury regions of mature endosperm, are discussed.
Keywords: endosperm; hypoxia; maize; transcriptome; unfolded protein response (UPR); vitreousness.
Figures


Similar articles
-
Lipid partitioning in maize (Zea mays L.) endosperm highlights relationships among starch lipids, amylose, and vitreousness.J Agric Food Chem. 2015 Apr 8;63(13):3551-8. doi: 10.1021/acs.jafc.5b00293. Epub 2015 Mar 27. J Agric Food Chem. 2015. PMID: 25794198
-
Physicochemical properties of starches from vitreous and floury endosperms from the same maize kernels.Food Chem. 2019 Sep 1;291:149-156. doi: 10.1016/j.foodchem.2019.04.024. Epub 2019 Apr 6. Food Chem. 2019. PMID: 31006453
-
opaque-2 modifiers increase gamma-zein synthesis and alter its spatial distribution in maize endosperm.Plant Cell. 1991 Nov;3(11):1207-19. doi: 10.1105/tpc.3.11.1207. Plant Cell. 1991. PMID: 1821766 Free PMC article.
-
Maize opaque mutants are no longer so opaque.Plant Reprod. 2018 Sep;31(3):319-326. doi: 10.1007/s00497-018-0344-3. Epub 2018 Jul 5. Plant Reprod. 2018. PMID: 29978299 Free PMC article. Review.
-
Recent advances in the study of prolamin storage protein organization and function.Front Plant Sci. 2014 Jun 20;5:276. doi: 10.3389/fpls.2014.00276. eCollection 2014. Front Plant Sci. 2014. PMID: 24999346 Free PMC article. Review.
Cited by
-
Two γ-zeins induce the unfolded protein response.Plant Physiol. 2021 Nov 3;187(3):1428-1444. doi: 10.1093/plphys/kiab367. Plant Physiol. 2021. PMID: 34618077 Free PMC article.
-
Advances in seed hypoxia research.Plant Physiol. 2024 Dec 23;197(1):kiae556. doi: 10.1093/plphys/kiae556. Plant Physiol. 2024. PMID: 39471319 Free PMC article.
-
HetFCM: functional co-module discovery by heterogeneous network co-clustering.Nucleic Acids Res. 2024 Feb 9;52(3):e16. doi: 10.1093/nar/gkad1174. Nucleic Acids Res. 2024. PMID: 38088228 Free PMC article.
-
Autophagy in crop plants: what's new beyond Arabidopsis?Open Biol. 2018 Dec 5;8(12):180162. doi: 10.1098/rsob.180162. Open Biol. 2018. PMID: 30518637 Free PMC article. Review.
-
Is hypoxia good or bad? Role of oxygen levels in maize kernel development.Plant Physiol. 2023 May 31;192(2):694-696. doi: 10.1093/plphys/kiad146. Plant Physiol. 2023. PMID: 36879439 Free PMC article. No abstract available.
References
-
- Chourey P. S., Taliercio E. W., Carlson S. J., Ruan Y. L. (1998). Genetic evidence that the two isozymes of sucrose synthase present in developing maize endosperm are critical, one for cell wall integrity and the other for starch biosynthesis. Mol. Gen. Genet. 259, 88–96. - PubMed
LinkOut - more resources
Full Text Sources
Other Literature Sources

