. 2017 Feb 1;8(2):1134-1140.
doi: 10.1039/c6sc03856e. Epub 2016 Sep 26.

Reversible ratiometric detection of highly reactive hydropersulfides using a FRET-based dual emission fluorescent probe

Affiliations

Reversible ratiometric detection of highly reactive hydropersulfides using a FRET-based dual emission fluorescent probe

Ryosuke Kawagoe et al. Chem Sci. .

Abstract

Hydropersulfide (R-SSH) is an important class of reactive sulfur species (RSS) involved in a variety of physiological processes in mammals. A fluorescent probe capable of real-time detection of hydropersulfide levels in living cells would be a versatile tool to elucidate its roles in cell signalling and redox homeostasis. In this paper, we report a ratiometric fluorescent probe for hydropersulfide sensing, based on a fluorescence resonance energy transfer (FRET) mechanism. This sensing mechanism involves a nucleophilic reaction of a hydropersulfide with the pyronine-unit of the probe, which modulates the intramolecular FRET efficiency to induce a dual-emission change. The reversible nature of this reaction allows us to detect increases and decreases of hydropersulfide levels in a real-time manner. The probe fluorometrically sensed highly reactive hydropersulfides, such as H2S2 and Cys-SSH, while the fluorescence response to biologically abundant cysteine and glutathione was negligible. Taking advantage of the reversible and selective sensing properties, this probe was successfully applied to the ratiometric imaging of concentration dynamics of endogenously produced hydropersulfides in living cells.


Figures
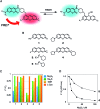
Fig. 1
Fig. 1. (A) Mechanism of the FRET-based ratiometric fluorescence sensing of hydropersulfide. (B) Structure of the xanthene derivatives. (C) Fluorescence quenching efficiency (F/F 0) of 1–5 upon addition of Na2S2 (50 μM), Na2S (50 μM), GSH (5 mM), and l-Cys (1 mM). The data were measured 10 min after addition of the thiol compounds. Measurement conditions: [probe] = 5 μM in 50 mM HEPES, 10 mM NaCl, 1 mM MgSO4, pH 7.4, 25 °C. λ ex = 480 nm (1), 500 nm (2), 530 nm (3, 4, 5). (D) Fluorescence titration profile of 4 (■) and 5 () upon addition of Na2S2 (0–100 μM). Measurement conditions: [probe] = 5 μM in 50 mM HEPES, 10 mM NaCl, 1 mM MgSO4, pH 7.4, 25 °C. λ ex = 530 nm.
Fig. 2
Fig. 2. (A) Structures of probe 6 and 6-AM. (B and C) Absorption and fluorescence spectral changes of 6 (5 μM) upon addition of Na2S2 (0–100 μM). Measurement conditions: [6] = 5 μM in 50 mM HEPES, 10 mM NaCl, 1 mM MgSO4, 0.4% Tween, pH 7.4, 25 °C. λ ex = 410 nm. (D) Time-dependent change of the ratio value (R = F 479 nm/F 584 nm) of 6 (5 μM) upon addition of Na2S2 (0–30 μM). Na2S2 was added at 30 s, as indicated by the arrow. Measurement conditions: [6] = 5 μM in 50 mM HEPES, 10 mM NaCl, 1 mM MgSO4, 0.4% Tween, pH 7.4, 25 °C. λ ex = 410 nm. n = 3. (E) Plot of the ratio value R (F 479 nm/F 584 nm) 600 s after addition of Na2S2 (0–30 μM).
Scheme 1
Scheme 1. Synthesis of probe 6.
Fig. 3
Fig. 3. (A) The ratio value (R = F 479 nm/F 584 nm) of 6 in the presence of various thiol species: (1) none, (2) Na2S (50 μM), (3) Na2S2 (50 μM), (4) Na2S4 (50 μM), (5) CysSSH (NOC7 (50 μM) + Na2S (50 μM) + l-Cys (50 μM)), (6) GSSH (NOC7 (50 μM) + Na2S (50 μM) + GSH (50 μM)), (7) mixture of NaOCl (50 μM) and Na2S (50 μM) in 0.1 M NaOH, (8) mixture of NaOCl (50 μM) and Na2S (50 μM) in 50 mM HEPES buffer (pH 7.4), (9) GSH (5 mM), (10) l-Cys (1 mM), (11) cystine (0.5 mM). Measurement conditions: [6] = 5 μM in 50 mM HEPES, 10 mM NaCl, 1 mM MgSO4, 0.4% Tween, pH 7.4, 25 °C. λ ex = 410 nm. n = 3. (B) Change in the fluorescence intensity ratio of 6 (5 μM) upon addition of Na2S2 (0–100 μM, ■) and Na2S (0–100 μM, ). n = 3. (C) Time-trace plot of the ratio value (R = F 479 nm/F 584 nm) of 6 (5 μM) upon addition of Na2S2 (30 μM at 30, 300, and 600 s) and N-ethylmaleimide (NEM, 500 μM at 900 s), n = 3. (D) The reverse change of the ratio value (R = F 479 nm/F 584 nm) of 6 induced by the reactive species. Each bar represents R value of: (1) 6 (5 μM), (2) the hydropersulfide adduct of 6 (5 μM) with Na2S2 (50 μM), (3) the adduct + NaOCl (100 μM), (4) the adduct + NEM (200 μM), (5) the adduct + GSH (5 mM), and (6) the adduct + l-Cys (1 mM). Measurement conditions: 50 mM HEPES, 10 mM NaCl, 1 mM MgSO4, 0.4% Tween, pH 7.4, 25 °C. λ ex = 410 nm. n = 3; *P < 0.05, **P < 0.01 vs. hydropersulfide adduct of 6 with Na2S2 (lane 2).
Fig. 4
Fig. 4. (A) Fluorescence images of A549 cells treated with 6-AM (5 μM). (a) F 430–480, (b) F 550–630, (c) DIC, and (d) ratio image (R = F 430–480/F 550–630). (e and f) Ratio image after 30 min in the presence and absence of Na2S2 (5 μM), (g and h) ratio image after 15 min in the presence Na2S2 (5 μM) and subsequent treatment with NEM (100 μM) for 15 min. Scale bar: 30 μm. (B) Ratio value change of A549 cells upon the addition of various concentrations of Na2S2 (0–5 μM), n = 6. (C) Time trace plot of the ratio value in A549 cells upon the treatment with Na2S2 (5 μM) (red square, n = 6), Na2S2 (5 μM) and the subsequent addition of NEM (100 μM) at 15 min (blue circle, n = 4), without Na2S2 and NEM (green diamond, n = 6).
Fig. 5
Fig. 5. Ratiometric detection of endogenously produced hydropersulfide in A549 cells. (A) Production and degradation pathways of hydropersulfides in cells. (B) Ratio images of A549 cells treated with 6-AM (5 μM) (a) before addition of cystine, (b) 30 min after addition of cystine (200 μM), (c) 30 min after addition of cystine (200 μM) in the presence of AOAA (1 mM). (C) Time trace plot of the ratio value (R = F 430–480/F 550–630) change in A549 cells upon treatment with cystine (200 μM) in the absence (red circle, n = 6) and presence of AOAA (1 mM) (blue square, n = 6). (D) Comparison of the ratio value R change in A549 cells upon treatment with cysteine for 30 min: (1) control (without cystine), n = 6, (2) cystine (200 μM), n = 6, (3) cystine (200 μM) in the presence of AOAA (1 mM), n = 4, (4) cystine (200 μM) in the presence of auranofin (2 μM), n = 3. (E) Ratio images of A549 cells treated with 6-AM (5 μM) (a) before addition of l-cysteine, (b) 30 min after addition of l-cysteine (200 μM), (c) 30 min after addition of l-cystine (200 μM) in the presence of AOAA (1 mM). (F) Time trace plot of the ratio value R change in A549 cells upon treatment with l-cysteine (200 μM) in the absence (red circle, n = 3) and presence of AOAA (1 mM) (blue square, n = 3). (G) Comparison of the ratio value R change in A549 cells upon treatment with l-cysteine for 30 min; (1) control (without cysteine), n = 6, (2) l-cysteine (200 μM), n = 4, (3) l-cysteine (200 μM) in the presence of AOAA (1 mM), n = 3, (4) l-cysteine (200 μM) in the presence of auranofin (2 μM), n = 5. (H) Time trace plot of the ratio value R change in A549 cells upon treatment with l-cysteine (200 μM) (red square, n = 3) and upon treatment with l-cysteine (200 μM) and NaOCl (300 μM) (blue circle, n = 3). NaOCl was added 15 min after addition of l-cysteine. Conditions: λ ex = 405 nm, R = F 430–480/F 550–630 nm. Scale bar: 30 μm. *P < 0.05, **P < 0.01.

References

    1. Ida T., Sawa T., Ihara H., Tsuchiya Y., Watanabe Y., Kumagai Y., Suematsu M., Motohashi H., Fujii S., Matsunaga T., Yamamoto M., Ono K., Devarie-Baez N. O., Xian M., Fukuto J. M., Akaike T. Proc. Natl. Acad. Sci. U. S. A. 2014;111:7606–7611. - PMC - PubMed
    1. Paul B. D., Snyder S. H. Nat. Rev. Mol. Cell Biol. 2012;13:499–507. - PubMed
    1. Paulsen C. E., Carroll K. S. Chem. Rev. 2013;113:4633–4679. - PMC - PubMed
    1. Mishanina T. V., Libiad M., Banerjee R. Nat. Chem. Biol. 2015;11:457–464. - PMC - PubMed
    1. Mustafa A. K., Gadalla M. M., Sen N., Kim S., Mu W., Gazi S. K., Barrow R. K., Yang G., Wang R., Snyder S. H. Sci. Signaling. 2009;2:ra72. - PMC - PubMed

LinkOut - more resources