. 2017 Mar 1;4(1):ENEURO.0007-17.2017.
doi: 10.1523/ENEURO.0007-17.2017. eCollection 2017 Jan-Feb.

Hearing Scenes: A Neuromagnetic Signature of Auditory Source and Reverberant Space Separation

Affiliations

Hearing Scenes: A Neuromagnetic Signature of Auditory Source and Reverberant Space Separation

Santani Teng et al. eNeuro. .

Abstract

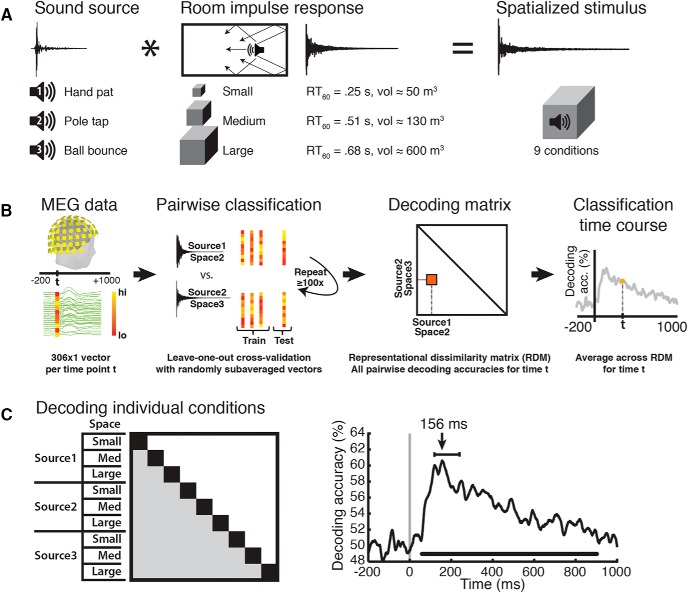
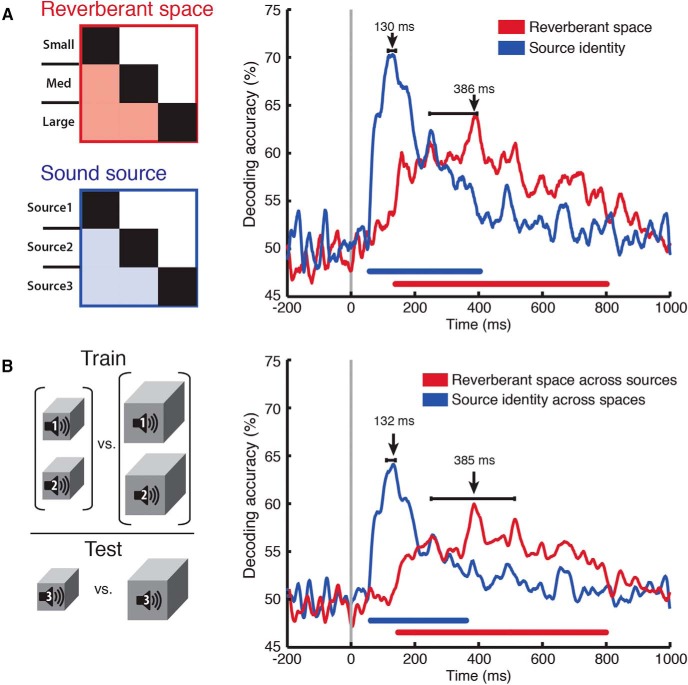
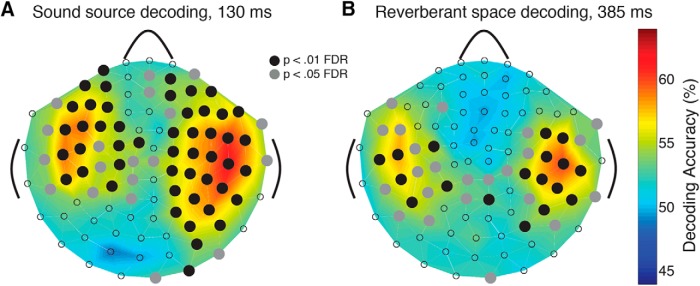
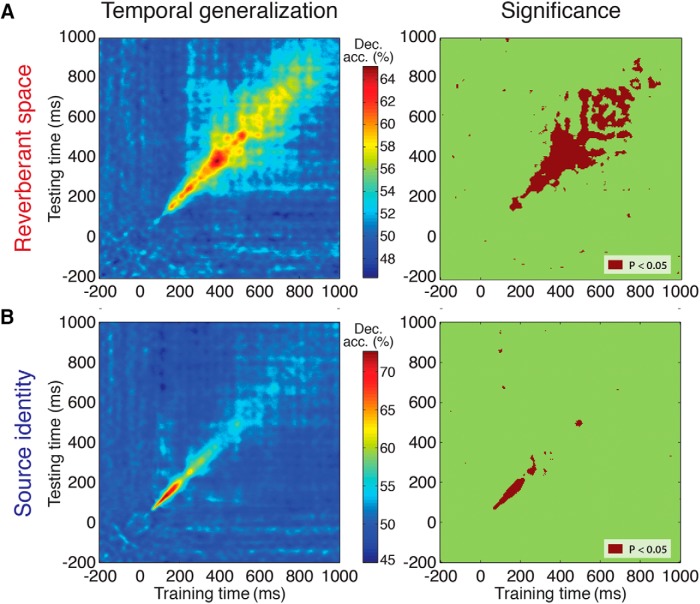
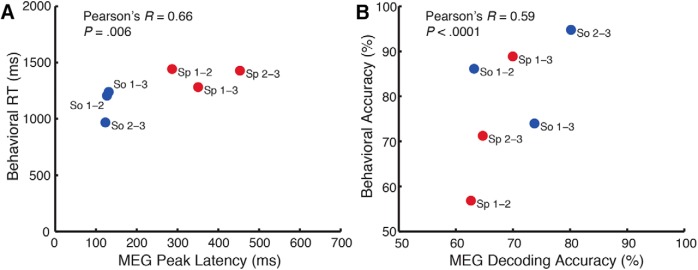
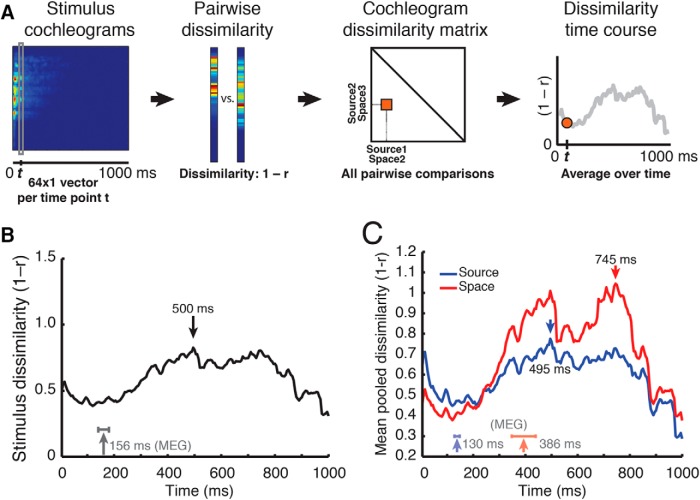
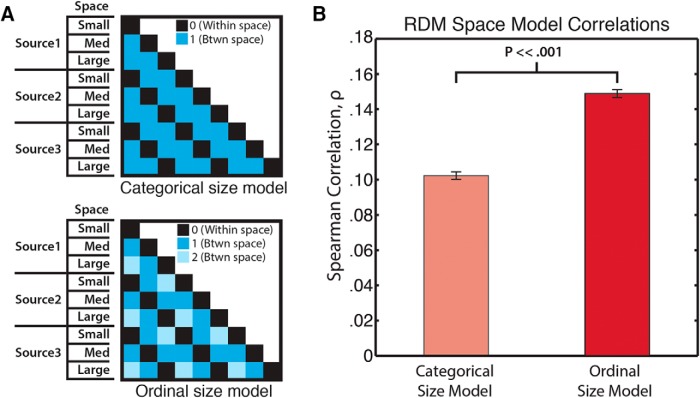
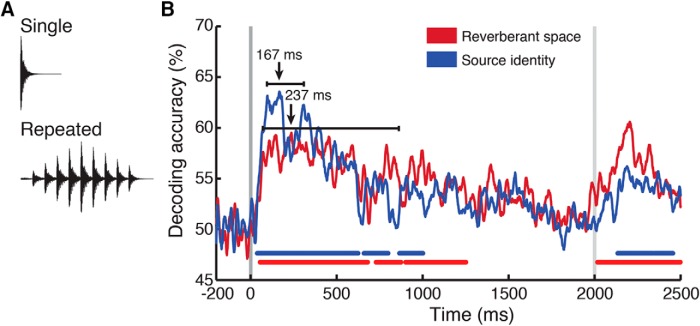
Perceiving the geometry of surrounding space is a multisensory process, crucial to contextualizing object perception and guiding navigation behavior. Humans can make judgments about surrounding spaces from reverberation cues, caused by sounds reflecting off multiple interior surfaces. However, it remains unclear how the brain represents reverberant spaces separately from sound sources. Here, we report separable neural signatures of auditory space and source perception during magnetoencephalography (MEG) recording as subjects listened to brief sounds convolved with monaural room impulse responses (RIRs). The decoding signature of sound sources began at 57 ms after stimulus onset and peaked at 130 ms, while space decoding started at 138 ms and peaked at 386 ms. Importantly, these neuromagnetic responses were readily dissociable in form and time: while sound source decoding exhibited an early and transient response, the neural signature of space was sustained and independent of the original source that produced it. The reverberant space response was robust to variations in sound source, and vice versa, indicating a generalized response not tied to specific source-space combinations. These results provide the first neuromagnetic evidence for robust, dissociable auditory source and reverberant space representations in the human brain and reveal the temporal dynamics of how auditory scene analysis extracts percepts from complex naturalistic auditory signals.

Keywords: audition; auditory scene analysis; magnetoencephalography; multivariate pattern analysis; reverberation.


Figures

Figure 1.
Figure 1.
Stimulus conditions, MEG classification scheme, and single-sound decoding time course. A, Stimulus design. Three brief sounds were convolved with three different RIRs to produce nine sound sources spatialized in reverberant environments. B, MEG pattern vectors were used to train an SVM classifier to discriminate every pair of stimulus conditions (three sound sources in three different space sizes each). Decoding accuracies across every pair of conditions were arranged in 9 × 9 decoding matrices, one per time point t. C, Averaging across all condition pairs (shaded matrix partition) for each time point t resulted in a single-sound decoding time course. Lines below time course indicates significant time points (N = 14, cluster-definition threshold, p < 0.05, 1000 permutations). Decoding peaked at 156 ms; error bars represent 95% CI.
Figure 2.
Figure 2.
Separable space and source identity decoding. A, Individual conditions were pooled across source identity (left, top) or space size (left, bottom) in separate analyses. Classification analysis was then performed on the orthogonal stimulus dimension to establish the time course with which the brain discriminated between space (red) and source identity (blue). Sound-source classification peaked at 130 ms, while space classification peaked at 386 ms. Significance indicators and latency error bars on plots same as in Figure 1. B, Space was classified across sound sources and vice versa. Left panel, Cross-classification example in which a classifier was trained to discriminate between spaces on sound sources 1 and 2, then tested on space discrimination on source 3. Right panel, Sound-source cross-classification example in which a classifier was trained to discriminate between sound sources on space sizes 1 and 2, then tested on sound-source discrimination on space 3. B, Results from all nine such pairwise train-test combinations were averaged to produce a classification time course in which the train and test conditions contained different experimental factors. Sound-source cross-classification peaked at 132 ms, while space cross-classification peaked at 385 ms. Significance bars below time courses and latency error bars same as in Figure 1.
Figure 3.
Figure 3.
Sensorwise decoding of source identity and space size. MEG decoding time courses were computed separately for 102 sensor locations yielding decoding sensor maps. A, Sensor map of sound source decoding at the peak of the effect (130 ms). B, Sensor map of space size decoding at the peak of the effect (386 ms). Significant decoding is indicated with a black circle over the sensor position (p < 0.01; corrected for false discovery rate (FDR) across sensors and time).
Figure 4.
Figure 4.
Temporal generalization matrix of auditory source and space decoding time courses. Left column shows the generalized decoding profiles of space (A) and source (B) decoding. Right column shows the statistically significant results (t test against 50%, p < 0.05, FDR corrected).
Figure 5.
Figure 5.
Behavior correlates with MEG decoding data. Assessment of linear relationships between response times and MEG peak decoding latencies (A), as well as behavioral and decoding accuracies (B). Bootstrapping the participant sample (N = 14, p < 0.05) 10,000 times revealed significant correlations between RT and latency (r = 0.66, p = 0.0060) and behavioral and decoding accuracy (r = 0.59, p < 0.0001). Individual condition pairs are denoted by source (So; red) or space (Sp; blue) labels, with numerals indicating which conditions were compared. For space conditions: 1, small; 2, medium; 3, large. For source conditions: 1, hand pat; 2, pole tap; 3, ball bounce.
Figure 6.
Figure 6.
Stimulus dissimilarity analysis based on cochleogram data. A, Cochleograms were generated for each stimulus, discretized into 200 5-ms bins and 64 frequency subbands. Each cochleogram thus comprised 200 64 × 1 pattern vectors. For each pair of stimuli, pattern vectors across frequency subbands were correlated at corresponding time points and subtracted from 1. B, Overall cochleogram-based dissimilarity. The final dissimilarity value at time t is an average of all pairwise correlations at that time point. Peak overall cochleogram dissimilarity occurred at 500 ms; peak MEG dissimilarity (decoding accuracy) is shown for comparison. C, Pooled cochleogram-based dissimilarity across space size and source identity. Pairwise correlations were performed and averaged analogously to pooled decoding analysis. MEG pooled decoding peaks for source identity and space size are shown for reference; corresponding stimulus dissimilarity peaks were significantly offset (p < 0.05 for both source identity and space).
Figure 7.
Figure 7.
Comparison of MEG neural representations to a categorical versus an ordinal scene size model. Representational dissimilarity matrices (RDMs) of a categorical and an ordinal model (A) were correlated with the MEG data from 138–801 ms (the temporal window of significant space size decoding) to assess the nature of MEG scene size representations. B, Results indicate the MEG representations have significantly higher correlation with the ordinal than the categorical scene size model. Spearman correlation coefficients ρ were averaged across time points in the temporal window. Error bars represent ±SEM.
Figure 8.
Figure 8.
Space and sound source decoding with repetition-window stimuli. A, Representative waveforms of single and repeated stimuli. Repeated stimuli were produced by concatenation of anechoic stimuli, followed by RIR convolution and linear amplitude ramping. B, Source (blue) and space (red) decoding. Sound-source classification peaked at 167 (96-312) ms, while space classification peaked at 237 (71-790) ms. Color-coded lines below time courses indicate significant time points, as in experiment 1; latency error bars indicate bootstrapped confidence intervals as in experiment 1. Gray vertical lines indicate stimulus onset and approximate offset.

References

    1. Ahveninen J, Huang S, Nummenmaa A, Belliveau JW, Hung A-Y, Jääskeläinen IP, Rauschecker JP, Rossi S, Tiitinen H, Raij T (2013) Evidence for distinct human auditory cortex regions for sound location versus identity processing. Nat Commun 4:2585. 10.1038/ncomms3585 - DOI - PMC - PubMed
    1. Ahveninen J, Jääskeläinen IP, Raij T, Bonmassar G, Devore S, Hämäläinen M, Levänen S, Lin F-H, Sams M, Shinn-Cunningham BG, Witzel T, Belliveau JW (2006) Task-modulated "what" and "where" pathways in human auditory cortex. Proc Natl Acad Sci USA 103:14608–14613. 10.1073/pnas.0510480103 - DOI - PMC - PubMed
    1. Alain C, Arnott SR, Hevenor S, Graham S, Grady CL (2001) "What" and "where" in the human auditory system. Proc Natl Acad Sci USA 98:12301–12306. 10.1073/pnas.211209098 - DOI - PMC - PubMed
    1. Arnott SR, Binns MA, Grady CL, Alain C (2004) Assessing the auditory dual-pathway model in humans. Neuroimage 22:401–408. 10.1016/j.neuroimage.2004.01.014 - DOI - PubMed
    1. Berkley DA, Allen JB (1993) Normal listening in typical rooms: the physical and psychophysical correlates of reverberation In: Acoustical factors affecting hearing aid performance (Studebaker GA, Hockberg I, eds), pp 3–14. Boston: Allyn and Bacon.

LinkOut - more resources