. 2017 Apr 21;4(2):ENEURO.0241-16.2017.
doi: 10.1523/ENEURO.0241-16.2017. eCollection 2017 Mar-Apr.

Cortical Activation Patterns Evoked by Temporally Asymmetric Sounds and Their Modulation by Learning

Affiliations

Cortical Activation Patterns Evoked by Temporally Asymmetric Sounds and Their Modulation by Learning

Junsei Horikawa et al. eNeuro. .

Erratum in

Abstract

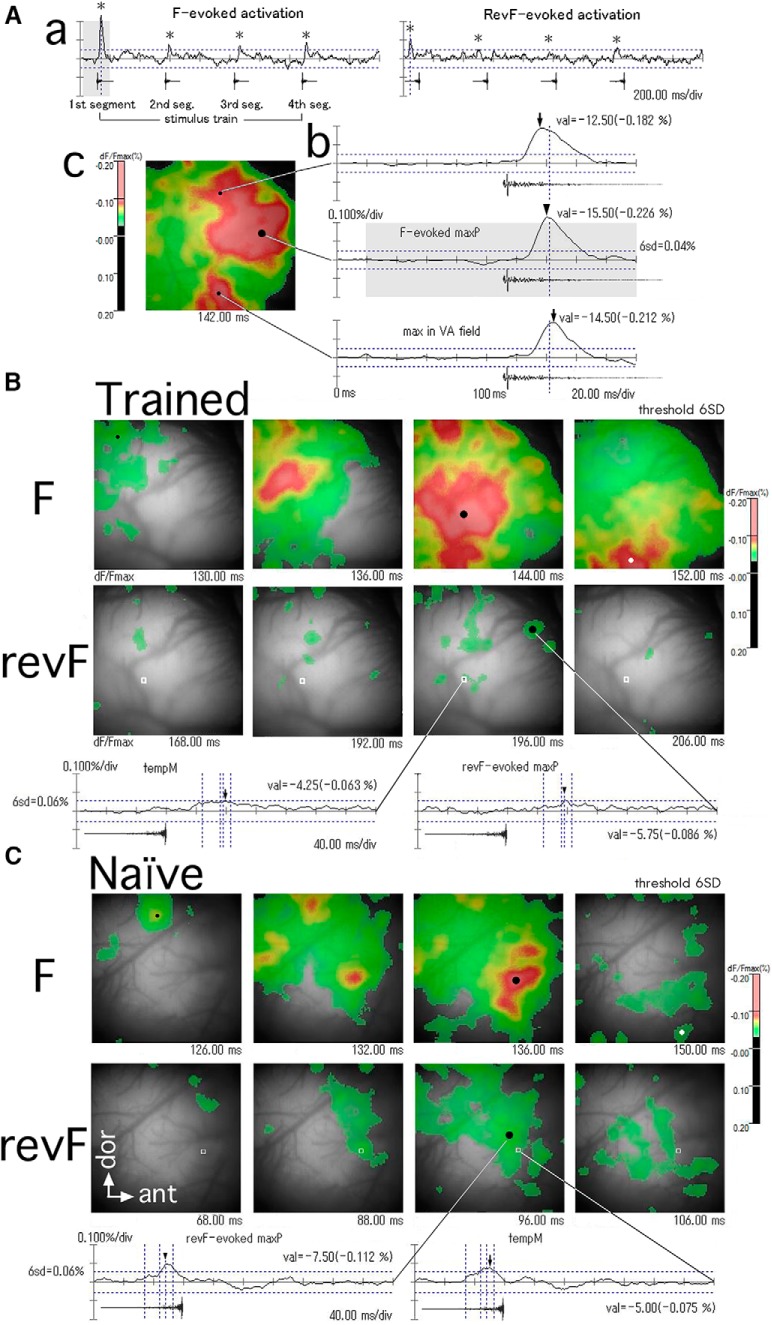
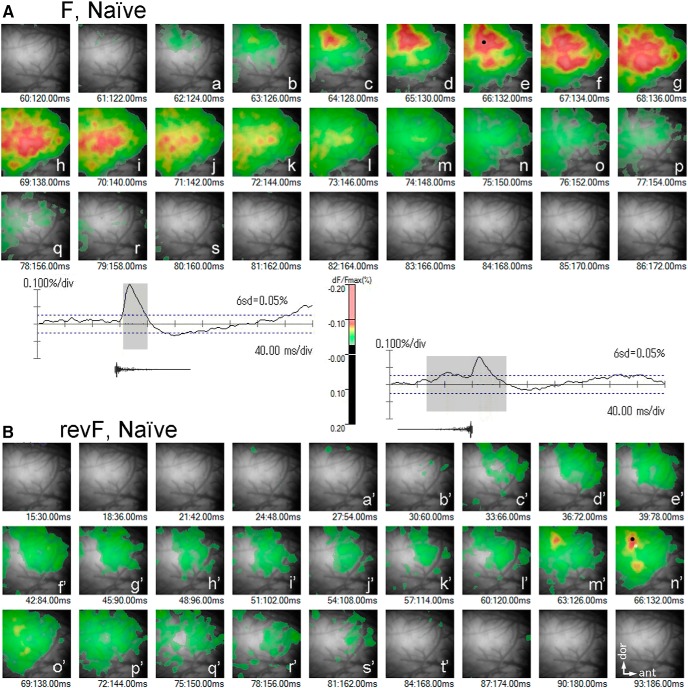
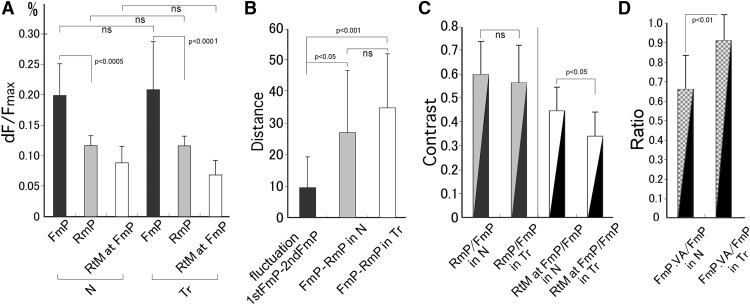
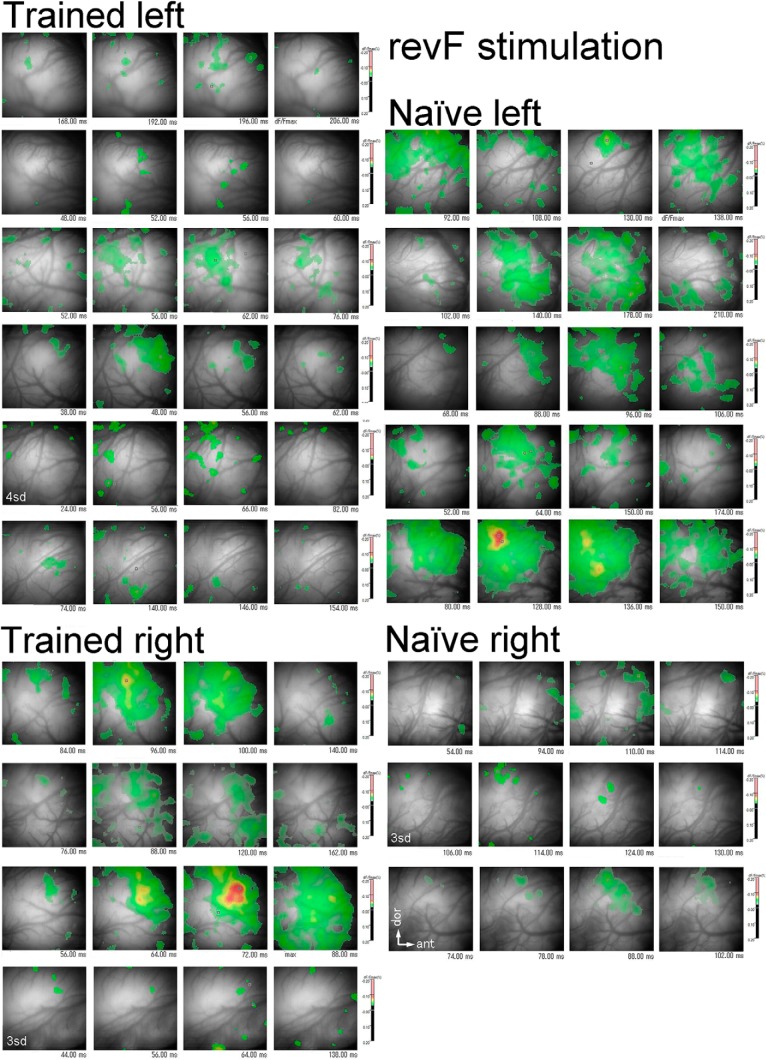
When complex sounds are reversed in time, the original and reversed versions are perceived differently in spectral and temporal dimensions despite their identical duration and long-term spectrum-power profiles. Spatiotemporal activation patterns evoked by temporally asymmetric sound pairs demonstrate how the temporal envelope determines the readout of the spectrum. We examined the patterns of activation evoked by a temporally asymmetric sound pair in the primary auditory field (AI) of anesthetized guinea pigs and determined how discrimination training modified these patterns. Optical imaging using a voltage-sensitive dye revealed that a forward ramped-down natural sound (F) consistently evoked much stronger responses than its time-reversed, ramped-up counterpart (revF). The spatiotemporal maximum peak (maxP) of F-evoked activation was always greater than that of revF-evoked activation, and these maxPs were significantly separated within the AI. Although discrimination training did not affect the absolute magnitude of these maxPs, the revF-to-F ratio of the activation peaks calculated at the location where hemispheres were maximally activated (i.e., F-evoked maxP) was significantly smaller in the trained group. The F-evoked activation propagated across the AI along the temporal axis to the ventroanterior belt field (VA), with the local activation peak within the VA being significantly larger in the trained than in the naïve group. These results suggest that the innate network is more responsive to natural sounds of ramped-down envelopes than their time-reversed, unnatural sounds. The VA belt field activation might play an important role in emotional learning of sounds through its connections with amygdala.

Keywords: belt field; primary auditory field; sound discrimination; spatiotemporal activation; time-reversed sound; voltage-sensitive dye imaging.


Figures

None
Graphical abstract
Figure 1.
Figure 1.
The stimulus sound segments, F and revF, used for behavioral training and optical imaging. Sound stimuli are presented to animals as a train of four-time repeated F or revF segments in the optical imaging. A, The F segment is a normal natural sound (footstep sound) and the revF segment is its time-reversed version. B, The power spectrum (left) and sonogram (right) of the F segment. Note that the F and revF segments have an identical long-term power spectrum according to the Fourier transformation (Patterson, 1994a,b).
Figure 2.
Figure 2.
Tonotopic activation of the primary auditory cortex by a set of pure tones. Pure tones with a 200-ms duration and 5-ms onset/offset cosine ramps are reproduced at frequencies of 0.25, 0.5, 1, 2, 4, 8, and 16 kHz at 75-dB SPL in otherwise the similar manner to the asymmetric sound pair. On a conventional light micrograph (lower right), covering the anterior part of the guinea pig’s AI, the optical image frame (square) is superimposed. The approximate borders between the AI and DC field and those between the core AI and the belt VA are depicted by dotted lines. Thick blood vessels (a set of arrows) course along the pseudosylvian sulcus. Dots point to the maxima of activation evoked by different tones. For the tone-evoked activation maps, refer to Figure 3.
Figure 3.
Figure 3.
Temporal and spatial patterns of activation evoked by the temporally asymmetric sound pair. A, Differential optical response signals (dF/Fmax, %) recorded at single channels and an activation map generated from the signals recorded across all channels. a, Traces of the response signals averaged across four-time repeats of the stimulus sound train which consists of four identical segments of either F (left) or revF (right), as shown below each response trace. Note that the F- and revF-evoked response traces are different even if they are recorded from the same channel. The temporal trace of responses typically shows 4 transient positive deflections that are time-locked to the individual sound segments (asterisks). Note that depolarization takes negative dF/Fmax values that are represented as the upward deflection in the response traces. The shaded portion of the response trace in a is enlarged in the middle trace in b. b, Traces of the F-evoked response signals recorded at three different locations show the tempMs (arrows and arrowhead) in amplitude at different delay times after the sound onset. c, A 2-ms image frame, recorded at the time of the dotted vertical line in b, shows the map of activation that is above the threshold (i.e., 6 SD of the mean of spontaneous activities). The suprathreshold signals are color-coded according to their magnitude (scale bar). Each image frame has a spatial peak, and the largest of these peaks across all the frames recorded for a given trial is designated as the trial-unique maxP. The maxP of activation within the AI is indicated by the large dot in the map and corresponds to the peak (arrowhead) of the trace shown in b. The time when the image frame is recorded (imaging onset is 0) is shown just below the activation map. Image frames have the dimensions of 5 × 5 mm. B, C, Temporal sequence of activation maps evoked by the first F and the first revF segments (upper and lower panels, respectively) during the period of activation in the trained (B) and naïve (C) animals. The 6 SD of the mean of spontaneous activity values is used as the threshold. Large black dots indicate the maxPs within the AI. Small black dots in the F panels show the initial activation peak during the activation period. White dots in the F panels point to the maxP of F-evoked activation within the VA. Two temporal traces of the revF-evoked activation, one recorded at the channel of the revF-evoked maxP (large black dots in the revF panel) and the other recorded at the channel corresponding to the F-evoked maxP (open white squares), are shown below traces. Arrowheads and arrows indicate the tempM at the respective recording channels (note that the arrowhead on the trace recorded at the large black dots corresponds to the revF-evoked maxP). Dotted vertical lines on the revF-evoked traces indicate the time when different image frames are recorded.
Figure 4.
Figure 4.
Full-time course of trial-unique activation maps in the trained animal. The activation maps evoked by the 1st segments of F (A) and its time-reversed revF (B) in a trained animal are chronologically arranged at 2-ms intervals. The temporal traces of response signals recorded at the F- and revF-evoked maxPs (large dots in Af and Be') are shown below or above the respective frame sequences. In the revF-evoked activation map, the location where the F-evoked maxP is evoked is indicated by the open white square (Be'). The activation maps labeled with lower-case letters are derived from the hatched portions of the response traces. All image frames have the dimensions of 5 × 5 mm.
Figure 5.
Figure 5.
Full-time course of trial-unique activation maps in the naïve animal. The activation maps evoked by the 1st segments of F (A) and its time-reversed revF (B) in a naïve animal are chronologically arranged at 2- and 6-ms intervals, respectively. The temporal traces of response signals recorded at the F- and revF-evoked maxPs (large dots in Ae and Bn') are shown below or above the respective frame sequences. In the revF-evoked activation map, the location where the F-evoked maxP is evoked is indicated by the open white square (Bn'). The activation maps labeled with lower-case letters are derived from the hatched portions of the response traces. All image frames have the dimensions of 5 × 5 mm.
Figure 6.
Figure 6.
Trial-unique response traces recorded at the maxP. Temporal traces of the response signals (dF/Fmax, %) evoked by the first F segment at the channels where the spatiotemporal maxP within the AI is evoked. The sound waveforms below traces show the delay times and duration of the stimulus sounds (F and revF). The time of maxP is indicated by the dotted line for each trace. F, normal natural sound. revF, time-reversed version of F.
Figure 7.
Figure 7.
Quantitative comparisons of the peaks of sound-evoked signals between the F and revF stimulation and between the animal groups. A, The trial-unique maxPs of activation within the AI (mP) are compared between the F and revF stimulation (FmP and RmP) and between the naïve and trained (N and Tr) animal groups. The channel-unique tempMs (tM) of activation evoked by the revF at the location where the F-evoked maxP within the AI is recorded (RtM at FmP) are compared between the animal groups. B, Coordinate-based Euclidian distances between the F- and the revF-evoked maxP within the AI (FmP-RmP) are compared between the trained (Tr) and naïve (N) animal groups. These distances for the different animal groups are also separately compared with the spontaneous separation distance between the 2 mPs obtained by repeating the F stimulation twice (1stFmP-2ndFmP; i.e., the internal fluctuation). C, Ratios (or Contrasts) of the revF-evoked maxP relative to the F-evoked maxP within the AI (RmP/FmP) are compared between the different animal groups (left). Similarly, the ratios of the revF-evoked tempM at the location of the F-evoked maxP relative to the F-evoked maxP (RtM at FmP/FmP) are compared between the animal groups (right). D, Ratios of the F-evoked maxP within the VA relative to the F-evoked maxP within the AI (FmP.VA/FmP) are compared between the naïve (N) and trained (Tr) animal groups. Error bars indicate the standard deviation. ns, not significant.
Figure 8.
Figure 8.
Temporal sequence of the F-evoked activation maps. The activation period during which the F-evoked response signals (dF/Fmax, %) are above the threshold (6 SD of the mean of spontaneous activity values) is divided into four consecutive phases. The activation maps representing each of these phases are chronologically shown (from left to right) in a four-frame panel for a given hemisphere. All hemispheres used for the VA activation analysis are shown. The response signals are color-coded (scale bar, %) according to their magnitude. All scale bars have a magnitude range of -0.20-0.20%, and signal values beyond this range are converted to the range maximum, -0.20%. Domains of the peaked activation (red region) evoked by F stimulation tend to spread into the ventral one-fifth zone of the image frame (corresponding to the VA) and cross its ventral side more frequently in the trained than in the naïve group (Figure 9). Quantitatively, the maxPs of VA activation normalized to the maxPs of AI activation are significantly larger for the trained than for the naïve group (Fig. 7D). Hemispheres used in other figures are labeled with the white numbers in the left frame of panels. All maps are oriented in the same way (white arrow).
Figure 9.
Figure 9.
Temporal sequence of the revF-evoked activation maps. The activation period during which the revF-evoked response signals (dF/Fmax, %) are above the threshold (6 SD of the mean of the spontaneous activity values, but the 4 or 3 SD for some hemispheres as labeled directly) is divided into four consecutive phases. The hemisphere-unique activation maps representing each of these phases are chronologically arranged (from left to right) in a four-frame panel for a given hemisphere. All hemispheres used for the VA activation analysis are shown. The response signals are color-coded (scale bar, %) according to their magnitude. All scale bars have a magnitude range of -0.20-0.20%. Activation evoked by the revF stimulation is generally weak except for three hemispheres that have the peaked activation (small red domains) within the AI. However, none of the revF-stimulation evokes the peaked activation within the VA. The panels at the corresponding location of Figures 8 and 9 are of the same hemisphere. All maps are oriented in the same way (see white arrows).

Similar articles

Cited by

References

    1. Akeroyd MA, Patterson RD (1995) Discrimination of wideband noises modulated by a temporally asymmetric function. J Acoust Soc Am 98:2466–2474. 10.1121/1.414462 - DOI
    1. Albert DJ, Petrovic DM, Walsh ML (1989) Competitive experience activates testosterone-dependent social aggression toward unfamiliar males. Physiol Behav 45:723–727. - PubMed
    1. Berryman JC (1976) Guinea-pig vocalizations: their structure, causation and function. Z Tierpsychol 41:80–106. - PubMed
    1. Brewer AA, Barton B (2016) Maps of the auditory cortex. Annu Rev Neurosci 39:385–407. 10.1146/annurev-neuro-070815-014045 - DOI - PMC - PubMed
    1. Chemla S, Chavane F (2010) Voltage-sensitive dye imaging: technique review and models. J Physiol Paris 104:40–50. 10.1016/j.jphysparis.2009.11.009 - DOI - PubMed

LinkOut - more resources