

Lipidomic Signature of Progression of Chronic Kidney Disease in the Chronic Renal Insufficiency Cohort
- PMID: 28451650
- PMCID: PMC5402253
- DOI: 10.1016/j.ekir.2016.08.007
Lipidomic Signature of Progression of Chronic Kidney Disease in the Chronic Renal Insufficiency Cohort
Erratum in
-
Erratum: Afshinnia F, Rajendiran TM, Karnovsky A, et al. Lipidomic Signature of Progression of Chronic Kidney Disease in the Chronic Renal Insufficiency Cohort. Kidney Int Rep. 2016;1:256-268.Kidney Int Rep. 2017 Sep 18;2(6):1265. doi: 10.1016/j.ekir.2017.09.002. eCollection 2017 Nov. Kidney Int Rep. 2017. PMID: 29270538 Free PMC article.
Abstract
Introduction: Human studies report conflicting results on the predictive power of serum lipids on progression of chronic kidney disease (CKD). We aimed to systematically identify the lipids that predict progression to end-stage kidney disease.
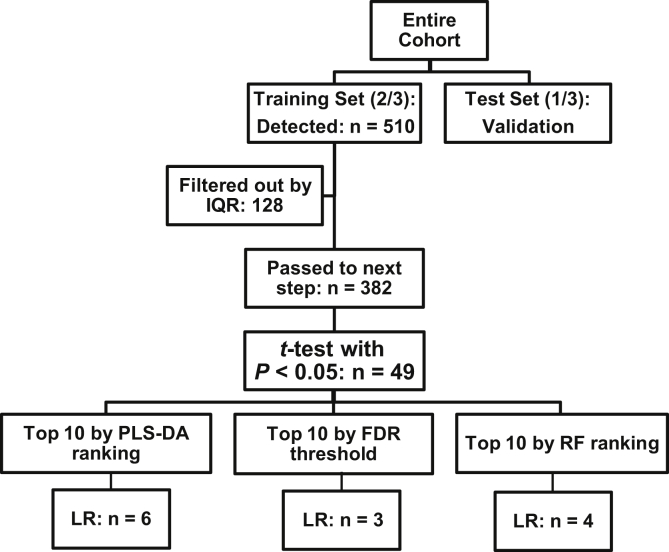
Methods: From the Chronic Renal Insufficiency Cohort, 79 patients with CKD stage 2 to 3 who progressed to ESKD over 6 years of follow up were selected and frequency-matched by age, sex, race, and diabetes with 121 non-progressors with less than 25% decline in estimated glomerular filtration rate (eGFR) during the follow up. The patients were randomly divided into Training and Test sets. We applied liquid chromatography-mass spectrometry-based lipidomics on visit year 1 samples.
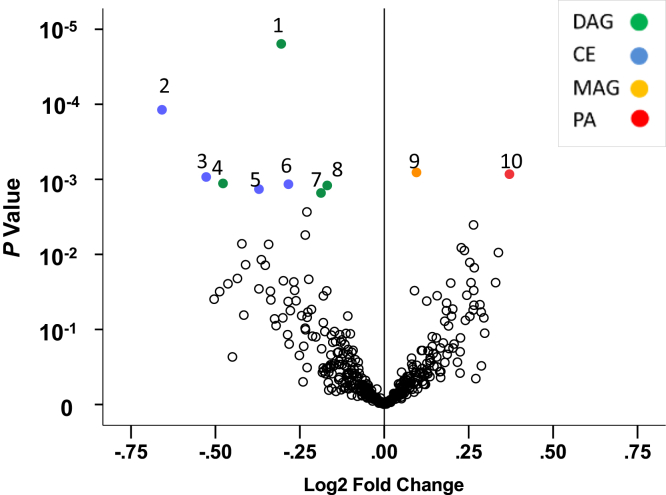
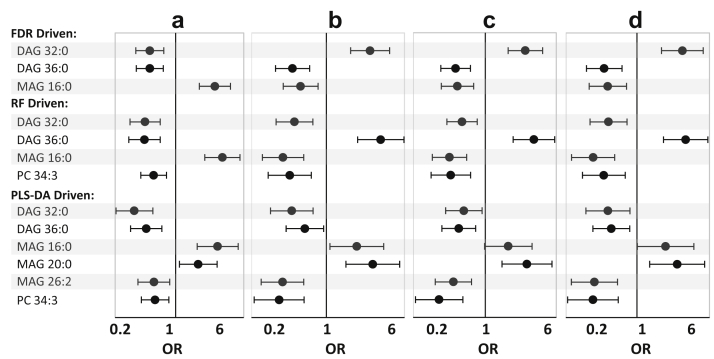
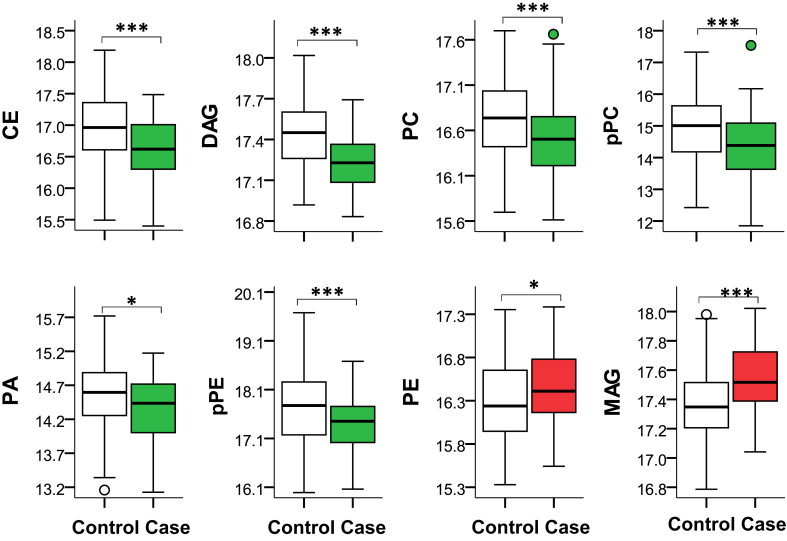
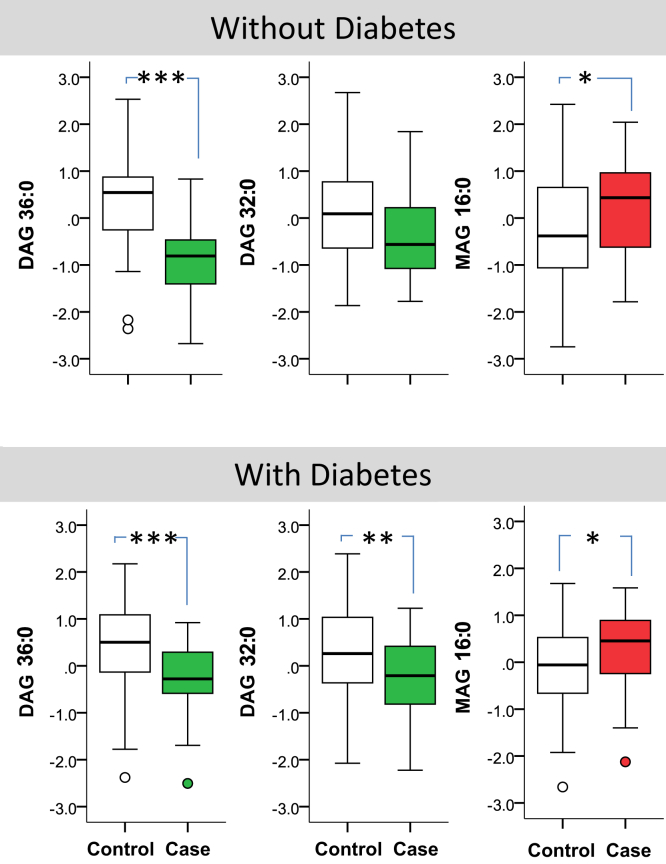
Results: We identified 510 lipids, of which the top 10 coincided with false discovery threshold of 0.058 in the Training set. From the top 10 lipids, the abundance of diacylglycerols (DAGs) and cholesteryl esters was lower, but that of phosphatidic acid 44:4 and monoacylglycerol (MAG) 16:0 was significantly higher in progressors. Using logistic regression models a multi-marker panel consisting of DAGs, and MAG independently predicted progression. The c-statistic of the multimarker panel added to the base model consisting of eGFR and urine protein-creatinine ratio (UPCR) as compared to that of the base model was 0.92 (95% Confidence Interval [CI]: 0.88-0.97), and 0.83 (95% CI: 0.76-0.90, P<0.01), respectively; an observation which was validated in the Test subset.
Conclusion: We conclude that a distinct panel of lipids may improve prediction of progression of CKD beyond eGFR and UPCR when added to the base model.
Keywords: Chronic Kidney Disease; Lipids; proteinuria.
Figures
References
-
- Centers for Disease Control. National Chronic Kidney Disease Fact Sheet 2010. Available at: www.cdc.gov/diabetes/projects/pdfs/ckd_summary.pdf. Accessed September 8, 2016.
-
- Rule A.D., Larson T.S., Bergstralh E.J. Using serum creatinine to estimate glomerular filtration rate: accuracy in good health and in chronic kidney disease. Ann Intern Med. 2004;141:929–937. - PubMed
Grants and funding
- U01 DK061028/DK/NIDDK NIH HHS/United States
- UL1 TR000433/TR/NCATS NIH HHS/United States
- DP3 DK094292/DK/NIDDK NIH HHS/United States
- U01 DK060984/DK/NIDDK NIH HHS/United States
- U01 DK061021/DK/NIDDK NIH HHS/United States
- P30 GM103337/GM/NIGMS NIH HHS/United States
- U01 DK060980/DK/NIDDK NIH HHS/United States
- U01 DK060963/DK/NIDDK NIH HHS/United States
- UL1 RR024131/RR/NCRR NIH HHS/United States
- R24 DK082841/DK/NIDDK NIH HHS/United States
- P30 DK089503/DK/NIDDK NIH HHS/United States
- U01 DK061022/DK/NIDDK NIH HHS/United States
- UL1 TR000003/TR/NCATS NIH HHS/United States
- UL1 TR000439/TR/NCATS NIH HHS/United States
- UL1 TR000424/TR/NCATS NIH HHS/United States
- M01 RR016500/RR/NCRR NIH HHS/United States
- U01 DK060902/DK/NIDDK NIH HHS/United States
- U01 DK060990/DK/NIDDK NIH HHS/United States
- P30 DK081943/DK/NIDDK NIH HHS/United States
- U24 DK097153/DK/NIDDK NIH HHS/United States
- K08 DK106523/DK/NIDDK NIH HHS/United States
- UL1 RR029879/RR/NCRR NIH HHS/United States
LinkOut - more resources
Full Text Sources
Other Literature Sources
Research Materials
Miscellaneous