. 2017 Jun;32(3):274-286.
doi: 10.1177/0748730417696787. Epub 2017 Apr 28.

Daily Light Exposure Patterns Reveal Phase and Period of the Human Circadian Clock

Affiliations

Daily Light Exposure Patterns Reveal Phase and Period of the Human Circadian Clock

Tom Woelders et al. J Biol Rhythms. 2017 Jun.

Abstract

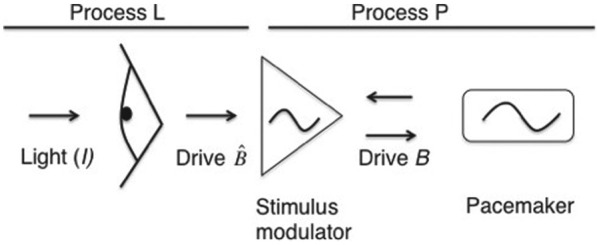
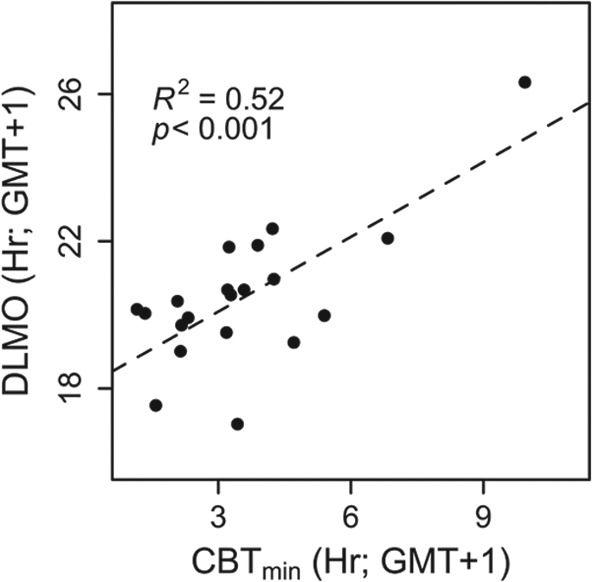
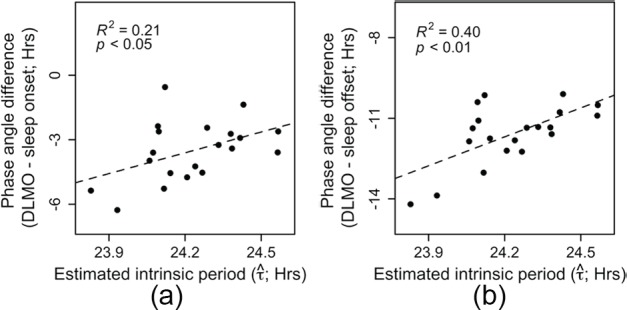
Light is the most potent time cue that synchronizes (entrains) the circadian pacemaker to the 24-h solar cycle. This entrainment process is an interplay between an individual's daily light perception and intrinsic pacemaker period under free-running conditions. Establishing individual estimates of circadian phase and period can be time-consuming. We show that circadian phase can be accurately predicted (SD = 1.1 h for dim light melatonin onset, DLMO) using 9 days of ambulatory light and activity data as an input to Kronauer's limit-cycle model for the human circadian system. This approach also yields an estimated circadian period of 24.2 h (SD = 0.2 h), with longer periods resulting in later DLMOs. A larger amount of daylight exposure resulted in an earlier DLMO. Individuals with a long circadian period also showed shorter intervals between DLMO and sleep timing. When a field-based estimation of tau can be validated under laboratory studies in a wide variety of individuals, the proposed methods may prove to be essential tools for individualized chronotherapy and light treatment for shift work and jetlag applications. These methods may improve our understanding of fundamental properties of human circadian rhythms under daily living conditions.

Keywords: CBT; DLMO; activity; ambulatory; circadian pacemaker; core body temperature; intrinsic period; light; modeling; tau.


Conflict of interest statement

Conflict of Interest Statement: The author(s) have no potential conflicts of interest with respect to the research, authorship, and/or publication of this article.

Figures

Figure 1.
Figure 1.
Graphic overview of information flow at each model iteration. On a per-minute basis, Kronauer’s model evaluates the effect of light (in lux) on the circadian pacemaker. When light is presented to the model, process L generates a drive B^, which is influenced by both the current intensity of light and the state of adaptation. This drive B^ is then altered by a stimulus modulator, based on the current phase and amplitude of the pacemaker, resulting in a modulated drive B. Drive B in turn affects the speed and amplitude with which the pacemaker oscillates.
Figure 2.
Figure 2.
Example of a simulated phase-delay. The Kronauer model responds to a 3-h, 9500-lux light pulse (gray arrow) starting 5 h before CBTmin (midnight in this example). (A) At baseline, the pacemaker follows the limit-cycle oscillation (black curve). This oscillation is modeled by 2 coupled variables describing the state of the pacemaker, x and xc. Variable x closely follows the core body temperature rhythm, whereas xc is a complementary variable that is mathematically required to achieve this oscillation. When the light stimulus is presented, the system is pushed away from the limit cycle (gray curve), leading to a deceleration of the pacemaker. At the end of the light-pulse (0300 h; filled circles connected to solid lines), the pacemaker is delayed as only 316.2° of 1 oscillation was traversed versus 342.6° in the absence of a light stimulus (0° and dashed line mark xmin, which corresponds to predicted CBTmin – 0.97h). (B) Overview of the state variable responses (solid lines, x; dashed lines, xc) to the same light pulse as in panel A. Compared with no light pulse (black lines), the rate of change in the 2 state variables (i.e., the speed of the pacemaker) is slowed down in response to light (gray curve), leading to a phase-delay.
Figure 3.
Figure 3.
Compiled dataset of participant BCM15. Top panel: 9 days of ambulatory light intensity data, plotted as log(lux; >1 lux), although the actual modeling was performed on the untransformed lux values. Middle panel: Concomitant ambulatory activity data. Dashed lines mark the estimated time of maximum activity. Bottom panel: Core body temperature data collected by 2 separate CBT pills. The dashed vertical lines mark CBTmin times for days 1, 2, 5, and 6. The gray curve follows the smoothed fit of CBT. △ denotes measured DLMO in all panels.
Figure 4.
Figure 4.
Relationship DLMO and time of core-body temperature minimum. Each data point represents the average of all CBTmin times available for each participant.
Figure 5.
Figure 5.
Model predictions for participant BCM15. Model-predicted CBTmin and DLMO (CBTminp▲, DLMOp▽), DLMO△ and Kronauer’s model prediction (variable x; gray curve) are plotted together with the relevant light profile. For this individual, DLMOp was at 1949 h, whereas measured DLMO was at 1915 h. Only intensities higher than 0 log(lux) were included for graphic display purposes. The actual modeling involved the raw lux values. The vertical dashed lines mark the measured CBTmin times during nights 1, 2, 5, and 6.
Figure 6.
Figure 6.
Model predictions for both CBTmin and DLMO. (A and C) The model-predicted CBTmin and DLMO times (CBTminp and DLMOp) show a significant positive relationship with CBTmin and DLMO, respectively. (B and D) When correcting the model predictions of CBTmin and DLMO for activity acrophase (CBTminp+φ and DLMOp+φ, respectively), 15% more variance in CBTmin and 19% more variance in DLMO were explained. The residual standard deviations corresponding to the regression analyses presented in panels A, B, C, and D were 1.46, 1.24, 1.4 and 1.1 h, respectively.
Figure 7.
Figure 7.
Intrinsic period estimation method. (A) The intrinsic τ of the model was iterated stepwise (from the initial τ of 24.2 h) for each participant until the time between DLMOi and DLMOp was <1 min. (B) Light intensity data of day 8 for participant BCM15, who showed a DLMO (△) earlier than predicted by the model with the default τ (◆). For this individual, aτ of 23.96 h resulted in a DLMOp (▲) that was identical to the measured DLMO. Dashed lines show CBTminp using the default (gray) and individual (black) τ. Solid lines show the value of state-variable x when the default (gray) or individual (black)τ was used.
Figure 8.
Figure 8.
Distribution and relationships of τ^ (A) Distribution of estimated intrinsic period compared with a sample of intrinsic period distributions reported using forced desynchrony protocols. The separate intrinsic periods are distributed with means (±SD) of 24.23 (±0.20; τ^{i….n}; field estimation; solid black line), 24.3 (±0.36; Hiddinga et al., 1997; dotted black line), 24.18 (±0.13; Czeisler et al., 1999; dashed black line), 24.07 (±0.17; Wright et al., 2005; solid gray line), 24.10 (±0.34; Gronfier et al., 2007; dotted gray line), 24.2 (±0.13; Burgess and Eastman, 2008; dashed gray line), and 24.15 (±0.20; Duffy et al., 2011; black dotted dashed line). (B) The relationship between DLMO and estimated intrinsic period was not significant. (C) The same relationship as in panel B. The color coding indicates the amount of daylight (% of minutes >615 lux, see Methods) to which each individual was exposed. Later DLMO values were related to longer intrinsic periods, apart from the individuals with the lowest amount of daylight exposure (dark points at τ ~ 24.1). DLMO was significantly (p < 0.001) explained by both estimated intrinsic period and the amount of daylight exposure, together contributing to a linear model that explained 69% of the variance in DLMO.
Figure 9.
Figure 9.
Relationships between sleep timing and estimated τ^ The phase angles between (A) sleep onset and DLMO and between (B) sleep offset and DLMO were both significantly and positively related to estimated intrinsic period such that individuals with longer estimated intrinsic periods scheduled their sleep window at a relatively early circadian phase (shorter duration between DLMO and sleep onset).

References

    1. Bates D, Mächler M, Bolker B. (2012). Fitting linear mixed-effects models using lme4. J Stat Softw 51:1-48.
    1. Beck AT, Steer RA, Brown GK. (1996). Manual for the Beck Depression Inventory—II. San Antonio, TX: Psychological Corporation.
    1. Benloucif S, Guico MJ, Reid KJ, Wolfe LF, L’hermite-Balériaux M, Zee PC. (2005). Stability of melatonin and temperature as circadian phase markers and their relation to sleep times in humans. J Biol Rhythms 20(2):178-188. - PubMed
    1. Bonmati-Carrion MA, Arguelles-Prieto R, Martinez-Madrid MJ, Reiter R, Hardeland R, Rol MA, Madrid JA. (2014). Protecting the melatonin rhythm through circadian healthy light exposure. Int J Mol Sci 15(12):23448-23500. - PMC - PubMed
    1. Brown EN, Choe Y, Shanahan TL, Czeisler CA. (1997). A mathematical model of diurnal variations in human plasma melatonin levels. Am J Physiol 272(3 Pt 1):E506-516. - PubMed

Publication types